Greaseproof Paper Sheets Market Size and Share Forecast Outlook 2025 to 2035

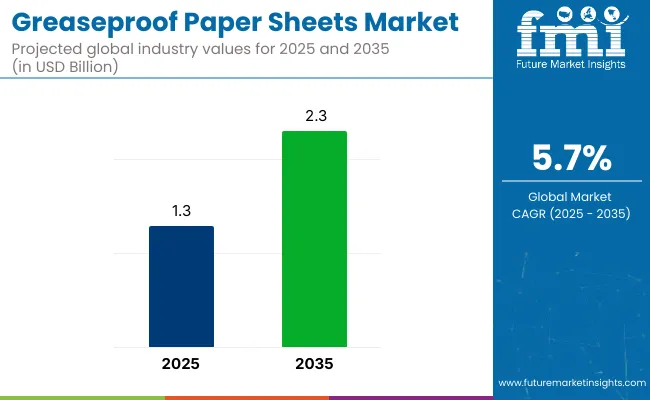
The greaseproof paper sheets market is projected to reach USD 1.3 billion in 2025 and expand to USD 2.3 billion by 2035, registering a CAGR of 5.7%. Sales in 2024 were recorded at USD 1.2 billion. Growth has been driven by increasing adoption of hygienic and grease-resistant wraps in foodservice and bakery segments.
Quick Stats of Greaseproof paper sheets Market

  • Market Value (2025): USD 1.3 billion
  • Forecast Value (2035): USD 2.3 billion
  • Forecast CAGR: 5.7%
  • Product Leader in 2025: Bleached (62.4% market share)
  • Top Application: Baking and Cooking (44.6% share)
  • Key Growth Country: South Asia & Pacific (India is the fastest-growing market with 7.1% CAGR)

Greaseproof Paper Sheets Market

Attributes Description
Estimated Market Size (2025E) USD 1.3 billion
Projected Market Value (2035F) USD 2.3 billion
Value-based CAGR (2025 to 2035) 5.7% 

Greater consumption of takeaway meals and artisanal baked products has been supported by widespread use of non-stick, aesthetic packaging formats.

In 2023, a facility expansion was announced by Nordic Paper to address rising demand for greaseproof paper in the food industry. “Our expansion is a direct response to strong market signals and will strengthen our position as a leading supplier in sustainable food packaging,” was stated by Anita Paulsson, EVP of Sales and Marketing at Nordic Paper.Converting lines and technological upgrades were included to improve product consistency. The move was aligned with market trends observed across global quick-service restaurants and regional food distributors.

Technical upgrades in coating and fiber engineering have been introduced to improve tensile strength, heat resistance, and non-stick performance. Product designs have been adjusted to enable compatibility with auto-wrap systems and folding applications.

Enhanced digital printing and precision cutting have been developed to improve brand visibility and handling efficiency. Innovation efforts have been concentrated on optimizing cost-efficiency and end-use versatility for bakery and fast-food packaging.

Growth opportunities are expected to emerge through the adoption of customized, multilayer greaseproof solutions in foodservice operations. Industry players are anticipated to prioritize compatibility with automated converters and differentiated product formats.

Demand across Southeast Asia and Latin America is forecasted to rise due to urbanization and quick-service retail penetration. Strategic focus is likely to remain on regional expansion, acquisition of paper converters, and food-grade paper innovation.

Analyzing Greaseproof Paper Sheets Market by Top Investment Segment

The market has been segmented based on product type, product offering, weight, application, end-use industry, and region. By product type, bleached and unbleached greaseproof paper have been included to address varied visual and functional preferences. Fluro-carbon based and fluro-carbon free variants have been offered under product offerings to meet diverse regulatory and environmental requirements.

By weight, segments have been defined as <40 GSM, 40-80 GSM, and 80 GSM to serve distinct barrier and durability needs. Applications have been categorized into baking/cooking and food packaging, with the latter further segmented into paper bags, wrapping paper, laminating base paper, microflute paper, clamshells, and others.

Confectionery, poultry, fresh produce, fast foods, and others have been identified as the major end-use industries. Regional coverage has been provided for North America, Latin America, East Asia, South Asia & Pacific, Eastern Europe, Western Europe, Oceania, and the Middle East & Africa.
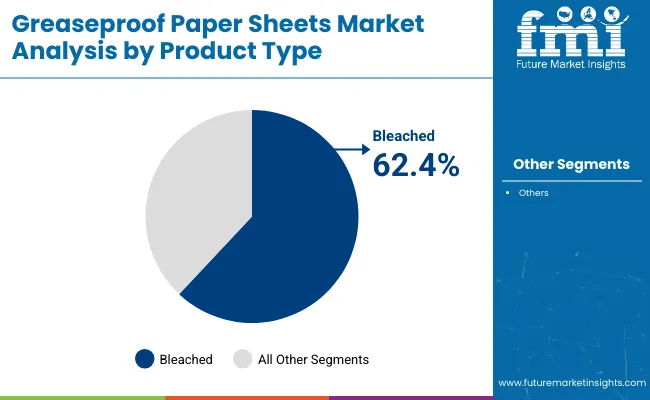
Bleached Grades Preferred for Their Cleanliness and Versatility in Food Contact

Greaseproof Paper Sheets Market Analysis By Product Type

Bleached paper is projected to account for 62.4% of the temperature logger packaging market in 2025 due to its hygienic finish, smooth printability, and adherence to food and pharma standards. These grades have been widely utilized for primary and secondary packaging in sterile and regulatory-driven environments.

Compatibility with sealing systems and barrier coatings has been leveraged for use in cold chain packaging. Enhanced brand visibility has been enabled while maintaining clean-room acceptance across foodservice and diagnostics supply chains.

Superior adaptability to printing and variable labeling has been demonstrated by bleached grades, especially for traceable shipping of temperature-sensitive cargo. Their adoption has been supported by minimal odor, high brightness, and chemical inertness, suitable for high-purity use cases. FSC-certified variants have been increasingly selected in alignment with sustainability mandates. Demand has been anticipated to rise due to increased pharma volumes and standardized meal kit logistics.
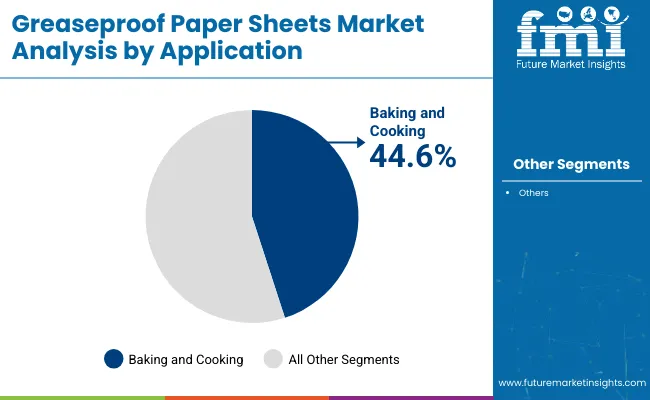
Baking and Cooking Applications Favored Amid Meal Kit and Delivery Expansion

Greaseproof Paper Sheets Market Analysis By Application

Baking and cooking applications are anticipated to contribute 44.6% of the temperature logger packaging market in 2025, as demand for meal kits, frozen doughs, and cook-ready items has surged. Food-grade thermal packaging has been required to preserve freshness, inhibit contamination, and withstand direct appliance integration.

Embedded loggers have been increasingly used to monitor safety thresholds across last-mile delivery networks. Compliance and product integrity have been ensured for frozen, parbaked, and semi-prepped goods.

Logger integration has been adopted for real-time thermal validation throughout manufacturing and fulfillment stages. Assurance of cold chain protection has been emphasized by e-commerce and grocery distributors offering perishable meal products. Allergy-conscious segments and freshness verification claims have driven usage among premium culinary brands. Continued demand has been expected for logger-ready packaging in cooking-specific logistics flows.

Drivers

Growing Food Industry

The food industry is expanding rapidly, leading to a higher demand for packaging solutions. Greaseproof paper sheets are essential for restaurants, cafes, and food delivery services.

They help keep food fresh and prevent leaks, which is important for maintaining quality. As more people eat out or order food online, the need for reliable packaging increases. This trend drives the growth of the greaseproof paper sheets market.

Focus on Sustainability

Environmental concerns are on the rise, and many buyers favour eco-friendly goods. Sheets of greaseproof paper manufactured from eco-friendly materials are growing in popularity. These sheets are a better option for the environment because they are frequently reusable and biodegradable.

Businesses are providing more environmentally friendly solutions in response to this demand. As more companies look to lessen their environmental effect, this emphasis on sustainability is driving the market ahead.

Convenience in Food Preparation

People are searching for methods to simplify the process of preparing and serving meals. Sheets of greaseproof paper offer an easy way to bake, cook, and package food. They save time and labour by preventing stickiness and simplifying cleanup.

Convenient cooking options are in greater demand as busy lifestyles become increasingly prevalent. Greaseproof paper sheets are becoming more and more popular in both household and commercial kitchens as a result of this trend.

Restraints

Competition from Alternative Products

Other packaging materials compete in the market for greaseproof paper sheets. Commonly used and maybe less expensive products are aluminium foil and plastic wrapping.

For convenience, some customers might select these substitutes. The market expansion for greaseproof paper sheets may be constrained by this rivalry since businesses need to figure out how to set their products apart and emphasise their advantages.

Price Sensitivity

Many consumers are sensitive to price changes, especially in the food industry. If the cost of greaseproof paper sheets rises, some businesses may look for cheaper options. This price sensitivity can affect sales and limit market growth. Companies need to find ways to keep prices competitive while maintaining quality to attract and retain customers.

Consumer Trend Highlights

Consumers are increasingly aware of the importance of food safety and quality. Many people prefer packaging that keeps their food fresh and safe from contamination. Greaseproof paper sheets are ideal for this purpose since they stop oil and grease from leaking through. Cooking at home is also becoming more popular.

As a result of this trend, more individuals use greaseproof paper sheets for meal preparation. Additionally, consumers value environmentally friendly items, which encourages them to select sustainable solutions. Overall, as people look for quality, convenience, and environmental responsibility in their food choices, the need for greaseproof paper sheets is growing.

Key Trends Highlights

The greaseproof paper sheets market is witnessing several key trends. First, there is a noticeable shift toward eco-friendly materials. Many manufacturers are now producing sheets from recycled paper or sustainable sources, responding to consumer demand for greener options.

Customization is becoming popular. Businesses are looking for specific sizes and designs to meet their unique needs. This trend allows companies to stand out in a competitive market. Third, the rise of online food delivery services is driving demand. As more people order food online, the need for reliable packaging solutions such as greaseproof paper sheets increases. These trends highlight the evolving landscape of the market, focusing on sustainability, customization, and convenience.
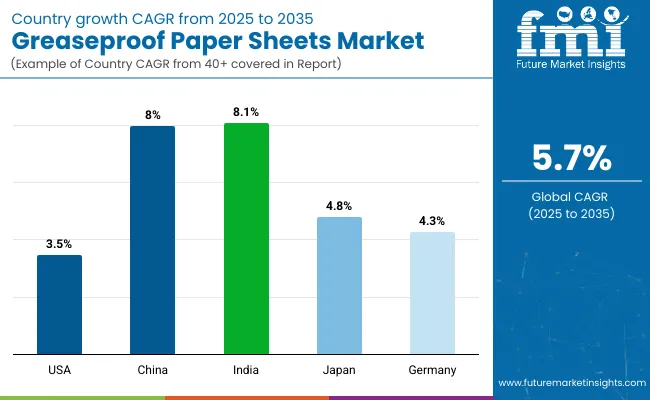
Country-wise Analysis

Country Analysis Of Greaseproof Paper Sheets Market

Countries CAGR
USA 3.5%
China 8.0%
India 8.1%
Japan 4.8%
Germany 4.3%

USA is Expected to Witness High Demand in the Forthcoming Years

The rising demand for food delivery is projected to fuel growth in the USA greaseproof paper market. As more individuals place food orders online, eateries must use trusted packaging to maintain the freshness of their food. Sustainability is also given a lot of attention, and many customers choose eco-friendly goods. Demand is increased by the rise in preference for home cooking, as more people use these sheets for meal preparation.

China’s Rapid Urbanization Drives Industry Growth

In China, the greaseproof paper industry is expected to expand rapidly due to the booming food delivery industry. As urbanization increases, more people are living busy lives and relying on ready-to-eat meals. Restaurants and food vendors need effective packaging to maintain food quality during transport.

Additionally, as people become more aware of health, this makes consumers to seek safer, non-toxic packaging options. The government's push for sustainable practices also encourages the use of eco-friendly materials. These factors contribute to a positive outlook for the greaseproof paper market in China.

India’s Focus on High-Quality Packaging

The rising food service sector is fuelling the growth of the greaseproof paper market in India. As more cafés and restaurants operate, there is a greater demand for high-quality packaging. Convenience meals are becoming more popular among Indian customers, and this frequently calls for efficient packaging solutions.

As families search for quick and simple ways to make meals, home cooking is also becoming popular. Additionally, there is a growing market for environmentally friendly items, and many buyers choose natural packaging materials. India has a high need for greaseproof paper sheets as a result of these trends.

Japan’s Food Culture Drives Efficient Packaging

Japan's greaseproof paper market is likely to grow due to the country’s unique food culture. Many traditional Japanese dishes require careful packaging to maintain freshness and presentation. The increasing popularity of bento boxes and ready-to-eat meals boosts the demand for greaseproof paper.

Additionally, Japanese consumers value quality and safety in food packaging, leading to a preference for non-toxic materials. With a growing focus on sustainability, there is also a shift towards eco-friendly packaging options. These factors support the expansion of the greaseproof paper market in Japan.

Germany Stresses on Efficiency and Longevity

In Germany, the greaseproof paper market is expected to grow as sustainability becomes a key concern for consumers. Many Germans prefer eco-friendly packaging solutions, and greaseproof paper made from recycled materials fits this demand. The rise of the food delivery sector also contributes to market growth, as restaurants need effective packaging for takeout meals.

Additionally, the trend of healthy eating is driving demand for safe and natural food packaging. As more people focus on convenience and quality, the greaseproof paper market in Germany is well-positioned for growth.

Competitive Landscape

The greaseproof paper market is competitive in terms of having many well-established players along with new competitors vying for share of the market. Brand experience and reputation enable the old brands to deliver quality products that cater to consumer requirement of safety and sustainability in high numbers. There is a clear trend towards eco materials, and many companies are answering with green packaging solutions.

Collaborations and partnerships between manufacturers, distributors as well food service providers are rampant which tends to strengthen distribution networks and extended market penetration. In general, the competitive picture is fluid with trends in consumer preferences and sustainable packaging requirements of the food industry as some core forces.

Market Strategies

Businesses are concentrating on a few crucial tactics in order to expand in the greaseproof paper market. First, a lot of companies are focussing on sustainability by creating environmentally friendly goods. Customers that value the environment and favour eco-friendly packaging solutions are drawn in by this strategy. Businesses may reach a rising market of environmentally conscious consumers by utilising recycled materials and cutting waste.

Innovation is a significant strategy. Businesses are spending high on research to make their greaseproof paper goods better and stronger enabling the longevity of food freshness. Partnerships also play a crucial role in growth. By collaborating with food service providers and distributors, companies are expanding their reach and connecting with more customers. These partnerships help ensure that products are available where consumers want them.

Customization is gaining importance as well. Businesses are providing customised solutions to satisfy the unique requirements of many industries, including bakeries, restaurants, and food delivery services. Their products are attractive and practical because of this adaptability.

Key Companies

  • Nordic Paper
  • Metsä Tissue
  • Segezha Group
  • SWM International
  • RP Paper Impex
  • Navbharat Industries
  • Fujian Naoshan Paper Industry Group Co., Ltd.
  • Yiwu Natural Paper Products Co., Ltd.
  • PT. Pura Barutama
  • Arrosi

Key Segmentation

By Basis Weight:

  • <40 GSM
  • 40-80 GSM
  • 80 GSM

By Product Type:

  • Bleached
  • Unbleached

By Product Offering:

  • Fluro-carbon based
  • Fluro-carbon Free

By End Use:

  • Confectionary
  • Poultry
  • Fresh Produce
  • Fast Foods
  • Others

By Application:

  • Baking/Cooking
  • Food Packaging
    • Paper Bags
    • Wrapping Paper
    • Laminating Base Paper
    • Microflute Paper
    • Clamshells
  • Others

By Region:

  • North America
  • Latin America
  • Europe
  • East Asia
  • South Asia
  • Oceania
  • MEA

Table of Content

  1. Executive Summary
    • Global Market Outlook
    • Demand-side Trends
    • Supply-side Trends
    • Technology Roadmap Analysis
    • Analysis and Recommendations
  2. Market Overview
    • Market Coverage/Taxonomy
    • Market Definition/Scope/Limitations
  3. Market Background
    • Market Dynamics
      • Drivers
      • Restraints
      • Opportunity
      • Trends
    • Scenario Forecast
      • Demand in Optimistic Scenario
      • Demand in Likely Scenario
      • Demand in Conservative Scenario
    • Opportunity Map Analysis
    • Product Life Cycle Analysis
    • Supply Chain Analysis
      • Supply Side Participants and their Roles
        • Producers
        • Mid-Level Participants (Traders/ Agents/ Brokers)
        • Wholesalers and Distributors
      • Value Added and Value Created at Node in the Supply Chain
      • List of Raw Material Suppliers
      • List of Existing and Potential Buyer’s
    • Investment Feasibility Matrix
    • Value Chain Analysis
      • Profit Margin Analysis
      • Wholesalers and Distributors
      • Retailers
    • PESTLE and Porter’s Analysis
    • Regulatory Landscape
      • By Key Regions
      • By Key Countries
    • Regional Parent Market Outlook
    • Production and Consumption Statistics
    • Import and Export Statistics
  4. Global Market Analysis 2020 to 2024 and Forecast, 2025 to 2035
    • Historical Market Size Value (USD Billion) & Volume (Units) Analysis, 2020 to 2024
    • Current and Future Market Size Value (USD Billion) & Volume (Units) Projections, 2025 to 2035
      • Y-o-Y Growth Trend Analysis
      • Absolute $ Opportunity Analysis
  5. Global Market Pricing Analysis 2020 to 2024 and Forecast 2025 to 2035
  6. Global Market Analysis 2020 to 2024 and Forecast 2025 to 2035, By Product Type
    • Introduction/Key Findings
    • Historical Market Size Value (USD Billion) & Volume (Units) Analysis By Product Type, 2020 to 2024
    • Current and Future Market Size Value (USD Billion) & Volume (Units) Analysis and Forecast By Product Type, 2025 to 2035
      • Bleached
      • Unbleached
    • Y-o-Y Growth Trend Analysis By Product Type, 2020 to 2024
    • Absolute $ Opportunity Analysis By Product Type, 2025 to 2035
  7. Global Market Analysis 2020 to 2024 and Forecast 2025 to 2035, By Product Offering
    • Introduction/Key Findings
    • Historical Market Size Value (USD Billion) & Volume (Units) Analysis By Product Offering, 2020 to 2024
    • Current and Future Market Size Value (USD Billion) & Volume (Units) Analysis and Forecast By Product Offering, 2025 to 2035
      • Fluro-carbon based
      • Fluro-carbon Free
    • Y-o-Y Growth Trend Analysis By Product Offering, 2020 to 2024
    • Absolute $ Opportunity Analysis By Product Offering, 2025 to 2035
  8. Global Market Analysis 2020 to 2024 and Forecast 2025 to 2035, By Weight
    • Introduction/Key Findings
    • Historical Market Size Value (USD Billion) & Volume (Units) Analysis By Weight, 2020 to 2024
    • Current and Future Market Size Value (USD Billion) & Volume (Units) Analysis and Forecast By Weight, 2025 to 2035
      • <40 GSM
      • 40-80 GSM
      • 80 GSM
    • Y-o-Y Growth Trend Analysis By Weight, 2020 to 2024
    • Absolute $ Opportunity Analysis By Weight, 2025 to 2035
  9. Global Market Analysis 2020 to 2024 and Forecast 2025 to 2035, By Application
    • Introduction/Key Findings
    • Historical Market Size Value (USD Billion) & Volume (Units) Analysis By Application, 2020 to 2024
    • Current and Future Market Size Value (USD Billion) & Volume (Units) Analysis and Forecast By Application, 2025 to 2035
      • Baking/Cooking
      • Food Packaging
        • Paper Bags
        • Wrapping Paper
        • Laminating Base Paper
        • Microflute Paper
        • Clamshells
      • Others
    • Y-o-Y Growth Trend Analysis By Application, 2020 to 2024
    • Absolute $ Opportunity Analysis By Application, 2025 to 2035
  10. Global Market Analysis 2020 to 2024 and Forecast 2025 to 2035, By End-Use
    • Introduction/Key Findings
    • Historical Market Size Value (USD Billion) & Volume (Units) Analysis By End-Use, 2020 to 2024
    • Current and Future Market Size Value (USD Billion) & Volume (Units) Analysis and Forecast By End-Use, 2025 to 2035
      • Confectionary
      • Poultry
      • Fresh Produce
      • Fast Foods
      • Others
    • Y-o-Y Growth Trend Analysis By End-Use, 2020 to 2024
    • Absolute $ Opportunity Analysis By End-Use, 2025 to 2035
  11. Global Market Analysis 2020 to 2024 and Forecast 2025 to 2035, By Region
    • Introduction
    • Historical Market Size Value (USD Billion) & Volume (Units) Analysis By Region, 2020 to 2024
    • Current Market Size Value (USD Billion) & Volume (Units) Analysis and Forecast By Region, 2025 to 2035
      • North America
      • Latin America
      • Europe
      • East Asia
      • South Asia
      • Oceania
      • MEA
    • Market Attractiveness Analysis By Region
  12. North America Market Analysis 2020 to 2024 and Forecast 2025 to 2035, By Country
    • Historical Market Size Value (USD Billion) & Volume (Units) Trend Analysis By Market Taxonomy, 2020 to 2024
    • Market Size Value (USD Billion) & Volume (Units) Forecast By Market Taxonomy, 2025 to 2035
      • By Country
        • USA
        • Canada
      • By Product Type
      • By Product Offering
      • By Weight
      • By Application
      • By End-Use
    • Market Attractiveness Analysis
      • By Country
      • By Product Type
      • By Product Offering
      • By Weight
      • By Application
      • By End-Use
    • Key Takeaways
  13. Latin America Market Analysis 2020 to 2024 and Forecast 2025 to 2035, By Country
    • Historical Market Size Value (USD Billion) & Volume (Units) Trend Analysis By Market Taxonomy, 2020 to 2024
    • Market Size Value (USD Billion) & Volume (Units) Forecast By Market Taxonomy, 2025 to 2035
      • By Country
        • Brazil
        • Mexico
        • Argentina
        • Chile
        • Peru
        • Rest of Latin America
      • By Product Type
      • By Product Offering
      • By Weight
      • By Application
      • By End-Use
    • Market Attractiveness Analysis
      • By Country
      • By Product Type
      • By Product Offering
      • By Weight
      • By Application
      • By End-Use
    • Key Takeaways
  14. Europe Market Analysis 2020 to 2024 and Forecast 2025 to 2035, By Country
    • Historical Market Size Value (USD Billion) & Volume (Units) Trend Analysis By Market Taxonomy, 2020 to 2024
    • Market Size Value (USD Billion) & Volume (Units) Forecast By Market Taxonomy, 2025 to 2035
      • By Country
        • Germany
        • Italy
        • France
        • UK
        • Spain
        • Russia
        • BENELUX
        • Rest of Europe
      • By Product Type
      • By Product Offering
      • By Weight
      • By Application
      • By End-Use
    • Market Attractiveness Analysis
      • By Country
      • By Product Type
      • By Product Offering
      • By Weight
      • By Application
      • By End-Use
    • Key Takeaways
  15. East Asia Market Analysis 2020 to 2024 and Forecast 2025 to 2035, By Country
    • Historical Market Size Value (USD Billion) & Volume (Units) Trend Analysis By Market Taxonomy, 2020 to 2024
    • Market Size Value (USD Billion) & Volume (Units) Forecast By Market Taxonomy, 2025 to 2035
      • By Country
        • China
        • Japan
        • South Korea
      • By Product Type
      • By Product Offering
      • By Weight
      • By Application
      • By End-Use
    • Market Attractiveness Analysis
      • By Country
      • By Product Type
      • By Product Offering
      • By Weight
      • By Application
      • By End-Use
    • Key Takeaways
  16. South Asia Market Analysis 2020 to 2024 and Forecast 2025 to 2035, By Country
    • Historical Market Size Value (USD Billion) & Volume (Units) Trend Analysis By Market Taxonomy, 2020 to 2024
    • Market Size Value (USD Billion) & Volume (Units) Forecast By Market Taxonomy, 2025 to 2035
      • By Country
        • India
        • Thailand
        • Malaysia
        • Indonesia
        • Rest of South Asia
      • By Product Type
      • By Product Offering
      • By Weight
      • By Application
      • By End-Use
    • Market Attractiveness Analysis
      • By Country
      • By Product Type
      • By Product Offering
      • By Weight
      • By Application
      • By End-Use
    • Key Takeaways
  17. Oceania Market Analysis 2020 to 2024 and Forecast 2025 to 2035, By Country
    • Historical Market Size Value (USD Billion) & Volume (Units) Trend Analysis By Market Taxonomy, 2020 to 2024
    • Market Size Value (USD Billion) & Volume (Units) Forecast By Market Taxonomy, 2025 to 2035
      • By Country
        • Australia
        • New Zealand
      • By Product Type
      • By Product Offering
      • By Weight
      • By Application
      • By End-Use
    • Market Attractiveness Analysis
      • By Country
      • By Product Type
      • By Product Offering
      • By Weight
      • By Application
      • By End-Use
    • Key Takeaways
  18. MEA Market Analysis 2020 to 2024 and Forecast 2025 to 2035, By Country
    • Historical Market Size Value (USD Billion) & Volume (Units) Trend Analysis By Market Taxonomy, 2020 to 2024
    • Market Size Value (USD Billion) & Volume (Units) Forecast By Market Taxonomy, 2025 to 2035
      • By Country
        • GCC
        • Rest of MEA
      • By Product Type
      • By Product Offering
      • By Weight
      • By Application
      • By End-Use
    • Market Attractiveness Analysis
      • By Country
      • By Product Type
      • By Product Offering
      • By Weight
      • By Application
      • By End-Use
    • Key Takeaways
  19. Key Countries Market Analysis
    • USA
      • Pricing Analysis
      • Market Share Analysis, 2024
        • By Product Type
        • By Product Offering
        • By Weight
        • By Application
        • By End-Use
    • Canada
      • Pricing Analysis
      • Market Share Analysis, 2024
        • By Product Type
        • By Product Offering
        • By Weight
        • By Application
        • By End-Use
    • Brazil
      • Pricing Analysis
      • Market Share Analysis, 2024
        • By Product Type
        • By Product Offering
        • By Weight
        • By Application
        • By End-Use
    • Mexico
      • Pricing Analysis
      • Market Share Analysis, 2024
        • By Product Type
        • By Product Offering
        • By Weight
        • By Application
        • By End-Use
    • Argentina
      • Pricing Analysis
      • Market Share Analysis, 2024
        • By Product Type
        • By Product Offering
        • By Weight
        • By Application
        • By End-Use
  20. Market Structure Analysis
    • Competition Dashboard
    • Competition Benchmarking
    • Market Share Analysis of Top Players
      • By Regional
      • By Product Type
      • By Product Offering
      • By Weight
      • By Application
      • By End-Use
  21. Competition Analysis
    • Competition Deep Dive
      • Pudumjee Paper Products Ltd.
        • Overview
        • Product Portfolio
        • Profitability by Market Segments (Product/Age /Sales Channel/Region)
        • Sales Footprint
        • Strategy Overview
          • Marketing Strategy
          • Product Strategy
          • Channel Strategy
      • Metsä Tissue
        • Overview
        • Product Portfolio
        • Profitability by Market Segments (Product/Age /Sales Channel/Region)
        • Sales Footprint
        • Strategy Overview
          • Marketing Strategy
          • Product Strategy
          • Channel Strategy
      • Segezha Group
        • Overview
        • Product Portfolio
        • Profitability by Market Segments (Product/Age /Sales Channel/Region)
        • Sales Footprint
        • Strategy Overview
          • Marketing Strategy
          • Product Strategy
          • Channel Strategy
      • SWM International
        • Overview
        • Product Portfolio
        • Profitability by Market Segments (Product/Age /Sales Channel/Region)
        • Sales Footprint
        • Strategy Overview
          • Marketing Strategy
          • Product Strategy
          • Channel Strategy
      • RP Paper Impex
        • Overview
        • Product Portfolio
        • Profitability by Market Segments (Product/Age /Sales Channel/Region)
        • Sales Footprint
        • Strategy Overview
          • Marketing Strategy
          • Product Strategy
          • Channel Strategy
      • Navbharat Industries
        • Overview
        • Product Portfolio
        • Profitability by Market Segments (Product/Age /Sales Channel/Region)
        • Sales Footprint
        • Strategy Overview
          • Marketing Strategy
          • Product Strategy
          • Channel Strategy
      • Fujian Naoshan Paper Industry Group Co., Ltd.
        • Overview
        • Product Portfolio
        • Profitability by Market Segments (Product/Age /Sales Channel/Region)
        • Sales Footprint
        • Strategy Overview
          • Marketing Strategy
          • Product Strategy
          • Channel Strategy
      • Yiwu Natural Paper Products Co., Ltd.
        • Overview
        • Product Portfolio
        • Profitability by Market Segments (Product/Age /Sales Channel/Region)
        • Sales Footprint
        • Strategy Overview
          • Marketing Strategy
          • Product Strategy
          • Channel Strategy
      • PT. Pura Barutama
        • Overview
        • Product Portfolio
        • Profitability by Market Segments (Product/Age /Sales Channel/Region)
        • Sales Footprint
        • Strategy Overview
          • Marketing Strategy
          • Product Strategy
          • Channel Strategy
      • Arrosi
        • Overview
        • Product Portfolio
        • Profitability by Market Segments (Product/Age /Sales Channel/Region)
        • Sales Footprint
        • Strategy Overview
          • Marketing Strategy
          • Product Strategy
          • Channel Strategy
  22. Assumptions & Acronyms Used
  23. Research Methodology

List of Tables

  • Table 1: Global Market Value (USD Billion) Forecast by Region, 2020-2035
  • Table 2: Global Market Volume (Units) Forecast by Region, 2020-2035
  • Table 3: Global Market Value (USD Billion) Forecast by Product Type, 2020-2035
  • Table 4: Global Market Volume (Units) Forecast by Product Type, 2020-2035
  • Table 5: Global Market Value (USD Billion) Forecast by Product Offering, 2020-2035
  • Table 6: Global Market Volume (Units) Forecast by Product Offering, 2020-2035
  • Table 7: Global Market Value (USD Billion) Forecast by Weight, 2020-2035
  • Table 8: Global Market Volume (Units) Forecast by Weight, 2020-2035
  • Table 9: Global Market Value (USD Billion) Forecast by Application, 2020-2035
  • Table 10: Global Market Volume (Units) Forecast by Application, 2020-2035
  • Table 11: Global Market Value (USD Billion) Forecast by End-Use, 2020-2035
  • Table 12: Global Market Volume (Units) Forecast by End-Use, 2020-2035
  • Table 13: North America Market Value (USD Billion) Forecast by Country, 2020-2035
  • Table 14: North America Market Volume (Units) Forecast by Country, 2020-2035
  • Table 15: North America Market Value (USD Billion) Forecast by Product Type, 2020-2035
  • Table 16: North America Market Volume (Units) Forecast by Product Type, 2020-2035
  • Table 17: North America Market Value (USD Billion) Forecast by Product Offering, 2020-2035
  • Table 18: North America Market Volume (Units) Forecast by Product Offering, 2020-2035
  • Table 19: North America Market Value (USD Billion) Forecast by Weight, 2020-2035
  • Table 20: North America Market Volume (Units) Forecast by Weight, 2020-2035
  • Table 21: North America Market Value (USD Billion) Forecast by Application, 2020-2035
  • Table 22: North America Market Volume (Units) Forecast by Application, 2020-2035
  • Table 23: North America Market Value (USD Billion) Forecast by End-Use, 2020-2035
  • Table 24: North America Market Volume (Units) Forecast by End-Use, 2020-2035
  • Table 25: Latin America Market Value (USD Billion) Forecast by Country, 2020-2035
  • Table 26: Latin America Market Volume (Units) Forecast by Country, 2020-2035
  • Table 27: Latin America Market Value (USD Billion) Forecast by Product Type, 2020-2035
  • Table 28: Latin America Market Volume (Units) Forecast by Product Type, 2020-2035
  • Table 29: Latin America Market Value (USD Billion) Forecast by Product Offering, 2020-2035
  • Table 30: Latin America Market Volume (Units) Forecast by Product Offering, 2020-2035
  • Table 31: Latin America Market Value (USD Billion) Forecast by Weight, 2020-2035
  • Table 32: Latin America Market Volume (Units) Forecast by Weight, 2020-2035
  • Table 33: Latin America Market Value (USD Billion) Forecast by Application, 2020-2035
  • Table 34: Latin America Market Volume (Units) Forecast by Application, 2020-2035
  • Table 35: Latin America Market Value (USD Billion) Forecast by End-Use, 2020-2035
  • Table 36: Latin America Market Volume (Units) Forecast by End-Use, 2020-2035
  • Table 37: Europe Market Value (USD Billion) Forecast by Country, 2020-2035
  • Table 38: Europe Market Volume (Units) Forecast by Country, 2020-2035
  • Table 39: Europe Market Value (USD Billion) Forecast by Product Type, 2020-2035
  • Table 40: Europe Market Volume (Units) Forecast by Product Type, 2020-2035
  • Table 41: Europe Market Value (USD Billion) Forecast by Product Offering, 2020-2035
  • Table 42: Europe Market Volume (Units) Forecast by Product Offering, 2020-2035
  • Table 43: Europe Market Value (USD Billion) Forecast by Weight, 2020-2035
  • Table 44: Europe Market Volume (Units) Forecast by Weight, 2020-2035
  • Table 45: Europe Market Value (USD Billion) Forecast by Application, 2020-2035
  • Table 46: Europe Market Volume (Units) Forecast by Application, 2020-2035
  • Table 47: Europe Market Value (USD Billion) Forecast by End-Use, 2020-2035
  • Table 48: Europe Market Volume (Units) Forecast by End-Use, 2020-2035
  • Table 49: East Asia Market Value (USD Billion) Forecast by Country, 2020-2035
  • Table 50: East Asia Market Volume (Units) Forecast by Country, 2020-2035
  • Table 51: East Asia Market Value (USD Billion) Forecast by Product Type, 2020-2035
  • Table 52: East Asia Market Volume (Units) Forecast by Product Type, 2020-2035
  • Table 53: East Asia Market Value (USD Billion) Forecast by Product Offering, 2020-2035
  • Table 54: East Asia Market Volume (Units) Forecast by Product Offering, 2020-2035
  • Table 55: East Asia Market Value (USD Billion) Forecast by Weight, 2020-2035
  • Table 56: East Asia Market Volume (Units) Forecast by Weight, 2020-2035
  • Table 57: East Asia Market Value (USD Billion) Forecast by Application, 2020-2035
  • Table 58: East Asia Market Volume (Units) Forecast by Application, 2020-2035
  • Table 59: East Asia Market Value (USD Billion) Forecast by End-Use, 2020-2035
  • Table 60: East Asia Market Volume (Units) Forecast by End-Use, 2020-2035
  • Table 61: South Asia Market Value (USD Billion) Forecast by Country, 2020-2035
  • Table 62: South Asia Market Volume (Units) Forecast by Country, 2020-2035
  • Table 63: South Asia Market Value (USD Billion) Forecast by Product Type, 2020-2035
  • Table 64: South Asia Market Volume (Units) Forecast by Product Type, 2020-2035
  • Table 65: South Asia Market Value (USD Billion) Forecast by Product Offering, 2020-2035
  • Table 66: South Asia Market Volume (Units) Forecast by Product Offering, 2020-2035
  • Table 67: South Asia Market Value (USD Billion) Forecast by Weight, 2020-2035
  • Table 68: South Asia Market Volume (Units) Forecast by Weight, 2020-2035
  • Table 69: South Asia Market Value (USD Billion) Forecast by Application, 2020-2035
  • Table 70: South Asia Market Volume (Units) Forecast by Application, 2020-2035
  • Table 71: South Asia Market Value (USD Billion) Forecast by End-Use, 2020-2035
  • Table 72: South Asia Market Volume (Units) Forecast by End-Use, 2020-2035
  • Table 73: Oceania Market Value (USD Billion) Forecast by Country, 2020-2035
  • Table 74: Oceania Market Volume (Units) Forecast by Country, 2020-2035
  • Table 75: Oceania Market Value (USD Billion) Forecast by Product Type, 2020-2035
  • Table 76: Oceania Market Volume (Units) Forecast by Product Type, 2020-2035
  • Table 77: Oceania Market Value (USD Billion) Forecast by Product Offering, 2020-2035
  • Table 78: Oceania Market Volume (Units) Forecast by Product Offering, 2020-2035
  • Table 79: Oceania Market Value (USD Billion) Forecast by Weight, 2020-2035
  • Table 80: Oceania Market Volume (Units) Forecast by Weight, 2020-2035
  • Table 81: Oceania Market Value (USD Billion) Forecast by Application, 2020-2035
  • Table 82: Oceania Market Volume (Units) Forecast by Application, 2020-2035
  • Table 83: Oceania Market Value (USD Billion) Forecast by End-Use, 2020-2035
  • Table 84: Oceania Market Volume (Units) Forecast by End-Use, 2020-2035
  • Table 85: MEA Market Value (USD Billion) Forecast by Country, 2020-2035
  • Table 86: MEA Market Volume (Units) Forecast by Country, 2020-2035
  • Table 87: MEA Market Value (USD Billion) Forecast by Product Type, 2020-2035
  • Table 88: MEA Market Volume (Units) Forecast by Product Type, 2020-2035
  • Table 89: MEA Market Value (USD Billion) Forecast by Product Offering, 2020-2035
  • Table 90: MEA Market Volume (Units) Forecast by Product Offering, 2020-2035
  • Table 91: MEA Market Value (USD Billion) Forecast by Weight, 2020-2035
  • Table 92: MEA Market Volume (Units) Forecast by Weight, 2020-2035
  • Table 93: MEA Market Value (USD Billion) Forecast by Application, 2020-2035
  • Table 94: MEA Market Volume (Units) Forecast by Application, 2020-2035
  • Table 95: MEA Market Value (USD Billion) Forecast by End-Use, 2020-2035
  • Table 96: MEA Market Volume (Units) Forecast by End-Use, 2020-2035

List of Figures

  • Figure 1: Global Market Volume (Units) Forecast 2020-2035
  • Figure 2: Global Market Pricing Analysis
  • Figure 3: Global Market Value (USD Billion) Forecast 2020-2035
  • Figure 4: Global Market Value Share and BPS Analysis by Product Type, 2025 and 2035
  • Figure 5: Global Market Y-o-Y Growth Comparison by Product Type, 2025-2035
  • Figure 6: Global Market Attractiveness Analysis by Product Type
  • Figure 7: Global Market Value Share and BPS Analysis by Product Offering, 2025 and 2035
  • Figure 8: Global Market Y-o-Y Growth Comparison by Product Offering, 2025-2035
  • Figure 9: Global Market Attractiveness Analysis by Product Offering
  • Figure 10: Global Market Value Share and BPS Analysis by Weight, 2025 and 2035
  • Figure 11: Global Market Y-o-Y Growth Comparison by Weight, 2025-2035
  • Figure 12: Global Market Attractiveness Analysis by Weight
  • Figure 13: Global Market Value Share and BPS Analysis by Application, 2025 and 2035
  • Figure 14: Global Market Y-o-Y Growth Comparison by Application, 2025-2035
  • Figure 15: Global Market Attractiveness Analysis by Application
  • Figure 16: Global Market Value Share and BPS Analysis by End-Use, 2025 and 2035
  • Figure 17: Global Market Y-o-Y Growth Comparison by End-Use, 2025-2035
  • Figure 18: Global Market Attractiveness Analysis by End-Use
  • Figure 19: Global Market Value (USD Billion) Share and BPS Analysis by Region, 2025 and 2035
  • Figure 20: Global Market Y-o-Y Growth Comparison by Region, 2025-2035
  • Figure 21: Global Market Attractiveness Analysis by Region
  • Figure 22: North America Market Incremental $ Opportunity, 2025-2035
  • Figure 23: Latin America Market Incremental $ Opportunity, 2025-2035
  • Figure 24: Europe Market Incremental $ Opportunity, 2025-2035
  • Figure 25: East Asia Market Incremental $ Opportunity, 2025-2035
  • Figure 26: South Asia Market Incremental $ Opportunity, 2025-2035
  • Figure 27: Oceania Market Incremental $ Opportunity, 2025-2035
  • Figure 28: MEA Market Incremental $ Opportunity, 2025-2035
  • Figure 29: North America Market Value Share and BPS Analysis by Country, 2025 and 2035
  • Figure 30: North America Market Value Share and BPS Analysis by Product Type, 2025 and 2035
  • Figure 31: North America Market Y-o-Y Growth Comparison by Product Type, 2025-2035
  • Figure 32: North America Market Attractiveness Analysis by Product Type
  • Figure 33: North America Market Value Share and BPS Analysis by Product Offering, 2025 and 2035
  • Figure 34: North America Market Y-o-Y Growth Comparison by Product Offering, 2025-2035
  • Figure 35: North America Market Attractiveness Analysis by Product Offering
  • Figure 36: North America Market Value Share and BPS Analysis by Weight, 2025 and 2035
  • Figure 37: North America Market Y-o-Y Growth Comparison by Weight, 2025-2035
  • Figure 38: North America Market Attractiveness Analysis by Weight
  • Figure 39: North America Market Value Share and BPS Analysis by Application, 2025 and 2035
  • Figure 40: North America Market Y-o-Y Growth Comparison by Application, 2025-2035
  • Figure 41: North America Market Attractiveness Analysis by Application
  • Figure 42: North America Market Value Share and BPS Analysis by End-Use, 2025 and 2035
  • Figure 43: North America Market Y-o-Y Growth Comparison by End-Use, 2025-2035
  • Figure 44: North America Market Attractiveness Analysis by End-Use
  • Figure 45: Latin America Market Value Share and BPS Analysis by Country, 2025 and 2035
  • Figure 46: Latin America Market Value Share and BPS Analysis by Product Type, 2025 and 2035
  • Figure 47: Latin America Market Y-o-Y Growth Comparison by Product Type, 2025-2035
  • Figure 48: Latin America Market Attractiveness Analysis by Product Type
  • Figure 49: Latin America Market Value Share and BPS Analysis by Product Offering, 2025 and 2035
  • Figure 50: Latin America Market Y-o-Y Growth Comparison by Product Offering, 2025-2035
  • Figure 51: Latin America Market Attractiveness Analysis by Product Offering
  • Figure 52: Latin America Market Value Share and BPS Analysis by Weight, 2025 and 2035
  • Figure 53: Latin America Market Y-o-Y Growth Comparison by Weight, 2025-2035
  • Figure 54: Latin America Market Attractiveness Analysis by Weight
  • Figure 55: Latin America Market Value Share and BPS Analysis by Application, 2025 and 2035
  • Figure 56: Latin America Market Y-o-Y Growth Comparison by Application, 2025-2035
  • Figure 57: Latin America Market Attractiveness Analysis by Application
  • Figure 58: Latin America Market Value Share and BPS Analysis by End-Use, 2025 and 2035
  • Figure 59: Latin America Market Y-o-Y Growth Comparison by End-Use, 2025-2035
  • Figure 60: Latin America Market Attractiveness Analysis by End-Use
  • Figure 61: Europe Market Value Share and BPS Analysis by Country, 2025 and 2035
  • Figure 62: Europe Market Value Share and BPS Analysis by Product Type, 2025 and 2035
  • Figure 63: Europe Market Y-o-Y Growth Comparison by Product Type, 2025-2035
  • Figure 64: Europe Market Attractiveness Analysis by Product Type
  • Figure 65: Europe Market Value Share and BPS Analysis by Product Offering, 2025 and 2035
  • Figure 66: Europe Market Y-o-Y Growth Comparison by Product Offering, 2025-2035
  • Figure 67: Europe Market Attractiveness Analysis by Product Offering
  • Figure 68: Europe Market Value Share and BPS Analysis by Weight, 2025 and 2035
  • Figure 69: Europe Market Y-o-Y Growth Comparison by Weight, 2025-2035
  • Figure 70: Europe Market Attractiveness Analysis by Weight
  • Figure 71: Europe Market Value Share and BPS Analysis by Application, 2025 and 2035
  • Figure 72: Europe Market Y-o-Y Growth Comparison by Application, 2025-2035
  • Figure 73: Europe Market Attractiveness Analysis by Application
  • Figure 74: Europe Market Value Share and BPS Analysis by End-Use, 2025 and 2035
  • Figure 75: Europe Market Y-o-Y Growth Comparison by End-Use, 2025-2035
  • Figure 76: Europe Market Attractiveness Analysis by End-Use
  • Figure 77: East Asia Market Value Share and BPS Analysis by Country, 2025 and 2035
  • Figure 78: East Asia Market Value Share and BPS Analysis by Product Type, 2025 and 2035
  • Figure 79: East Asia Market Y-o-Y Growth Comparison by Product Type, 2025-2035
  • Figure 80: East Asia Market Attractiveness Analysis by Product Type
  • Figure 81: East Asia Market Value Share and BPS Analysis by Product Offering, 2025 and 2035
  • Figure 82: East Asia Market Y-o-Y Growth Comparison by Product Offering, 2025-2035
  • Figure 83: East Asia Market Attractiveness Analysis by Product Offering
  • Figure 84: East Asia Market Value Share and BPS Analysis by Weight, 2025 and 2035
  • Figure 85: East Asia Market Y-o-Y Growth Comparison by Weight, 2025-2035
  • Figure 86: East Asia Market Attractiveness Analysis by Weight
  • Figure 87: East Asia Market Value Share and BPS Analysis by Application, 2025 and 2035
  • Figure 88: East Asia Market Y-o-Y Growth Comparison by Application, 2025-2035
  • Figure 89: East Asia Market Attractiveness Analysis by Application
  • Figure 90: East Asia Market Value Share and BPS Analysis by End-Use, 2025 and 2035
  • Figure 91: East Asia Market Y-o-Y Growth Comparison by End-Use, 2025-2035
  • Figure 92: East Asia Market Attractiveness Analysis by End-Use
  • Figure 93: South Asia Market Value Share and BPS Analysis by Country, 2025 and 2035
  • Figure 94: South Asia Market Value Share and BPS Analysis by Product Type, 2025 and 2035
  • Figure 95: South Asia Market Y-o-Y Growth Comparison by Product Type, 2025-2035
  • Figure 96: South Asia Market Attractiveness Analysis by Product Type
  • Figure 97: South Asia Market Value Share and BPS Analysis by Product Offering, 2025 and 2035
  • Figure 98: South Asia Market Y-o-Y Growth Comparison by Product Offering, 2025-2035
  • Figure 99: South Asia Market Attractiveness Analysis by Product Offering
  • Figure 100: South Asia Market Value Share and BPS Analysis by Weight, 2025 and 2035
  • Figure 101: South Asia Market Y-o-Y Growth Comparison by Weight, 2025-2035
  • Figure 102: South Asia Market Attractiveness Analysis by Weight
  • Figure 103: South Asia Market Value Share and BPS Analysis by Application, 2025 and 2035
  • Figure 104: South Asia Market Y-o-Y Growth Comparison by Application, 2025-2035
  • Figure 105: South Asia Market Attractiveness Analysis by Application
  • Figure 106: South Asia Market Value Share and BPS Analysis by End-Use, 2025 and 2035
  • Figure 107: South Asia Market Y-o-Y Growth Comparison by End-Use, 2025-2035
  • Figure 108: South Asia Market Attractiveness Analysis by End-Use
  • Figure 109: Oceania Market Value Share and BPS Analysis by Country, 2025 and 2035
  • Figure 110: Oceania Market Value Share and BPS Analysis by Product Type, 2025 and 2035
  • Figure 111: Oceania Market Y-o-Y Growth Comparison by Product Type, 2025-2035
  • Figure 112: Oceania Market Attractiveness Analysis by Product Type
  • Figure 113: Oceania Market Value Share and BPS Analysis by Product Offering, 2025 and 2035
  • Figure 114: Oceania Market Y-o-Y Growth Comparison by Product Offering, 2025-2035
  • Figure 115: Oceania Market Attractiveness Analysis by Product Offering
  • Figure 116: Oceania Market Value Share and BPS Analysis by Weight, 2025 and 2035
  • Figure 117: Oceania Market Y-o-Y Growth Comparison by Weight, 2025-2035
  • Figure 118: Oceania Market Attractiveness Analysis by Weight
  • Figure 119: Oceania Market Value Share and BPS Analysis by Application, 2025 and 2035
  • Figure 120: Oceania Market Y-o-Y Growth Comparison by Application, 2025-2035
  • Figure 121: Oceania Market Attractiveness Analysis by Application
  • Figure 122: Oceania Market Value Share and BPS Analysis by End-Use, 2025 and 2035
  • Figure 123: Oceania Market Y-o-Y Growth Comparison by End-Use, 2025-2035
  • Figure 124: Oceania Market Attractiveness Analysis by End-Use
  • Figure 125: MEA Market Value Share and BPS Analysis by Country, 2025 and 2035
  • Figure 126: MEA Market Value Share and BPS Analysis by Product Type, 2025 and 2035
  • Figure 127: MEA Market Y-o-Y Growth Comparison by Product Type, 2025-2035
  • Figure 128: MEA Market Attractiveness Analysis by Product Type
  • Figure 129: MEA Market Value Share and BPS Analysis by Product Offering, 2025 and 2035
  • Figure 130: MEA Market Y-o-Y Growth Comparison by Product Offering, 2025-2035
  • Figure 131: MEA Market Attractiveness Analysis by Product Offering
  • Figure 132: MEA Market Value Share and BPS Analysis by Weight, 2025 and 2035
  • Figure 133: MEA Market Y-o-Y Growth Comparison by Weight, 2025-2035
  • Figure 134: MEA Market Attractiveness Analysis by Weight
  • Figure 135: MEA Market Value Share and BPS Analysis by Application, 2025 and 2035
  • Figure 136: MEA Market Y-o-Y Growth Comparison by Application, 2025-2035
  • Figure 137: MEA Market Attractiveness Analysis by Application
  • Figure 138: MEA Market Value Share and BPS Analysis by End-Use, 2025 and 2035
  • Figure 139: MEA Market Y-o-Y Growth Comparison by End-Use, 2025-2035
  • Figure 140: MEA Market Attractiveness Analysis by End-Use
  • Figure 141: Global Market- Tier Structure Analysis
  • Figure 142: Global Market- Company Share Analysis

Frequently Asked Questions

How big is the greaseproof paper sheets market?

The market was valued at USD 1.3 billion in 2025.

What is the outlook on greaseproof paper sheet sales?

The market is predicted to reach a size of USD 2.3 billion by 2035.

Who are the major greaseproof paper sheet manufacturers?

Some of the key companies manufacturing greaseproof paper include Nordic Paper AS, Georgia-Pacific Corp., Ahlstrom Munksjo Oyj, and McNarin Packaging, and others.

Which region is likely to create lucrative opportunities for greaseproof paper sheet manufacturers?

China is likely to be a prominent hub for greaseproof paper manufacturers.

Explore Similar Insights

Future Market Insights

Greaseproof Paper Sheets Market