The global pyramid tea bags market is projected to grow from USD 3.2 billion in 2025 to approximately USD 8.9 billion by 2035, recording an absolute increase of USD 5.7 billion over the forecast period. This translates into a total growth of 178.1%, with the market forecast to expand at a CAGR of 10.8% between 2025 and 2035. The market size is expected to grow by approximately 2.8X during the same period, supported by increasing consumer preference for premium tea experiences, growing adoption of transparent brewing formats, and rising demand for whole-leaf tea infusion solutions across global retail and hospitality sectors.
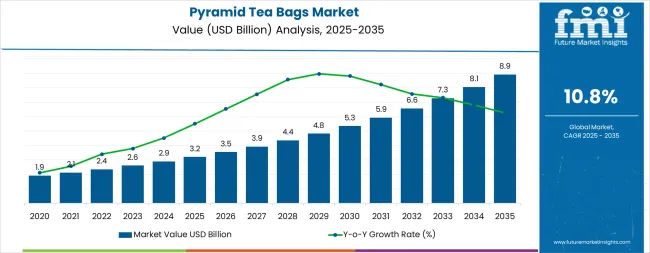
Between 2025 and 2030, the pyramid tea bags market is projected to grow from USD 3.2 billion to USD 5.3 billion, a rise of USD 2.1 billion, representing 36.8% of the total forecast growth. This growth will be driven by rising demand for premium tea formats, a preference for visible leaf infusion, and increased availability of specialty pyramid tea bags in retail and hospitality sectors. From 2030 to 2035, the market is expected to expand further, from USD 5.3 billion to USD 8.9 billion, adding USD 3.6 billion, constituting 63.2% of the decade's growth. This period will see advancements in biodegradable mesh materials, innovative flavor profiles, and luxury tea experiences. The growing focus on tea quality and premium brewing will fuel demand for certified organic varieties with superior infusion and flavor release characteristics. Between 2020 and 2024, the market grew as consumers increasingly recognized the benefits of pyramid formats in enhancing flavor extraction and brewing transparency.
| Metric | Value |
|---|---|
| Estimated Value in (2025E) | USD 3.2 billion |
| Forecast Value in (2035F) | USD 8.9 billion |
| Forecast CAGR (2025 to 2035) | 10.8% |
The tea packaging market is the largest contributor, accounting for around 35-40%. Pyramid tea bags are increasingly popular due to their ability to provide a premium and visually appealing tea experience. Unlike traditional flat bags, the three-dimensional shape of pyramid bags allows tea leaves to expand fully, enhancing flavor extraction and delivering a better brewing experience. As consumers demand more convenient yet high-quality packaging, pyramid tea bags are becoming a favored choice, particularly for specialty and premium tea brands. The tea market, contributing approximately 25-30%, also plays a significant role. With the growing popularity of loose-leaf teas and premium blends, consumers are looking for effective and convenient packaging solutions, and pyramid tea bags meet this demand by providing a simple method for brewing high-quality tea.
The consumer packaged goods (CPG) market, holding around 15-20%, is another important driver. As consumer preferences shift towards premium, convenient, and innovative products, pyramid tea bags are increasingly adopted by brands to differentiate themselves in the competitive tea market. The e-commerce market, which contributes about 10-12%, has fueled the growth of pyramid tea bags as online platforms offer a wide variety of specialty teas, often packaged in pyramid bags for their enhanced brewing qualities. Lastly, the packaging market, contributing around 5-8%, plays a role as consumers seek packaging that offers both convenience and superior product preservation.
Market expansion is being supported by the increasing global demand for premium tea experiences and the corresponding shift toward transparent brewing formats that can provide superior taste outcomes while meeting consumer requirements for quality assurance and convenient preparation processes. Modern tea enthusiasts are increasingly focused on incorporating premium solutions that can enhance flavor complexity while satisfying demands for visually appealing, consistently performing infusion methods and optimized brewing practices. Pyramid tea bags' proven ability to deliver taste benefits, leaf visibility, and diverse flavor possibilities makes them essential products for quality-conscious consumers and premium-focused establishments.
The growing emphasis on tea culture appreciation and sensory experiences is driving demand for high-quality pyramid tea bags that can support distinctive flavor outcomes and comprehensive quality positioning across herbal infusions, artisan blends, and specialty tea categories. Consumer preference for products that combine brewing excellence with presentation characteristics is creating opportunities for innovative implementations in both traditional and emerging tea consumption applications. The rising influence of wellness trends and premium beverage initiatives is also contributing to increased adoption of pyramid tea bags that can provide authentic taste benefits and quality characteristics.
The market is segmented by product type, tea type, material type, distribution channel, and region. By product type, the market is divided into premium pyramid bags, standard pyramid bags, luxury pyramid bags, organic pyramid bags, flavored pyramid bags, and other pyramid formats. Based on tea type, the market is categorized into black tea, green tea, herbal tea, white tea, oolong tea, and specialty blends. By material type, the market includes nylon mesh, silk mesh, corn-based PLA, and biodegradable materials. By distribution channel, the market comprises supermarkets & hypermarkets, specialty tea stores, online retail, hospitality & foodservice, and other channels. Regionally, the market is divided into North America, Europe, Asia Pacific, Latin America, Middle East & Africa, and other regions.
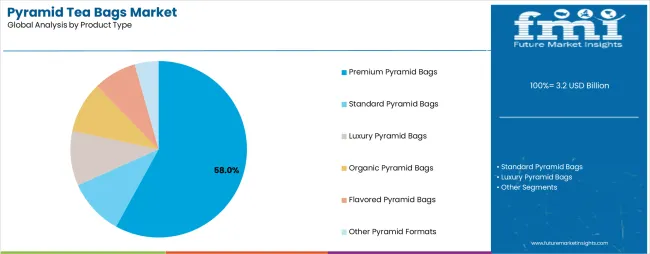
The premium pyramid bags segment is projected to account for 58% of the pyramid tea bags market in 2025, reaffirming its position as the leading product category. Consumers and hospitality establishments increasingly utilize premium pyramid bags for their superior infusion characteristics, established leaf visibility, and essential functionality in quality tea preparation applications across diverse consumption categories. Premium pyramid bags' standardized quality characteristics and proven brewing effectiveness directly address consumer requirements for reliable flavor delivery and optimal value in tea experiences.
This product segment forms the foundation of modern premium tea consumption patterns, as it represents the format with the greatest consumer acceptance potential and established compatibility across multiple tea varieties. Consumer investments in tea quality optimization and flavor appreciation continue to strengthen adoption among discerning enthusiasts. With users prioritizing taste authenticity and brewing transparency, premium pyramid bags align with both quality objectives and convenience requirements, making them the central component of comprehensive tea consumption strategies.
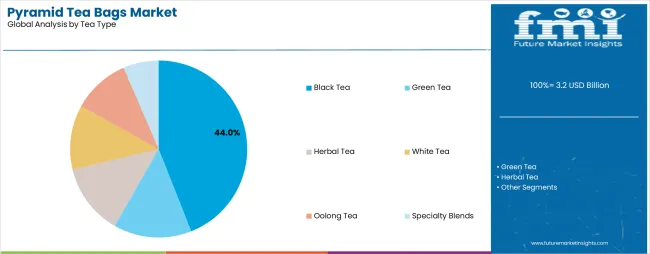
Specialty tea is projected to represent 44% of the pyramid tea bags market growth through 2035, underscoring its critical role as the primary choice for quality-focused consumers seeking superior flavor benefits and enhanced taste credentials. Premium consumers and tea connoisseurs prefer specialty tea for their enhanced complexity standards, proven flavor superiority, and ability to maintain exceptional taste profiles while supporting sophisticated brewing experiences. Positioned as essential products for discerning tea enthusiasts, specialty offerings provide both flavor excellence and authenticity advantages.
The segment is supported by continuous improvement in tea sourcing technology and the widespread availability of established cultivation infrastructure that enables quality assurance and premium positioning at the consumer level. Tea manufacturers are optimizing blending methods to support market differentiation and accessible premium pricing. As flavor technology continues to advance and consumers seek superior tea solutions, specialty varieties will continue to drive market growth while supporting taste exploration and premium consumption strategies.
The pyramid tea bags market is advancing rapidly due to increasing tea quality consciousness and growing need for premium brewing choices that emphasize superior taste outcomes across consumer segments and hospitality applications. The market faces challenges, including higher production costs, material sourcing considerations for biodegradable options, and supply chain complexities affecting pricing stability. Innovation in mesh materials and specialized product development continues to influence market development and expansion patterns.
The growing adoption of pyramid tea bags in specialty retail programs and quality-focused applications is enabling consumers to develop brewing patterns that provide distinctive flavor benefits while commanding premium positioning and enhanced taste characteristics. Premium applications provide superior leaf infusion while allowing more sophisticated flavor appreciation across various tea categories. Consumers are increasingly recognizing the competitive advantages of pyramid format positioning for premium tea experiences and quality-conscious consumption integration.
Modern pyramid tea bag manufacturers are incorporating advanced mesh engineering systems, flavor preservation technologies, and quality management protocols to enhance infusion capabilities, improve consumer outcomes, and meet sophisticated demands for tea-specific brewing solutions. These systems improve bag effectiveness while enabling new applications, including artisan blending and specialized flavor programs. Advanced material integration also allows manufacturers to support premium market positioning and taste leadership beyond traditional tea bag operations.
| Country | CAGR (2025-2035) |
|---|---|
| USA | 10.5% |
| Germany | 10.2% |
| UK | 11.3% |
| China | 9.8% |
| Japan | 10.9% |
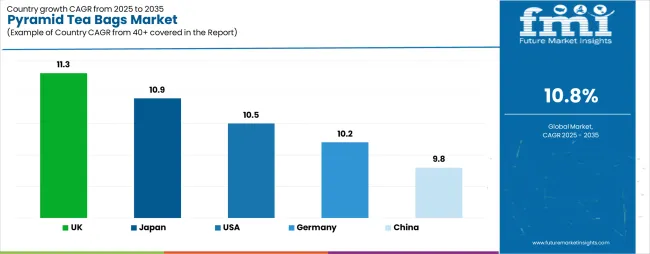
The pyramid tea bags market is experiencing robust growth globally, with the UK leading at an 11.3% CAGR through 2035, driven by the strong tea culture tradition, growing premium tea appreciation, and increasing adoption of quality brewing products. Japan follows at 10.9%, supported by rising interest in Western tea formats, expanding specialty tea consumption, and growing acceptance of convenient premium solutions. The USA shows growth at 10.5%, emphasizing established specialty retail markets and comprehensive hospitality development. Germany records 10.2%, focusing on premium beverage products and quality tea expansion. China demonstrates 9.8% growth, prioritizing modern tea innovations and traditional quality advancement.
The report covers an in-depth analysis of 40+ countries, with top-performing countries highlighted below.
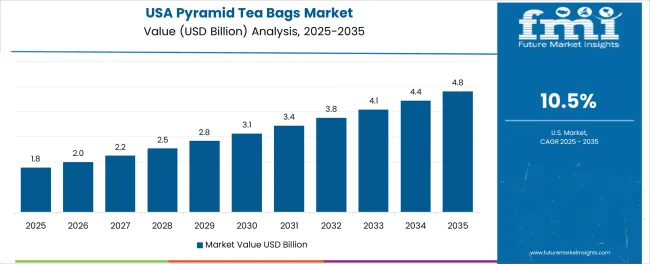
Revenue from pyramid tea bags consumption and sales in the USA is projected to exhibit exceptional growth with a CAGR of 10.5% through 2035, driven by the country's rapidly expanding specialty tea sector, favorable consumer attitudes toward premium beverages, and initiatives promoting quality tea experiences across major metropolitan regions. The USA's position as a leading specialty beverage market and increasing focus on tea culture development are creating substantial demand for high-quality pyramid tea bags in both retail and hospitality markets. Major tea suppliers and specialty beverage providers are establishing comprehensive distribution capabilities to serve growing consumer demand and emerging premium opportunities.
Demand for pyramid tea bags in Germany is expanding at a CAGR of 10.2%, supported by rising beverage sophistication, growing consumer appreciation for quality, and expanding tea consumption infrastructure. The country's developing wellness capabilities and increasing consumer investment in premium beverages are driving demand for pyramid tea bags across both imported and domestically blended applications. International tea companies and domestic retailers are establishing comprehensive distribution networks to address growing market demand for quality pyramid tea bags and specialty brewing solutions.
Revenue from pyramid tea bags products in the UK is projected to grow at a CAGR of 11.3% through 2035, supported by the country's historic tea culture, established quality traditions, and leadership in premium tea standards. Britain's sophisticated tea infrastructure and strong support for innovation are creating steady demand for both traditional and innovative pyramid tea bag varieties. Leading tea suppliers and specialty beverage providers are establishing comprehensive operational strategies to serve both domestic markets and growing export opportunities.
Demand for pyramid tea bags products in China is anticipated to expand at a CAGR of 9.8% through 2035, driven by the country's emphasis on tea modernization, cultural heritage leadership, and sophisticated consumption capabilities for beverages requiring innovative brewing varieties. Chinese consumers and retailers consistently seek premium-grade products that enhance tea experiences and support modern lifestyles for both traditional and innovative consumption applications. The country's position as an Asian tea leader continues to drive innovation in specialty pyramid tea applications and premium product standards.
Revenue from pyramid tea bags products in Japan is expected to grow at a CAGR of 10.9% through 2035, supported by the country's emphasis on beverage quality, tea ceremony standards, and advanced brewing technology integration requiring efficient infusion solutions. Japanese consumers and tea enthusiasts prioritize quality performance and precise preparation, making pyramid tea bags essential components for both traditional and modern tea applications. The country's comprehensive beverage excellence and advancing consumption patterns support continued market expansion.
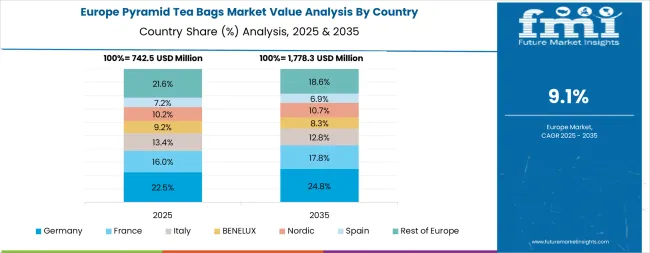
The Europe pyramid tea bags market is projected to grow from USD 1.1 billion in 2025 to USD 2.9 billion by 2035, recording a CAGR of 10.2% over the forecast period. The United Kingdom leads the region with a 35.0% share in 2025, maintaining 34.5% by 2035, supported by its strong tea heritage and demand for premium, quality-focused pyramid tea formats. Germany follows with 26.0% in 2025, rising to 26.5% by 2035, driven by sophisticated wellness markets and emphasis on quality beverage standards. France accounts for 16.5% in 2025, growing to 17.0% by 2035, reflecting steady adoption of premium tea solutions and beverage culture consciousness. Italy holds 9.0% in 2025, expanding to 9.5% by 2035 as specialty beverage consumption and quality tea applications grow. Spain contributes 6.5% in 2025, growing to 7.0% by 2035, supported by expanding hospitality and premium beverage appreciation. The Nordic countries rise from 5.0% in 2025 to 5.5% by 2035 on the back of strong wellness adoption and advanced retail integration. BENELUX remains a stable 2.0% share across both 2025 and 2035, reflecting mature, quality-focused markets.
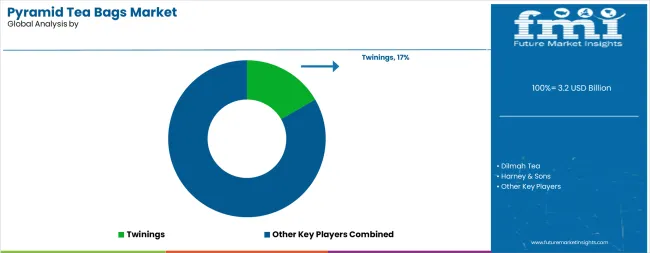
The pyramid tea bags market is characterized by competition among established tea companies, specialized premium tea manufacturers, and integrated beverage solution providers. Companies are investing in sourcing technologies, advanced blending systems, product innovation capabilities, and comprehensive distribution networks to deliver consistent, high-quality, and flavorful pyramid tea bags. Innovation in flavor enhancement, biodegradable production methods, and blend-specific product development is central to strengthening market position and customer satisfaction.
Dilmah Tea leads the market with a strong focus on quality innovation and comprehensive premium tea solutions, offering superior pyramid tea bags with emphasis on authenticity excellence and tea heritage. Twinings provides specialized blending capabilities with a focus on global market applications and diverse flavor networks. Harney & Sons delivers integrated premium solutions with a focus on quality positioning and operational efficiency. Mighty Leaf Tea specializes in comprehensive artisan offerings with an emphasis on specialty applications. The Republic of Tea focuses on comprehensive wellness solutions with advanced blending and premium positioning capabilities.
The success of pyramid tea bags in meeting consumer quality demands, flavor-driven taste requirements, and brewing excellence integration will not only enhance beverage outcomes but also strengthen global tea industry capabilities. It will consolidate emerging regions' positions as hubs for efficient tea production and align advanced economies with premium beverage consumption systems. This calls for a concerted effort by all stakeholders -- governments, industry bodies, suppliers, distributors, and investors. Each can be a crucial enabler in preparing the market for its next phase of growth.
| Items | Values |
|---|---|
| Quantitative Units (2025) | USD 3.2 billion |
| Product Type | Premium Pyramid Bags, Standard Pyramid Bags, Luxury Pyramid Bags, Organic Pyramid Bags, Flavored Pyramid Bags, Other Pyramid Formats |
| Tea Type | Black Tea, Green Tea, Herbal Tea, White Tea, Oolong Tea, Specialty Blends |
| Material Type | Nylon Mesh, Silk Mesh, Corn-based PLA, Biodegradable Materials |
| Distribution Channel | Supermarkets & Hypermarkets, Specialty Tea Stores, Online Retail, Hospitality & Foodservice, Other Channels |
| Regions Covered | North America, Europe, Asia Pacific, Latin America, Middle East & Africa, Other Regions |
| Countries Covered | United States, Germany, United Kingdom, China, Japan, and 40+ countries |
| Key Companies Profiled | Dilmah Tea, Twinings, Harney & Sons, Mighty Leaf Tea, The Republic of Tea, and other leading pyramid tea bag companies |
| Additional Attributes | Dollar sales by product type, tea type, material type, distribution channel, and region; regional demand trends, competitive landscape, technological advancements in mesh engineering, flavor preservation integration initiatives, quality enhancement programs, and premium product development strategies |
The global pyramid tea bags market is estimated to be valued at USD 3.2 billion in 2025.
The market size for the pyramid tea bags market is projected to reach USD 8.9 billion by 2035.
The pyramid tea bags market is expected to grow at a 10.8% CAGR between 2025 and 2035.
The key product types in pyramid tea bags market are premium pyramid bags, standard pyramid bags, luxury pyramid bags, organic pyramid bags, flavored pyramid bags and other pyramid formats.
In terms of tea type, black tea segment to command 44.0% share in the pyramid tea bags market in 2025.


Our Research Products

The "Full Research Suite" delivers actionable market intel, deep dives on markets or technologies, so clients act faster, cut risk, and unlock growth.

The Leaderboard benchmarks and ranks top vendors, classifying them as Established Leaders, Leading Challengers, or Disruptors & Challengers.

Locates where complements amplify value and substitutes erode it, forecasting net impact by horizon

We deliver granular, decision-grade intel: market sizing, 5-year forecasts, pricing, adoption, usage, revenue, and operational KPIs—plus competitor tracking, regulation, and value chains—across 60 countries broadly.

Spot the shifts before they hit your P&L. We track inflection points, adoption curves, pricing moves, and ecosystem plays to show where demand is heading, why it is changing, and what to do next across high-growth markets and disruptive tech

Real-time reads of user behavior. We track shifting priorities, perceptions of today’s and next-gen services, and provider experience, then pace how fast tech moves from trial to adoption, blending buyer, consumer, and channel inputs with social signals (#WhySwitch, #UX).

Partner with our analyst team to build a custom report designed around your business priorities. From analysing market trends to assessing competitors or crafting bespoke datasets, we tailor insights to your needs.
Supplier Intelligence
Discovery & Profiling
Capacity & Footprint
Performance & Risk
Compliance & Governance
Commercial Readiness
Who Supplies Whom
Scorecards & Shortlists
Playbooks & Docs
Category Intelligence
Definition & Scope
Demand & Use Cases
Cost Drivers
Market Structure
Supply Chain Map
Trade & Policy
Operating Norms
Deliverables
Buyer Intelligence
Account Basics
Spend & Scope
Procurement Model
Vendor Requirements
Terms & Policies
Entry Strategy
Pain Points & Triggers
Outputs
Pricing Analysis
Benchmarks
Trends
Should-Cost
Indexation
Landed Cost
Commercial Terms
Deliverables
Brand Analysis
Positioning & Value Prop
Share & Presence
Customer Evidence
Go-to-Market
Digital & Reputation
Compliance & Trust
KPIs & Gaps
Outputs
Full Research Suite comprises of:
Market outlook & trends analysis
Interviews & case studies
Strategic recommendations
Vendor profiles & capabilities analysis
5-year forecasts
8 regions and 60+ country-level data splits
Market segment data splits
12 months of continuous data updates
DELIVERED AS:
PDF EXCEL ONLINE
Analyzing Pyramid Tea Bags Market Share & Industry Leaders
Tea and Coffee Bags Market Size and Share Forecast Outlook 2025 to 2035
Steam Sterilizer Bags Market Size and Share Forecast Outlook 2025 to 2035
Tea Packaging Machine Market Size and Share Forecast Outlook 2025 to 2035
Tear Tape Dispenser Market Size and Share Forecast Outlook 2025 to 2035
Tea Tree Oil Treatments Market Size and Share Forecast Outlook 2025 to 2035
Tea Processing Machine Market Size and Share Forecast Outlook 2025 to 2035
Tear-tab Lids Market Size and Share Forecast Outlook 2025 to 2035
Tea Processing Equipment Market Size and Share Forecast Outlook 2025 to 2035
Tea Infuser Market Analysis & Forecast by Material Type, Product Type, Distribution Store, and Region Through 2025 to 2035
Tea Packaging Market Size, Demand & Forecast 2025 to 2035
Teaseed Cake Market – Trends & Forecast 2025 to 2035
Tea-Based Skin Care Products Market Analysis by Product Type, Tea Type, Skin Type, Sales Channel and Region from 2025 to 2035
Competitive Breakdown of Tea Packaging Providers
Teabag Envelope Market Analysis based on Material Type, End Use, and Region through 2025 to 2035
Teak Decking Market Growth Analysis by Grade, Application and Region: Forecast for 2025 and 2035
Market Share Distribution Among Tea Packaging Machine Manufacturers
Market Share Breakdown of Leading Tear-Tab Lids Manufacturers
Competitive Breakdown of Tear Tape Providers
Market Share Breakdown of Leading Tea Polyphenols Suppliers

Thank you!
You will receive an email from our Business Development Manager. Please be sure to check your SPAM/JUNK folder too.
Chat With
MaRIA