
- Market Size (2026)
- USD 10.1 Bn
- Forecast (2036)
- USD 18.4 Bn
- CAGR (2026 to 2036)
- 6.2%
How big is Shotcrete (Sprayed Concrete) Market in 2026?
Shotcrete market size stood at USD 9.50 billion in 2025, reaches USD 10.1 billion in 2026 and is projected at USD 18.4 billion by 2036. Demand for shotcrete is set to expand at a 6.2% CAGR from 2026 to 2036, as tunnel, mining and slope-stabilization crews switch from cast concrete and hand-applied methods to sprayed application.
Sales of wet mix shotcrete are climbing faster than dry mix, as crews on long tunnel drives want fewer rebound losses and steadier output. FMI puts wet mix shotcrete ahead with a 55.3% share of process sales in 2026. India completed more than 100 km of over 60 tunnels across 26 projects between June 2024 and May 2025, Indian Infrastructure reported in July 2025. The Silkyara-Barkot tunnel on the Dharasu-Yamunotri highway in Uttarakhand broke through in April 2025, built using the New Austrian Tunnelling Method at a cost of Rs 8.5 billion.
Contractors on similar drives are turning to wet mix batching plants that can keep pace with continuous excavation. On 3 September 2025, Putzmeister Underground presented the Wetkret 2 Narrow Vein robotic sprayer, built for reduced mine sections down to 2.5 by 2.5 metres . Robotic spraying systems hold 61.4% of system sales in 2026, as mine operators move spray crews away from the face. Sika opened a new concrete admixtures production plant and technical centre in Ham, Belgium in June 2026, expanding supply capacity for contractors across the Benelux region and beyond . Wider use of robotic wet mix equipment on tunnel and mine faces is anticipated to keep raising the wet mix share of the shotcrete market through 2036.
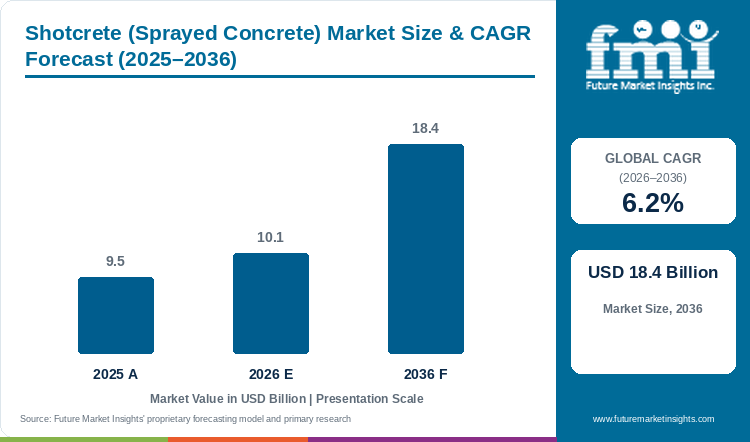
Key Market Trends & Insights
- By process, wet mix shotcrete leads with 55.3% of 2026 sales, as crews on long tunnel and mine drives favor pre-mixed batching for steady output.
- By application, underground construction accounts for 38.7% of 2026 sales. Indian Infrastructure reported more than 100 km of tunnels completed across 26 projects between June 2024 and May 2025.
- By system, robotic spraying systems hold 61.4% in 2026, owing to operators moving spray crews away from unstable rock faces at mine and tunnel sites.
- By end use, the construction sector accounts for about 65% of 2026 sales, and continued tunnel, bridge and slope-stabilization work will keep construction crews as the main buyers through 2036. Putzmeister Underground presented a robotic Wetkret 2 Narrow Vein sprayer for reduced mine sections on 4 September 2025.
- By region, Europe leads with about 34% of 2026 sales, reflecting an aging network of tunnels and transit infrastructure that requires ongoing repair work, and Asia Pacific is growing fastest, led by tunnel programs in China and India.
Regional Highlights
- The fastest profiled-country growth comes from China, at 8.4% CAGR to 2036.
- India and Germany follow at 7.8% and 7.1% respectively, and USA records the slowest profiled pace at 5.9% through 2036.
- Chinese contractors opened the 22.13 km Tianshan Shengli expressway tunnel in Xinjiang in December 2025, after five years of construction.
Market Size & Forecast
Table 1: Market Size and Forecast for the Shotcrete (Sprayed Concrete) Market (USD billion and percentage), 2025 to 2036
| Metric | Value |
|---|---|
| 2025 Market Size | USD 9.50 billion |
| Estimated Market Size in 2026 | USD 10.1 billion |
| Projected Market Size by 2036 | USD 18.4 billion |
| CAGR, 2026 to 2036 | 6.2% |
| Incremental Opportunity, 2026 to 2036 | USD 8.32 billion |
| Market Expansion Multiple | 1.8x |
Most shotcrete orders now come from contractors upgrading tunnel, mine and slope-stabilization crews to spray application. Faster set times and lower rebound loss are the main reasons a crew switches from cast concrete. India completed more than 100 km of tunnels across 26 projects between June 2024 and May 2025, Indian Infrastructure reported in July 2025. China opened the 22.13 km Tianshan Shengli tunnel in Xinjiang in December 2025, the longest expressway tunnel in the world. Long, continuous drives such as these keep demand for wet mix batching steady across a shift. Price-sensitive buyers in smaller markets can still choose cast concrete or dry mix over wet mix equipment. Replacement of manual spray crews with robotic arms is anticipated to drive most new orders through 2036.
Wet Mix Penetration and Robotic Spraying Readiness
Sales of robotic shotcrete equipment are rising even as crews look to cut exposure at unstable faces. Putzmeister Underground presented the Wetkret 2 Narrow Vein sprayer on 4 September 2025, built with a remote-controlled arm reaching 7.5 metres into sections as small as 2.5 by 2.5 metres. Mine operators running this equipment can keep spray crews back from the face during application. Sika opened a new concrete admixtures plant and technical centre in Ham, Belgium in June 2026, adding laboratories for ready-mix and precast customers. FMI expects robotic wet mix systems to take most new orders in underground and mine work through the early forecast years, as operators weigh safety against equipment cost.
Tunnel programs are giving contractors a second reason to buy wet mix batching capacity. India completed more than 100 km of tunnels across 60 drives and 26 projects between June 2024 and May 2025, with the Silkyara-Barkot tunnel on the Dharasu-Yamunotri highway breaking through in April 2025 using the New Austrian Tunnelling Method at a cost of Rs 8.5 billion. China opened the 22.13 km Tianshan Shengli expressway tunnel through the Tianshan Mountains in December 2025, following five years of construction. Long continuous drives such as these need batching plants that match the pace of excavation, which favours wet mix over dry mix on large jobs. Robotic spraying systems hold 61.4% of system sales in 2026, and FMI sees robotic wet mix combinations gaining share on tunnel and mine faces through 2036 as more contractors replace manual lances.
Table 2: Tunnel and Mining Equipment Readiness Indicators for the Shotcrete (Sprayed Concrete) Market (mixed units, USD, EUR and kilometres), mixed reporting years from 2025 to 2026
| Indicator | Data Point | Market Relevance | Source |
|---|---|---|---|
| India tunnel completions, June 2024 to May 2025 | More than 100 km across 26 projects | Large tunnel programs sustain demand for wet mix batching plants. | |
| Silkyara tunnel breakthrough, April 2025 | Silkyara-Barkot tunnel, Dharasu-Yamunotri highway; NATM; cost Rs 8.5 billion | Long NATM drives favour continuous wet mix supply over dry mix. | |
| Putzmeister Wetkret 2 Narrow Vein launch | Presented 4 September 2025; 7.5 m reach; sections to 2.5 by 2.5 m | Robotic sprayers extend reach into narrow mine sections. | |
| Sika Benelux admixtures plant | Opened June 2026 in Ham, Belgium | New plant capacity shortens delivery distances for European contractors. | |
| Tianshan Shengli expressway tunnel | Opened December 2025; 22.13 km; five years of construction | Record-length mountain tunnels keep batching capacity under sustained demand. | — |
| Vale Carajas expansion | USD 12 billion plan announced February 2025 | Expanding underground mine sections raise demand for ground-support spraying. | — |
| Process share, 2026 | Wet mix 55.3% | Wet mix leads on long, continuous drives. | Future Market Insights |
| Application share, 2026 | Underground construction 38.7% | Underground work remains the leading application. | Future Market Insights |
| System share, 2026 | Robotic spraying systems 61.4% | Robotic systems move spray crews away from unstable faces. | Future Market Insights |
| Sika AG market share, 2026 | Not independently verified | Sika AG is among the largest materials suppliers by published range and plant coverage. | Future Market Insights |
Table 3: Tunnel Completion and Equipment Launch Benchmarks for the Shotcrete (Sprayed Concrete) Market (mixed units and currencies), mixed reporting years from 2025 to 2026
| Indicator | Reported value | Related figure | Source |
|---|---|---|---|
| Shotcrete market, 2025 to 2026 | USD 9.50 billion to USD 10.1 billion | 6.2% CAGR, 2026 to 2036 | Future Market Insights |
| India tunnels completed, June 2024 to May 2025 | More than 100 km | Across 26 projects and over 60 drives | |
| Silkyara tunnel cost | Rs 8.5 billion | Silkyara-Barkot tunnel, Dharasu-Yamunotri highway | |
| Putzmeister Wetkret 2 Narrow Vein reach | 7.5 metres | Sections as small as 2.5 by 2.5 metres | |
| Sika Benelux plant opening | June 2026 | Ham, Belgium | |
| Tianshan Shengli tunnel length | 22.13 km | Opened December 2025 | — |
| Vale Carajas investment | USD 12 billion | Announced February 2025 | — |
| Sika AG company share, 2026 | Not independently verified | Sika AG is among the largest materials suppliers by published range and plant coverage. | Future Market Insights |
Analyst Perspective
“Contractors will favour shotcrete systems that switch between wet mix and dry mix batching within one shift and pair with robotic arms at unstable faces. Suppliers offering fast-set admixtures and local technical support close to tunnel and mine sites will take most replacement orders through 2036.”
- Nikhil Kaitwade, Principal Consultant, Future Market Insights.
How is the Shotcrete (Sprayed Concrete) Market segmented?
The shotcrete market is studied across five commercial segments plus region, namely process, application, system, end use and geography. In 2026, wet mix shotcrete holds 55.3%, underground construction 38.7%, robotic spraying systems 61.4%, the construction sector about 65% and Europe about 34% of respective segment sales.
By process: wet mix shotcrete, dry mix shotcrete, and hybrid mix systems; fiber-reinforced and accelerated-set formulations are available as additive options within each process type.
By application: underground construction (including tunnel lining and mine development), slope stabilization, and repair and rehabilitation.
By system: robotic spraying systems, manual spraying systems, remote-operated nozzle systems, and trailer-mounted spraying systems.
By end use: construction, mining, infrastructure and public works, and repair and restoration.
By region: North America, Latin America, Western Europe, Eastern Europe, East Asia, South Asia and Pacific, and Middle East and Africa.
Why does wet mix shotcrete lead the process segment?
Wet mix shotcrete will hold 55.3% of process sales in 2026, as crews on long tunnel and mine drives need steady, pre-batched output.
Table 4: Process Share for the Shotcrete (Sprayed Concrete) Market (percentage share), 2026
| Process | Share (2026) |
|---|---|
| Wet Mix Shotcrete | 55.3% |
| Other Segments Combined | 44.7% |
| Total | 100% |
Table 5: Process Leadership and Market Growth for the Shotcrete (Sprayed Concrete) Market (segment and CAGR percentage), 2026 to 2036
| Metric | Value |
|---|---|
| Global CAGR (2026 to 2036) | 6.2% |
| Leading Segment | Wet Mix Shotcrete |
Demand for wet mix shotcrete comes first on long, continuous tunnel and mine drives, as crews need steady output without stopping to remix batches. FMI finds that wet mix shotcrete accounts for 55.3% of process sales in 2026. Dry mix shotcrete still suits short-run repair jobs with tight site access, and hybrid mix systems serve a smaller group of specialist contractors. India completed more than 100 km of tunnels across 26 projects between June 2024 and May 2025. Continuous tunnel drives of this length are anticipated to keep wet mix shotcrete ahead through 2036.
- Wet mix shotcrete holds 55.3% of process sales in 2026, since long tunnel and mine drives need steady, pre-batched output.
- Crews comparing batching methods should check rebound loss, set time and pump distance, as these factors set the cost of each cubic metre sprayed.
Why does underground construction dominate application sales?
Underground construction accounts for 38.7% of application sales in 2026, as tunnel and mine drives need an initial support layer at every face.
Sales of shotcrete for underground construction follow tunnel and mine activity, as every metre of excavated rock needs an initial support layer. As per FMI estimates, underground construction holds 38.7% of application sales in 2026. Tunnel lining and repair and rehabilitation work follow a slower pace, and mining and slope stabilization serve a narrower set of sites. China opened the 22.13 km Tianshan Shengli tunnel in Xinjiang in December 2025. Wider programs of this scale are expected to keep underground construction as the leading application through 2036.
- Underground construction holds 38.7% of application sales in 2026, as tunnel and mine drives need an initial support layer at every face.
- A stalled excavation face halts the whole drive, so pump reach and set time weigh heavily in contractor selection.
Why do robotic spraying systems lead the system segment?
Robotic spraying systems make up 61.4% of system sales in 2026, owing to operators moving spray crews away from unstable faces.
Demand for robotic spraying systems is rising, as mine and tunnel operators want spray crews back from unstable faces. FMI data shows robotic spraying systems making up 61.4% of system sales in 2026. Manual spraying systems remain the choice for small repair jobs, and remote-operated nozzle systems serve a narrower set of hazardous sites. On 4 September 2025, Putzmeister Underground presented the Wetkret 2 Narrow Vein sprayer, with a remote-controlled arm reaching 7.5 metres into sections as small as 2.5 by 2.5 metres. Machines that reach deeper into narrow sections are expected to gain orders from mine operators running reduced-vein development.
- Robotic spraying systems make up 61.4% of system sales in 2026, and narrow-vein mine development will keep this system ahead through 2036.
- Operators adding robotic arms should test reach, flow rate and power source before signing an order.
Why does construction account for most end use demand?
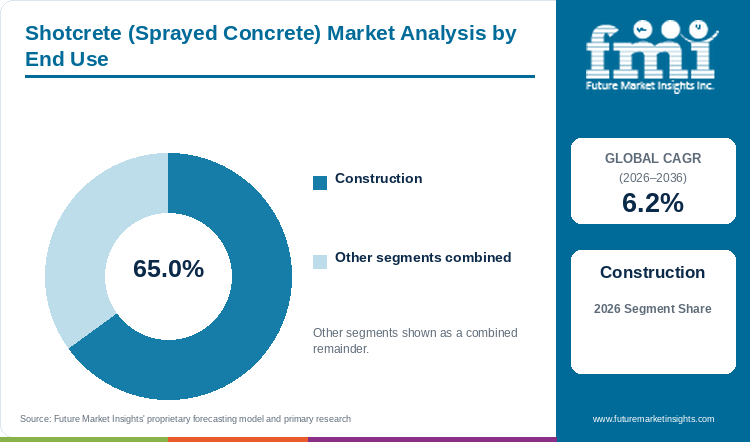
Construction captures about 65% of end use sales in 2026, owing to long tunnel, bridge and slope-stabilization programs.
Construction crews buy most shotcrete, as tunnel, bridge and slope-stabilization jobs spread the cost of mobilising a spray crew. FMI estimates that construction captures about 65% of end use sales in 2026. Mining and infrastructure and public works buy in shorter runs with smaller budgets. India completed tunnels across road, rail, metro and hydropower sectors between June 2024 and May 2025, Indian Infrastructure reported. Large tunnel programs in countries such as India and China will keep construction as the main buyer through 2036.
- Construction captures about 65% of end use sales in 2026, supported by tunnel, bridge and slope-stabilization work.
- Mining and public works buyers often prefer compact equipment, as spray jobs in these sectors are smaller and change more often.
What gives Europe the lead in regional demand?
Europe holds about 34% of sales by region in 2026, as buyers want local batching and admixture supply close to tunnel and transit sites.
Contractors across Europe report the highest regional shotcrete spend, as ageing tunnel and transit networks need ongoing repair and rehabilitation. Europe holds about 34% of sales by region in 2026, as per FMI. Asia Pacific is growing fastest, led by tunnel programs in China and India, and North America follows with highway and transit work. Sika opened a new concrete admixtures plant and technical centre in Ham, Belgium in June 2026, aimed at ready-mix and precast customers. Local batching and admixture capacity is anticipated to keep Europe ahead on near-term orders, even as Asia Pacific closes the gap through 2036.
- Europe holds about 34% of sales by region in 2026, supported by ongoing tunnel and transit repair work.
- Buyers in Asia Pacific should watch local batching capacity, as tunnel programs there are expanding faster than regional supply.
What are the drivers, restraints, and opportunities in the Shotcrete (Sprayed Concrete) Market?
Large tunnel and mine programs push contractors toward robotic wet mix systems, price-sensitive buyers in smaller markets slow approvals, and procurement consolidation among large institutional buyers opens the main opportunity for suppliers offering total cost of ownership.
- Driver: Key drivers of the shotcrete market include tunnel, mining and slope-stabilization work that replaces cast concrete and manual application with sprayed systems.
- Restraint: Price sensitivity among cost-driven buyers and competition from cast concrete slow sales of shotcrete equipment in smaller markets.
- Opportunity: Procurement consolidation among large institutional buyers opens growth for suppliers offering total cost of ownership over a single purchase price.
Tunnel Programs Raise Wet Mix Demand
Large tunnel programs are the main reason contractors keep adding wet mix batching capacity. India completed more than 100 km of tunnels across 26 projects between June 2024 and May 2025. Contractors are moving fixed-position mixers to wet mix plants that match the pace of continuous excavation. Sales of wet mix shotcrete are anticipated to grow fastest in markets running long tunnel drives through 2036.
Price-Sensitive Buyers Delay Upgrades
Cost-driven buyers in smaller markets slow the switch from cast concrete to shotcrete. A wet mix batching plant and robotic spraying arm cost more upfront than hand-applied cast concrete forms. Every new system also needs trained crews and a steady material supply chain, adding time before full output. Price sensitivity among these buyers may slow orders in the early forecast years.
Robotic Systems Open a Safety-Led Opportunity
Mine and tunnel operators are moving spray crews away from unstable faces. On 4 September 2025, Putzmeister Underground presented the Wetkret 2 Narrow Vein sprayer, built with a remote-controlled arm for sections as small as 2.5 by 2.5 metres. Operators choosing robotic systems reduce personnel exposure to hazardous conditions at the face. Builders of robotic spraying arms stand to gain new mine and tunnel orders through 2036.
Which country CAGRs are profiled in the Shotcrete (Sprayed Concrete) Market?
Sales of shotcrete in China grow fastest among the five profiled countries, at an 8.4% CAGR between 2026 and 2036. USA posts the slowest rate, a 5.9% CAGR over the same period. Across all five, contractors buy spraying equipment mainly to support tunnel, mine and infrastructure programs.
Table 6: Country CAGRs and Primary Growth Levers for the Shotcrete (Sprayed Concrete) Market (CAGR percentage), 2026 to 2036
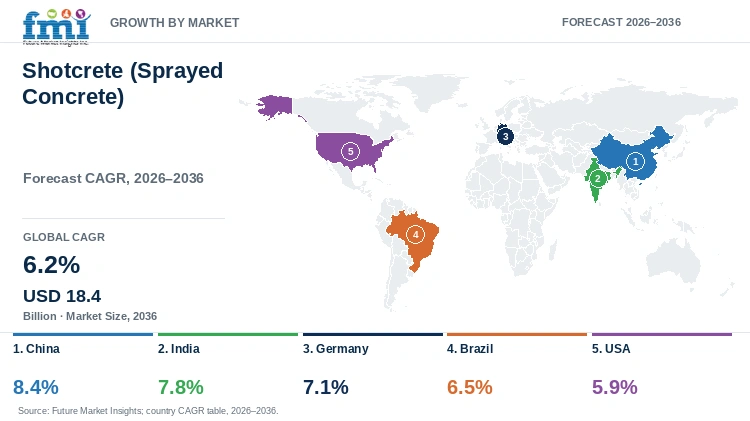
| Country | CAGR (2026–2036) | Primary Growth Lever |
|---|---|---|
| China | 8.4% | Long mountain and expressway tunnel programs |
| India | 7.8% | Multi-sector tunnel programs across road, rail and hydropower |
| Germany | 7.1% | Rail and transit tunnel rehabilitation near new admixture capacity |
| Brazil | 6.5% | Underground mine development for ground support |
| USA | 5.9% | Repair and rehabilitation of existing tunnel networks |
Source: Future Market Insights
China Shotcrete (Sprayed Concrete) Market Outlook (2026–2036)
China opened the 22.13 km Tianshan Shengli tunnel through the Tianshan Mountains in Xinjiang in December 2025, after five years of construction. Due to this, contractors on similar long mountain drives are adding wet mix batching plants that keep pace with continuous excavation. China is set for the fastest rate among the five profiled countries, an 8.4% CAGR for 2026 to 2036. New rail and expressway tunnel programs across the country's western provinces are creating room for robotic spraying equipment at remote sites.
Key takeaway: Long mountain tunnel drives will draw most Chinese orders for wet mix batching capacity.
India Shotcrete (Sprayed Concrete) Market Outlook (2026–2036)
India completed more than 100 km of tunnels across more than 60 drives and 26 projects between June 2024 and May 2025, Indian Infrastructure reported in July 2025. The Silkyara-Barkot tunnel on the Dharasu-Yamunotri highway in Uttarakhand broke through in April 2025, built using the New Austrian Tunnelling Method at a cost of Rs 8.5 billion. Plants need batching capacity that matches round-the-clock excavation on projects of this scale, which favours wet mix over dry mix shotcrete. India is set for the second-fastest rate, a 7.8% CAGR through 2036, spread across road, rail, metro and hydropower tunnel work.1]
Key takeaway: Multi-sector tunnel programs across road, rail and hydropower will draw Indian spending toward wet mix batching plants.
Germany Shotcrete (Sprayed Concrete) Market Outlook (2026–2036)
Germany is projected to add shotcrete sales at a 7.1% CAGR through 2036. Sika opened a new concrete admixtures plant and technical centre in Ham, Belgium in June 2026, within reach of German tunnel and infrastructure contractors. Demand for shorter delivery distances and local technical support is growing as rail and transit tunnel rehabilitation continues across the country. Buyers, however, want admixture suppliers with testing capacity close to the job site.
Key takeaway: Nearby admixture and technical support capacity will set supplier choice for German contractors.
Brazil Shotcrete (Sprayed Concrete) Market Outlook (2026–2036)
Vale announced a USD 12.2 billion plan to expand the Carajas iron ore complex on 14 February 2025, covering further development of underground and open-pit mining capacity; the open-pit expansion is a partial proxy, since ground-support spraying demand is concentrated in the underground sections. Mine operators at expanding underground sections are adding spraying capacity for ground support. Brazil is set for a 6.5% CAGR through 2036, led by mining-sector demand for ground support alongside construction-sector tunnel work.
Key takeaway: Expanding underground mine development at sites such as Carajas will draw Brazilian spending toward ground-support spraying systems.
USA Shotcrete (Sprayed Concrete) Market Outlook (2026–2036)
USA posts the slowest rate among the five profiled countries, a 5.9% CAGR from 2026 to 2036. Mature tunnel and transit networks need ongoing repair and rehabilitation instead of large new drives, which keeps order sizes smaller than in India or China. Contractors are set to favour robotic spraying arms on repair jobs, as these systems cut crew time at each site.
Key takeaway: Repair and rehabilitation work on existing tunnels will set the pace of US orders.
Who are the notable companies in the Shotcrete (Sprayed Concrete) Market?
Sika AG, Heidelberg Materials, Mapei, Saint-Gobain, Conmix Ltd, Wieser Concrete, Normet, Putzmeister Underground, Epiroc, Rockbond SCP, KPM Industries, and Metalco SRL are the leading companies profiled in this market.
Shotcrete material and equipment suppliers come from Switzerland, Germany, Italy, France, Finland and the UAE and differ in product range, plant reach and service network. Sika AG, Heidelberg Materials, Mapei and Saint-Gobain, whose portfolio has included GCP Applied Technologies' specialty admixtures since 2022, concentrate on cement, admixtures and binder systems for sprayed concrete. Conmix Ltd and Wieser Concrete supply further specialty admixtures and ready-to-spray concrete mixes. Normet, Putzmeister Underground and Epiroc lead robotic and mechanised spraying equipment, and Rockbond SCP, KPM Industries and Metalco SRL round out the supplier set with further spraying equipment and precast accessories. Leading suppliers are adding plant capacity and widening technical support networks to gain orders from tunnel and mine contractors.
- Materials and admixture majors: Sika AG, Heidelberg Materials, Mapei, and Saint-Gobain (including its GCP Applied Technologies admixtures business) supply cement, admixtures and binder systems for sprayed concrete.
- Specialty admixture and mix suppliers: Conmix Ltd and Wieser Concrete supply specialty admixtures and ready-to-spray concrete mixes.
- Equipment and precast specialists: Normet, Putzmeister Underground, Epiroc, Rockbond SCP, KPM Industries, and Metalco SRL supply spraying equipment and precast accessories.
Competitive Benchmarking: Shotcrete (Sprayed Concrete) Market
Table 7: Competitive Benchmarking for the Shotcrete (Sprayed Concrete) Market (qualitative capability ratings), 2026
| Company | Materials | Equipment | Service | Reach |
|---|---|---|---|---|
| Sika AG | High | High | High | High |
| Heidelberg Materials | High | Medium | Medium | High |
| Mapei | High | Medium | Medium | Medium |
| Saint-Gobain | High | Medium | Medium | High |
| Normet | Low | High | Medium | Medium |
| Conmix Ltd | Medium | Low | Low | Medium |
| Wieser Concrete | Medium | Low | Low | Low |
| Rockbond SCP | Low | Medium | Low | Low |
| KPM Industries | Low | Medium | Low | Low |
| Metalco SRL | Low | Medium | Low | Low |
Scoring for shotcrete materials or equipment works on three levels: High for broad published coverage, Medium for coverage of part of the range, Low for limited public documentation. Sika AG is rated on the admixture and batching plant range, and Heidelberg Materials on cement and binder supply.
Key Developments in the Shotcrete (Sprayed Concrete) Market
- On 4 September 2025, Putzmeister Underground presented the Wetkret 2 Narrow Vein robotic sprayer for reduced mine sections at an event in Peru.
- In June 2026, Sika opened a new concrete admixtures plant and technical centre in Ham, Belgium, serving ready-mix and precast customers.
- In December 2025, China opened the 22.13 km Tianshan Shengli expressway tunnel in Xinjiang, the longest expressway tunnel in the world.
- In February 2025, Vale announced a USD 12 billion plan to expand the Carajas iron ore complex, covering further underground and open-pit mining development.
Key Players in the Shotcrete (Sprayed Concrete) Market
Materials and Admixture Majors
- Sika AG
- Heidelberg Materials
- Mapei
- Saint-Gobain
Specialty Admixture and Mix Suppliers
- Normet
- Conmix Ltd
- Wieser Concrete
Equipment and Precast Specialists
- Rockbond SCP
- KPM Industries
- Metalco SRL
Shotcrete (Sprayed Concrete) Market - Report Scope
Table 8: Report Scope for the Shotcrete (Sprayed Concrete) Market (coverage fields and definitions), 2026 to 2036
| Coverage field | Report scope |
|---|---|
| Market breakdown | Process; application; system; end use; region |
| Quantitative units | USD billion |
| Market definition | Sales of wet mix, dry mix and hybrid mix shotcrete materials, batching and spraying equipment, and related aftermarket service for underground construction, tunnel lining, mining and slope stabilization, and repair and rehabilitation work. Finished concrete structures and raw cement sold outside a shotcrete application are excluded. |
| Regions covered | Europe; Asia Pacific; North America; Latin America; Middle East and Africa |
| Countries covered | China; India; Germany; Brazil; USA |
| Key companies profiled | Sika AG, Heidelberg Materials, Mapei, Saint-Gobain, Conmix Ltd, Wieser Concrete, Normet, Putzmeister Underground, Epiroc, Rockbond SCP, KPM Industries, Metalco SRL |
| Forecast period | 2026 to 2036 |
| Approach | Bottom-up and top-down inputs were combined to reconcile tunnel and mine project pipelines, equipment installed base, admixture plant capacity and country construction and mining activity, checked against company filings and primary interviews. |
Shotcrete (Sprayed Concrete) Market - Research Methodology
Table 9: Research Methodology for the Shotcrete (Sprayed Concrete) Market (research methods and approach), 2026 edition
| Method | Approach |
|---|---|
| Primary Research | Primary research includes interviews with shotcrete material suppliers, equipment builders, tunnel and mine contractors, and procurement teams. Interviews cover batching method, pump reach, set time and equipment prices. |
| Desk Research | Desk research draws on supplier filings, equipment launch releases, tunnel completion records, mining investment announcements and construction industry statistics. |
| Market Sizing and Forecasting | Sizing starts from the 2025 market value and adds tunnel and mine project pipelines, equipment installed base, average contract value and demand for sprayed concrete in each country. |
| Data Validation | Each estimate is tested against supplier disclosures, tunnel completion data and primary interviews. Finished concrete structures stay outside market value, so no sale is counted twice. |
Shotcrete (Sprayed Concrete) Market by Segments
Shotcrete (Sprayed Concrete) Market segmented by Process:
- Wet mix shotcrete
- Dry mix shotcrete
- Fiber-reinforced shotcrete
- Accelerated-set shotcrete
- Hybrid mix systems
Shotcrete (Sprayed Concrete) Market segmented by Application:
- Underground construction
- Tunnel lining
- Mining and slope stabilization
- Repair and rehabilitation
Shotcrete (Sprayed Concrete) Market segmented by System:
- Robotic spraying systems
- Manual spraying systems
- Remote-operated nozzle systems
- Trailer-mounted spraying systems
Shotcrete (Sprayed Concrete) Market segmented by End Use:
- Construction
- Mining
- Infrastructure and public works
- Repair and restoration
Shotcrete (Sprayed Concrete) Market segmented by Geography:
- Europe
- Asia Pacific
- North America
- Latin America and Middle East and Africa
Shotcrete (Sprayed Concrete) Market by Region
- North America
- United States
- Canada
- Latin America
- Brazil
- Mexico
- Argentina
- Chile
- Western Europe
- Germany
- France
- United Kingdom
- Italy
- Spain
- Benelux
- Nordics
- Eastern Europe
- Poland
- Czech Republic
- Romania
- Hungary
- East Asia
- China
- South Korea
- South Asia and Pacific
- India
- Australia and New Zealand
- Middle East and Africa
- GCC Countries
- South Africa
- Türkiye
- Israel
Research Sources and Bibliography
- [1] Indian Infrastructure. (2025, July 7). Growing Scale: Tunnelling progress across sectors.https://indianinfrastructure.com/2025/07/07/growing-scale-tunnelling-progress-across-sectors/
- [2] Global Mining Review. (2025, September 4). Putzmeister presents Wetkret 2 Narrow Vein, the first dual-operation mechanised concrete spraying equipment for narrow vein mines.https://www.globalminingreview.com/mining/04092025/putzmeister-presents-wetkret-2-narrow-vein-the-first-dual-operation-mechanised-concrete-spraying-equipment-for-narrow-vein-mines/amp/
- [3] Sika AG (GlobeNewswire). (2026, June 9). Sika Opens State-of-the-Art Production and Concrete Service Hub in the Benelux Region.https://www.globenewswire.com/news-release/2026/06/09/3308538/0/en/SIKA-OPENS-STATE-OF-THE-ART-PRODUCTION-AND-CONCRETE-SERVICE-HUB-IN-THE-BENELUX-REGION.html
This Report Answers
- What value will shotcrete sales reach in 2026?
- By 2036, what market value will shotcrete reach?
- Which process takes the largest share of orders?
- What application and system do contractors favour?
- Which profiled countries show the fastest growth in shotcrete sales?
- Which suppliers lead the shotcrete market?
Table of Content
- Key Takeaways
- Market Size and CAGR
- Top Growth Driver
- Fastest Growing Segment
- Leading Region
- Key Companies
- Emerging Opportunities
- Executive Summary
- Global Market Outlook
- Demand-side Trends
- Supply-side Trends
- Technology Roadmap Analysis
- Analysis and Recommendations
- Analyst Perspective (What is happening? Why now? What should investors know?)
- Key Questions Answered
- How large is the market?
- What is the CAGR?
- What are key trends?
- Which region dominates?
- Who are the leaders?
Read More...
- Market Overview
- Market Coverage / Taxonomy
- Market Definition / Scope / Limitations
- Research Methodology
- Chapter Orientation
- Analytical Lens and Working Hypotheses
- Market Structure, Signals, and Trend Drivers
- Benchmarking and Cross-market Comparability
- Market Sizing, Forecasting, and Opportunity Mapping
- Research Design and Evidence Framework
- Desk Research Programme (Secondary Evidence)
- Expert Input and Fieldwork (Primary Evidence)
- Tooling, Models, and Reference Databases
- Data Engineering and Model Build
- Quality Assurance and Audit Trail
- Market Background
- Market Dynamics (Drivers, Restraints, Opportunity, Trends)
- Scenario Forecast (Optimistic, Likely, Conservative)
- Impact Analysis
- AI Impact
- Sustainability Impact
- Regulatory Impact
- Technology Impact
- Consumer / Buyer Analysis
- Purchase Drivers
- Adoption Barriers
- Buyer Journey
- Opportunity Map Analysis
- Product Life Cycle Analysis
- Supply Chain Analysis
- Investment Feasibility Matrix
- Value Chain Analysis
- PESTLE and Porter's Analysis
- Regulatory Landscape
- Regional Parent Market Outlook
- Production and Consumption Statistics
- Import and Export Statistics
- Global Market Analysis and Forecast, 2021 to 2036
- Historical Market Size Value (USD Billion) Analysis, 2021 to 2025
- Current and Future Market Size Value (USD Billion) Projections, 2026 to 2036
- Y-o-Y Growth Trend Analysis
- Absolute $ Opportunity Analysis
- Global Market Pricing Analysis, 2021 to 2036
- Global Market Analysis and Forecast, By Process, 2021 to 2036
- Introduction / Key Findings
- Historical Market Size Value (USD Billion) Analysis By Process, 2021 to 2025
- Current and Future Market Size Value (USD Billion) Analysis and Forecast By Process, 2026 to 2036
- Wet mix shotcrete
- Dry mix shotcrete
- Fiber-reinforced shotcrete
- Accelerated-set shotcrete
- Hybrid mix systems
- Y-o-Y Growth Trend Analysis By Process, 2021 to 2025
- Absolute $ Opportunity Analysis By Process, 2026 to 2036
- Global Market Analysis and Forecast, By Application, 2021 to 2036
- Introduction / Key Findings
- Historical Market Size Value (USD Billion) Analysis By Application, 2021 to 2025
- Current and Future Market Size Value (USD Billion) Analysis and Forecast By Application, 2026 to 2036
- Underground construction
- Tunnel lining
- Mining and slope stabilization
- Repair and rehabilitation
- Y-o-Y Growth Trend Analysis By Application, 2021 to 2025
- Absolute $ Opportunity Analysis By Application, 2026 to 2036
- Global Market Analysis and Forecast, By System, 2021 to 2036
- Introduction / Key Findings
- Historical Market Size Value (USD Billion) Analysis By System, 2021 to 2025
- Current and Future Market Size Value (USD Billion) Analysis and Forecast By System, 2026 to 2036
- Robotic spraying systems
- Manual spraying systems
- Remote-operated nozzle systems
- Trailer-mounted spraying systems
- Y-o-Y Growth Trend Analysis By System, 2021 to 2025
- Absolute $ Opportunity Analysis By System, 2026 to 2036
- Global Market Analysis and Forecast, By End Use, 2021 to 2036
- Introduction / Key Findings
- Historical Market Size Value (USD Billion) Analysis By End Use, 2021 to 2025
- Current and Future Market Size Value (USD Billion) Analysis and Forecast By End Use, 2026 to 2036
- Construction
- Mining
- Infrastructure and public works
- Repair and restoration
- Y-o-Y Growth Trend Analysis By End Use, 2021 to 2025
- Absolute $ Opportunity Analysis By End Use, 2026 to 2036
- Global Market Analysis and Forecast, By Geography, 2021 to 2036
- Introduction / Key Findings
- Historical Market Size Value (USD Billion) Analysis By Geography, 2021 to 2025
- Current and Future Market Size Value (USD Billion) Analysis and Forecast By Geography, 2026 to 2036
- Europe
- Asia Pacific
- North America
- Latin America and Middle East and Africa
- Y-o-Y Growth Trend Analysis By Geography, 2021 to 2025
- Absolute $ Opportunity Analysis By Geography, 2026 to 2036
- Global Market Analysis and Forecast, By Region, 2021 to 2036
- Introduction
- Historical Market Size Value (USD Billion) Analysis By Region, 2021 to 2025
- Current Market Size Value (USD Billion) Analysis and Forecast By Region, 2026 to 2036
- North America
- Latin America
- Western Europe
- Eastern Europe
- East Asia
- South Asia and Pacific
- Middle East and Africa
- Market Attractiveness Analysis By Region
- North America Market Analysis and Forecast, By Country, 2021 to 2036
- Historical Market Size Value (USD Billion) Trend Analysis By Market Taxonomy, 2021 to 2025
- Market Size Value (USD Billion) Forecast By Market Taxonomy, 2026 to 2036
- By Country
- United States
- Canada
- By Process
- By Application
- By System
- By End Use
- By Geography
- By Country
- Market Attractiveness Analysis
- By Country
- By Process
- By Application
- By System
- By End Use
- By Geography
- Key Takeaways
- Latin America Market Analysis and Forecast, By Country
- Historical Market Size Value (USD Billion) Trend Analysis By Market Taxonomy, 2021 to 2025
- Market Size Value (USD Billion) Forecast By Market Taxonomy, 2026 to 2036
- By Country
- Brazil
- Mexico
- Argentina
- Chile
- By Process
- By Application
- By System
- By End Use
- By Geography
- By Country
- Market Attractiveness Analysis
- By Country
- By Process
- By Application
- By System
- By End Use
- By Geography
- Key Takeaways
- Western Europe Market Analysis and Forecast, By Country
- Historical Market Size Value (USD Billion) Trend Analysis By Market Taxonomy, 2021 to 2025
- Market Size Value (USD Billion) Forecast By Market Taxonomy, 2026 to 2036
- By Country
- Germany
- France
- United Kingdom
- Italy
- Spain
- Benelux
- Nordics
- By Process
- By Application
- By System
- By End Use
- By Geography
- By Country
- Market Attractiveness Analysis
- By Country
- By Process
- By Application
- By System
- By End Use
- By Geography
- Key Takeaways
- Eastern Europe Market Analysis and Forecast, By Country
- Historical Market Size Value (USD Billion) Trend Analysis By Market Taxonomy, 2021 to 2025
- Market Size Value (USD Billion) Forecast By Market Taxonomy, 2026 to 2036
- By Country
- Poland
- Czech Republic
- Romania
- Hungary
- By Process
- By Application
- By System
- By End Use
- By Geography
- By Country
- Market Attractiveness Analysis
- By Country
- By Process
- By Application
- By System
- By End Use
- By Geography
- Key Takeaways
- East Asia Market Analysis and Forecast, By Country
- Historical Market Size Value (USD Billion) Trend Analysis By Market Taxonomy, 2021 to 2025
- Market Size Value (USD Billion) Forecast By Market Taxonomy, 2026 to 2036
- By Country
- China
- South Korea
- By Process
- By Application
- By System
- By End Use
- By Geography
- By Country
- Market Attractiveness Analysis
- By Country
- By Process
- By Application
- By System
- By End Use
- By Geography
- Key Takeaways
- South Asia and Pacific Market Analysis and Forecast, By Country
- Historical Market Size Value (USD Billion) Trend Analysis By Market Taxonomy, 2021 to 2025
- Market Size Value (USD Billion) Forecast By Market Taxonomy, 2026 to 2036
- By Country
- India
- Australia and New Zealand
- By Process
- By Application
- By System
- By End Use
- By Geography
- By Country
- Market Attractiveness Analysis
- By Country
- By Process
- By Application
- By System
- By End Use
- By Geography
- Key Takeaways
- Middle East and Africa Market Analysis and Forecast, By Country
- Historical Market Size Value (USD Billion) Trend Analysis By Market Taxonomy, 2021 to 2025
- Market Size Value (USD Billion) Forecast By Market Taxonomy, 2026 to 2036
- By Country
- GCC Countries
- South Africa
- Türkiye
- Israel
- By Process
- By Application
- By System
- By End Use
- By Geography
- By Country
- Market Attractiveness Analysis
- By Country
- By Process
- By Application
- By System
- By End Use
- By Geography
- Key Takeaways
- Key Countries Market Analysis
- United States
- Pricing Analysis
- Market Share Analysis, 2025
- By Process
- By Application
- By System
- By End Use
- By Geography
- Canada
- Pricing Analysis
- Market Share Analysis, 2025
- By Process
- By Application
- By System
- By End Use
- By Geography
- Mexico
- Pricing Analysis
- Market Share Analysis, 2025
- By Process
- By Application
- By System
- By End Use
- By Geography
- Brazil
- Pricing Analysis
- Market Share Analysis, 2025
- By Process
- By Application
- By System
- By End Use
- By Geography
- Chile
- Pricing Analysis
- Market Share Analysis, 2025
- By Process
- By Application
- By System
- By End Use
- By Geography
- Germany
- Pricing Analysis
- Market Share Analysis, 2025
- By Process
- By Application
- By System
- By End Use
- By Geography
- United Kingdom
- Pricing Analysis
- Market Share Analysis, 2025
- By Process
- By Application
- By System
- By End Use
- By Geography
- Italy
- Pricing Analysis
- Market Share Analysis, 2025
- By Process
- By Application
- By System
- By End Use
- By Geography
- Spain
- Pricing Analysis
- Market Share Analysis, 2025
- By Process
- By Application
- By System
- By End Use
- By Geography
- France
- Pricing Analysis
- Market Share Analysis, 2025
- By Process
- By Application
- By System
- By End Use
- By Geography
- India
- Pricing Analysis
- Market Share Analysis, 2025
- By Process
- By Application
- By System
- By End Use
- By Geography
- Australia and New Zealand
- Pricing Analysis
- Market Share Analysis, 2025
- By Process
- By Application
- By System
- By End Use
- By Geography
- China
- Pricing Analysis
- Market Share Analysis, 2025
- By Process
- By Application
- By System
- By End Use
- By Geography
- South Korea
- Pricing Analysis
- Market Share Analysis, 2025
- By Process
- By Application
- By System
- By End Use
- By Geography
- Poland
- Pricing Analysis
- Market Share Analysis, 2025
- By Process
- By Application
- By System
- By End Use
- By Geography
- Hungary
- Pricing Analysis
- Market Share Analysis, 2025
- By Process
- By Application
- By System
- By End Use
- By Geography
- Türkiye
- Pricing Analysis
- Market Share Analysis, 2025
- By Process
- By Application
- By System
- By End Use
- By Geography
- South Africa
- Pricing Analysis
- Market Share Analysis, 2025
- By Process
- By Application
- By System
- By End Use
- By Geography
- United States
- Market Structure Analysis
- Competition Dashboard
- Competition Benchmarking
- Market Share Analysis of Top Players
- By Regional
- By Process
- By Application
- By System
- By End Use
- By Geography
- Emerging Startups
- Innovation Benchmarking
- Competition Analysis
- Competition Deep Dive
- Sika AG
- Overview
- Product Portfolio
- Profitability by Market Segments
- Sales Footprint
- Strategy Overview
- Marketing Strategy
- Product Strategy
- Channel Strategy
- Heidelberg Materials
- Mapei
- Saint-Gobain
- Normet
- Conmix Ltd
- Wieser Concrete
- Rockbond SCP
- KPM Industries
- Metalco SRL
- Sika AG
- Case Studies
- Success Stories
- Recent Developments
- Competition Deep Dive
- Assumptions & Acronyms Used
List of Tables
- Table 1: Global Market Value (USD Billion) Forecast by Region, 2021 to 2036
- Table 2: Global Market Value (USD Billion) Forecast by Process, 2021 to 2036
- Table 3: Global Market Value (USD Billion) Forecast by Application, 2021 to 2036
- Table 4: Global Market Value (USD Billion) Forecast by System, 2021 to 2036
- Table 5: Global Market Value (USD Billion) Forecast by End Use, 2021 to 2036
- Table 6: Global Market Value (USD Billion) Forecast by Geography, 2021 to 2036
- Table 7: North America Market Value (USD Billion) Forecast by Country, 2021 to 2036
- Table 8: North America Market Value (USD Billion) Forecast by Process, 2021 to 2036
- Table 9: North America Market Value (USD Billion) Forecast by Application, 2021 to 2036
- Table 10: North America Market Value (USD Billion) Forecast by System, 2021 to 2036
- Table 11: North America Market Value (USD Billion) Forecast by End Use, 2021 to 2036
- Table 12: North America Market Value (USD Billion) Forecast by Geography, 2021 to 2036
- Table 13: Latin America Market Value (USD Billion) Forecast by Country, 2021 to 2036
- Table 14: Latin America Market Value (USD Billion) Forecast by Process, 2021 to 2036
- Table 15: Latin America Market Value (USD Billion) Forecast by Application, 2021 to 2036
- Table 16: Latin America Market Value (USD Billion) Forecast by System, 2021 to 2036
- Table 17: Latin America Market Value (USD Billion) Forecast by End Use, 2021 to 2036
- Table 18: Latin America Market Value (USD Billion) Forecast by Geography, 2021 to 2036
- Table 19: Western Europe Market Value (USD Billion) Forecast by Country, 2021 to 2036
- Table 20: Western Europe Market Value (USD Billion) Forecast by Process, 2021 to 2036
- Table 21: Western Europe Market Value (USD Billion) Forecast by Application, 2021 to 2036
- Table 22: Western Europe Market Value (USD Billion) Forecast by System, 2021 to 2036
- Table 23: Western Europe Market Value (USD Billion) Forecast by End Use, 2021 to 2036
- Table 24: Western Europe Market Value (USD Billion) Forecast by Geography, 2021 to 2036
- Table 25: Eastern Europe Market Value (USD Billion) Forecast by Country, 2021 to 2036
- Table 26: Eastern Europe Market Value (USD Billion) Forecast by Process, 2021 to 2036
- Table 27: Eastern Europe Market Value (USD Billion) Forecast by Application, 2021 to 2036
- Table 28: Eastern Europe Market Value (USD Billion) Forecast by System, 2021 to 2036
- Table 29: Eastern Europe Market Value (USD Billion) Forecast by End Use, 2021 to 2036
- Table 30: Eastern Europe Market Value (USD Billion) Forecast by Geography, 2021 to 2036
- Table 31: East Asia Market Value (USD Billion) Forecast by Country, 2021 to 2036
- Table 32: East Asia Market Value (USD Billion) Forecast by Process, 2021 to 2036
- Table 33: East Asia Market Value (USD Billion) Forecast by Application, 2021 to 2036
- Table 34: East Asia Market Value (USD Billion) Forecast by System, 2021 to 2036
- Table 35: East Asia Market Value (USD Billion) Forecast by End Use, 2021 to 2036
- Table 36: East Asia Market Value (USD Billion) Forecast by Geography, 2021 to 2036
- Table 37: South Asia and Pacific Market Value (USD Billion) Forecast by Country, 2021 to 2036
- Table 38: South Asia and Pacific Market Value (USD Billion) Forecast by Process, 2021 to 2036
- Table 39: South Asia and Pacific Market Value (USD Billion) Forecast by Application, 2021 to 2036
- Table 40: South Asia and Pacific Market Value (USD Billion) Forecast by System, 2021 to 2036
- Table 41: South Asia and Pacific Market Value (USD Billion) Forecast by End Use, 2021 to 2036
- Table 42: South Asia and Pacific Market Value (USD Billion) Forecast by Geography, 2021 to 2036
- Table 43: Middle East and Africa Market Value (USD Billion) Forecast by Country, 2021 to 2036
- Table 44: Middle East and Africa Market Value (USD Billion) Forecast by Process, 2021 to 2036
- Table 45: Middle East and Africa Market Value (USD Billion) Forecast by Application, 2021 to 2036
- Table 46: Middle East and Africa Market Value (USD Billion) Forecast by System, 2021 to 2036
- Table 47: Middle East and Africa Market Value (USD Billion) Forecast by End Use, 2021 to 2036
- Table 48: Middle East and Africa Market Value (USD Billion) Forecast by Geography, 2021 to 2036
List of Figures
- Figure 1: Global Market Pricing Analysis
- Figure 2: Global Market Value (USD Billion) Forecast 2021-2036
- Figure 3: Global Market Value Share and BPS Analysis by Process, 2026 and 2036
- Figure 4: Global Market Y-o-Y Growth Comparison by Process, 2026-2036
- Figure 5: Global Market Attractiveness Analysis by Process
- Figure 6: Global Market Value Share and BPS Analysis by Application, 2026 and 2036
- Figure 7: Global Market Y-o-Y Growth Comparison by Application, 2026-2036
- Figure 8: Global Market Attractiveness Analysis by Application
- Figure 9: Global Market Value Share and BPS Analysis by System, 2026 and 2036
- Figure 10: Global Market Y-o-Y Growth Comparison by System, 2026-2036
- Figure 11: Global Market Attractiveness Analysis by System
- Figure 12: Global Market Value Share and BPS Analysis by End Use, 2026 and 2036
- Figure 13: Global Market Y-o-Y Growth Comparison by End Use, 2026-2036
- Figure 14: Global Market Attractiveness Analysis by End Use
- Figure 15: Global Market Value Share and BPS Analysis by Geography, 2026 and 2036
- Figure 16: Global Market Y-o-Y Growth Comparison by Geography, 2026-2036
- Figure 17: Global Market Attractiveness Analysis by Geography
- Figure 18: Global Market Value (USD Billion) Share and BPS Analysis by Region, 2026 and 2036
- Figure 19: Global Market Y-o-Y Growth Comparison by Region, 2026-2036
- Figure 20: Global Market Attractiveness Analysis by Region
- Figure 21: North America Market Incremental Dollar Opportunity, 2026-2036
- Figure 22: Latin America Market Incremental Dollar Opportunity, 2026-2036
- Figure 23: Western Europe Market Incremental Dollar Opportunity, 2026-2036
- Figure 24: Eastern Europe Market Incremental Dollar Opportunity, 2026-2036
- Figure 25: East Asia Market Incremental Dollar Opportunity, 2026-2036
- Figure 26: South Asia and Pacific Market Incremental Dollar Opportunity, 2026-2036
- Figure 27: Middle East and Africa Market Incremental Dollar Opportunity, 2026-2036
- Figure 28: North America Market Value Share and BPS Analysis by Country, 2026 and 2036
- Figure 29: North America Market Value Share and BPS Analysis by Process, 2026 and 2036
- Figure 30: North America Market Y-o-Y Growth Comparison by Process, 2026-2036
- Figure 31: North America Market Attractiveness Analysis by Process
- Figure 32: North America Market Value Share and BPS Analysis by Application, 2026 and 2036
- Figure 33: North America Market Y-o-Y Growth Comparison by Application, 2026-2036
- Figure 34: North America Market Attractiveness Analysis by Application
- Figure 35: North America Market Value Share and BPS Analysis by System, 2026 and 2036
- Figure 36: North America Market Y-o-Y Growth Comparison by System, 2026-2036
- Figure 37: North America Market Attractiveness Analysis by System
- Figure 38: North America Market Value Share and BPS Analysis by End Use, 2026 and 2036
- Figure 39: North America Market Y-o-Y Growth Comparison by End Use, 2026-2036
- Figure 40: North America Market Attractiveness Analysis by End Use
- Figure 41: North America Market Value Share and BPS Analysis by Geography, 2026 and 2036
- Figure 42: North America Market Y-o-Y Growth Comparison by Geography, 2026-2036
- Figure 43: North America Market Attractiveness Analysis by Geography
- Figure 44: Latin America Market Value Share and BPS Analysis by Country, 2026 and 2036
- Figure 45: Latin America Market Value Share and BPS Analysis by Process, 2026 and 2036
- Figure 46: Latin America Market Y-o-Y Growth Comparison by Process, 2026-2036
- Figure 47: Latin America Market Attractiveness Analysis by Process
- Figure 48: Latin America Market Value Share and BPS Analysis by Application, 2026 and 2036
- Figure 49: Latin America Market Y-o-Y Growth Comparison by Application, 2026-2036
- Figure 50: Latin America Market Attractiveness Analysis by Application
- Figure 51: Latin America Market Value Share and BPS Analysis by System, 2026 and 2036
- Figure 52: Latin America Market Y-o-Y Growth Comparison by System, 2026-2036
- Figure 53: Latin America Market Attractiveness Analysis by System
- Figure 54: Latin America Market Value Share and BPS Analysis by End Use, 2026 and 2036
- Figure 55: Latin America Market Y-o-Y Growth Comparison by End Use, 2026-2036
- Figure 56: Latin America Market Attractiveness Analysis by End Use
- Figure 57: Latin America Market Value Share and BPS Analysis by Geography, 2026 and 2036
- Figure 58: Latin America Market Y-o-Y Growth Comparison by Geography, 2026-2036
- Figure 59: Latin America Market Attractiveness Analysis by Geography
- Figure 60: Western Europe Market Value Share and BPS Analysis by Country, 2026 and 2036
- Figure 61: Western Europe Market Value Share and BPS Analysis by Process, 2026 and 2036
- Figure 62: Western Europe Market Y-o-Y Growth Comparison by Process, 2026-2036
- Figure 63: Western Europe Market Attractiveness Analysis by Process
- Figure 64: Western Europe Market Value Share and BPS Analysis by Application, 2026 and 2036
- Figure 65: Western Europe Market Y-o-Y Growth Comparison by Application, 2026-2036
- Figure 66: Western Europe Market Attractiveness Analysis by Application
- Figure 67: Western Europe Market Value Share and BPS Analysis by System, 2026 and 2036
- Figure 68: Western Europe Market Y-o-Y Growth Comparison by System, 2026-2036
- Figure 69: Western Europe Market Attractiveness Analysis by System
- Figure 70: Western Europe Market Value Share and BPS Analysis by End Use, 2026 and 2036
- Figure 71: Western Europe Market Y-o-Y Growth Comparison by End Use, 2026-2036
- Figure 72: Western Europe Market Attractiveness Analysis by End Use
- Figure 73: Western Europe Market Value Share and BPS Analysis by Geography, 2026 and 2036
- Figure 74: Western Europe Market Y-o-Y Growth Comparison by Geography, 2026-2036
- Figure 75: Western Europe Market Attractiveness Analysis by Geography
- Figure 76: Eastern Europe Market Value Share and BPS Analysis by Country, 2026 and 2036
- Figure 77: Eastern Europe Market Value Share and BPS Analysis by Process, 2026 and 2036
- Figure 78: Eastern Europe Market Y-o-Y Growth Comparison by Process, 2026-2036
- Figure 79: Eastern Europe Market Attractiveness Analysis by Process
- Figure 80: Eastern Europe Market Value Share and BPS Analysis by Application, 2026 and 2036
- Figure 81: Eastern Europe Market Y-o-Y Growth Comparison by Application, 2026-2036
- Figure 82: Eastern Europe Market Attractiveness Analysis by Application
- Figure 83: Eastern Europe Market Value Share and BPS Analysis by System, 2026 and 2036
- Figure 84: Eastern Europe Market Y-o-Y Growth Comparison by System, 2026-2036
- Figure 85: Eastern Europe Market Attractiveness Analysis by System
- Figure 86: Eastern Europe Market Value Share and BPS Analysis by End Use, 2026 and 2036
- Figure 87: Eastern Europe Market Y-o-Y Growth Comparison by End Use, 2026-2036
- Figure 88: Eastern Europe Market Attractiveness Analysis by End Use
- Figure 89: Eastern Europe Market Value Share and BPS Analysis by Geography, 2026 and 2036
- Figure 90: Eastern Europe Market Y-o-Y Growth Comparison by Geography, 2026-2036
- Figure 91: Eastern Europe Market Attractiveness Analysis by Geography
- Figure 92: East Asia Market Value Share and BPS Analysis by Country, 2026 and 2036
- Figure 93: East Asia Market Value Share and BPS Analysis by Process, 2026 and 2036
- Figure 94: East Asia Market Y-o-Y Growth Comparison by Process, 2026-2036
- Figure 95: East Asia Market Attractiveness Analysis by Process
- Figure 96: East Asia Market Value Share and BPS Analysis by Application, 2026 and 2036
- Figure 97: East Asia Market Y-o-Y Growth Comparison by Application, 2026-2036
- Figure 98: East Asia Market Attractiveness Analysis by Application
- Figure 99: East Asia Market Value Share and BPS Analysis by System, 2026 and 2036
- Figure 100: East Asia Market Y-o-Y Growth Comparison by System, 2026-2036
- Figure 101: East Asia Market Attractiveness Analysis by System
- Figure 102: East Asia Market Value Share and BPS Analysis by End Use, 2026 and 2036
- Figure 103: East Asia Market Y-o-Y Growth Comparison by End Use, 2026-2036
- Figure 104: East Asia Market Attractiveness Analysis by End Use
- Figure 105: East Asia Market Value Share and BPS Analysis by Geography, 2026 and 2036
- Figure 106: East Asia Market Y-o-Y Growth Comparison by Geography, 2026-2036
- Figure 107: East Asia Market Attractiveness Analysis by Geography
- Figure 108: South Asia and Pacific Market Value Share and BPS Analysis by Country, 2026 and 2036
- Figure 109: South Asia and Pacific Market Value Share and BPS Analysis by Process, 2026 and 2036
- Figure 110: South Asia and Pacific Market Y-o-Y Growth Comparison by Process, 2026-2036
- Figure 111: South Asia and Pacific Market Attractiveness Analysis by Process
- Figure 112: South Asia and Pacific Market Value Share and BPS Analysis by Application, 2026 and 2036
- Figure 113: South Asia and Pacific Market Y-o-Y Growth Comparison by Application, 2026-2036
- Figure 114: South Asia and Pacific Market Attractiveness Analysis by Application
- Figure 115: South Asia and Pacific Market Value Share and BPS Analysis by System, 2026 and 2036
- Figure 116: South Asia and Pacific Market Y-o-Y Growth Comparison by System, 2026-2036
- Figure 117: South Asia and Pacific Market Attractiveness Analysis by System
- Figure 118: South Asia and Pacific Market Value Share and BPS Analysis by End Use, 2026 and 2036
- Figure 119: South Asia and Pacific Market Y-o-Y Growth Comparison by End Use, 2026-2036
- Figure 120: South Asia and Pacific Market Attractiveness Analysis by End Use
- Figure 121: South Asia and Pacific Market Value Share and BPS Analysis by Geography, 2026 and 2036
- Figure 122: South Asia and Pacific Market Y-o-Y Growth Comparison by Geography, 2026-2036
- Figure 123: South Asia and Pacific Market Attractiveness Analysis by Geography
- Figure 124: Middle East and Africa Market Value Share and BPS Analysis by Country, 2026 and 2036
- Figure 125: Middle East and Africa Market Value Share and BPS Analysis by Process, 2026 and 2036
- Figure 126: Middle East and Africa Market Y-o-Y Growth Comparison by Process, 2026-2036
- Figure 127: Middle East and Africa Market Attractiveness Analysis by Process
- Figure 128: Middle East and Africa Market Value Share and BPS Analysis by Application, 2026 and 2036
- Figure 129: Middle East and Africa Market Y-o-Y Growth Comparison by Application, 2026-2036
- Figure 130: Middle East and Africa Market Attractiveness Analysis by Application
- Figure 131: Middle East and Africa Market Value Share and BPS Analysis by System, 2026 and 2036
- Figure 132: Middle East and Africa Market Y-o-Y Growth Comparison by System, 2026-2036
- Figure 133: Middle East and Africa Market Attractiveness Analysis by System
- Figure 134: Middle East and Africa Market Value Share and BPS Analysis by End Use, 2026 and 2036
- Figure 135: Middle East and Africa Market Y-o-Y Growth Comparison by End Use, 2026-2036
- Figure 136: Middle East and Africa Market Attractiveness Analysis by End Use
- Figure 137: Middle East and Africa Market Value Share and BPS Analysis by Geography, 2026 and 2036
- Figure 138: Middle East and Africa Market Y-o-Y Growth Comparison by Geography, 2026-2036
- Figure 139: Middle East and Africa Market Attractiveness Analysis by Geography
- Figure 140: Global Market - Tier Structure Analysis
- Figure 141: Global Market - Company Share Analysis
Frequently Asked Questions
What is the Shotcrete (Sprayed Concrete) Market worth in 2026?
Shotcrete sales are valued at USD 10.1 billion in 2026, according to FMI. The market will reach USD 18.4 billion by 2036 as tunnel, mine and infrastructure crews replace cast concrete with sprayed application.
What CAGR is projected for the Shotcrete (Sprayed Concrete) Market through 2036?
FMI projects a 6.2% CAGR for the shotcrete market from 2026 to 2036. Tunnel programs and robotic spraying equipment will support much of this growth.
Which process holds a leading share in 2026?
Wet mix shotcrete will hold 55.3% of process sales in 2026. Crews on long tunnel and mine drives choose this method for steady output without remixing.
Which system holds a leading share in 2026?
Robotic spraying systems will account for 61.4% of system sales in 2026. Operators choose this equipment to move spray crews away from unstable rock faces.
Which country has a leading growth outlook through 2036?
China leads the profiled countries with an 8.4% CAGR for shotcrete sales over 2026 to 2036. New rail and expressway tunnel programs across western China favour wet mix batching plants that match continuous excavation.
Who are the key companies in the Shotcrete (Sprayed Concrete) Market?
Key companies include Sika AG, Heidelberg Materials, Mapei, Saint-Gobain, Conmix Ltd, Wieser Concrete, Normet, Putzmeister Underground, Epiroc, Rockbond SCP, KPM Industries, and Metalco SRL. These suppliers compete on product range, plant reach and technical support.
Preview the report firsthand - request a free sample
Get SampleGet the brochure for pricing and purchase details.
Get PDF
