Slimming Tea Market Outlook (2022 to 2032)

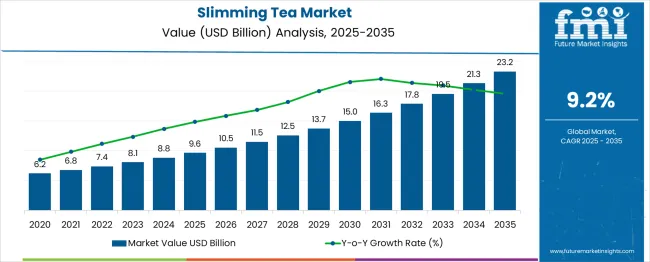
The global slimming tea market size is anticipated to be worth $7.4 billion in 2022 and it is expected to surpass US$ 11.5 billion by 2032. The demand for slimming tea is growing at an astounding CAGR of 9.2% between 2022 and 2032, owing to:

  • Growth in the number of cafes, as well as the availability of slimming tea in both online and offline retail outlets.
  • To prevent obesity and encourage weight reduction, several initiatives are created and supported by businesses and governments.
  • Consumer demand has shifted away from industrial-scale processed foods in favor of healthier, more natural, or organic alternatives in recent years.
  • By encouraging people to be more mindful of the food and beverages they eat, this transition has increased interest in fitness among people all over the world.

Customers are concentrating on creating a practical and healthy diet that includes drinking slimming tea as a result of their busy lifestyles and lack of physical exercise. Additional factors that assist market development include the availability of slimming tea in both online and offline retail locations, accessible and appealing packaging, an increase in the number of cafés, and an increase in disposable income.

Report Attribute Details
Slimming Tea Market Estimated Base Year Value (2021) US$ 6.1 Billion
Slimming Tea Market Expected Market Value (2022) US$ 7.4 Billion
Slimming Tea Market Anticipated Forecast Value (2032) US$ 11.5 Billion
Slimming Tea Market Projected Growth Rate (2022 to 2032) 9.2% CAGR

Don't pay for what you don't need

Customize your report by selecting specific countries or regions and save 30%!

Country-wise Outlook of the Slimming Tea Market

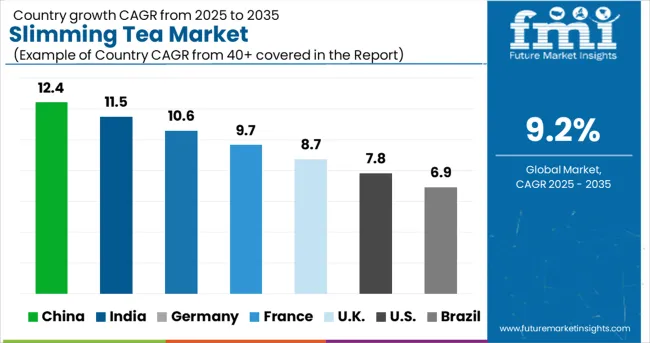
Asia Pacific held more than 35% share of the slimming tea market in 2021. The regional market is being driven by the increased demand for healthy teas and functional drinks. Green tea production accounted for 32% of world output in 2019. 84% of the tea imported into the nation is exported as green tea. Purple tea, fruit teas, and herbal teas are also quite popular. Slimming tea companies in the region are introducing novel tastes to influence customers' purchasing habits. The growing demand for slimming tea from consumers who respect their health presents an opportunity for manufacturers of slimming tea to increase their market share.

Over the projection period, the European market is predicted to grow the quickest. The growing demand for low-sugar meals is what is driving the slimming tea business in Europe. For instance, the European Commission authorized Rebaudioside M (Reb M) for use in foods and drinks in 2021. With the help of this project, manufacturers should be able to investigate fresh tools for reducing sugar in a range of product categories.

Recent Developments by Top Slimming Tea Manufacturers

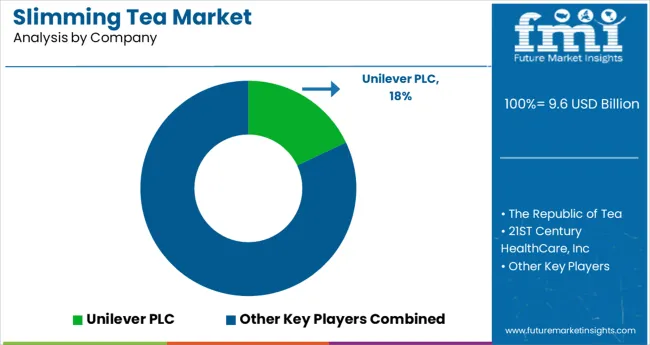
The slimming tea market is relatively concentrated with a few large multinational corporations controlling the majority of the industry. To achieve a competitive market edge that results from these synergies, major firms including Associated British Foods, Tata Consumer Products Limited, and Numi, Inc. are concentrating on new product innovations, acquisitions, and alliances.

  • To increase its market position, Unilever plc, owner of the well-known green tea brand Lipton, is now investing in the diversification of its green tea offering.
  • The business and its partner PepsiCo introduced two new tea flavors in March 2020 (watermelon and white peach). With this introduction, the business will be able to meet the expectations of today's consumers by diversifying its product line.
  • In November 2019, Hunan, China-based Urban Tea Inc., a leading supplier of specialty teas and baked goods, announced that it has successfully acquired a 51% ownership stake in Hunan 39 Pu Tea Co., Ltd. This acquisition aids the firm in extending its sales channels and increasing operations in the tea industry.
  • Unilever said in 2021 that it will broaden the tea market in Western Europe and North America. The company will continue to conduct business in India and Indonesia.

Slimming tea is considered to be a type of herbal tea that helps in digestion and maintaining the metabolism in an individual’s body. It consists of special compounds that act as a metabolism booster by burning calories. These compounds also act as fat blockers by releasing body toxins.

This type of tea can reduce sugar cravings and act as an appetite suppressor, thereby lowering the intake of calories. It is capable of detoxifying the body and preventing chronic diseases, such as cancer.

Besides, slimming tea improves brain functioning, delays signs of aging, helps to lose weight, detoxifies the body, reduces abdominal fats, and enhances mind wellness. The easy availability of a wide range of teas in the market, including herbal tea, black tea, ginger tea, peppermint tea, calendula tea, and hibiscus tea is likely to bode well for the market.

Nandini Roy Choudhury

Principal Consultant

Talk to Analyst

Find your sweet spots for generating winning opportunities in this market.

Which are Some Prominent Drivers Spearheading Slimming Tea Market Growth?

The rising prevalence of various health issues, such as diabetes, cardiovascular diseases, and obesity owing to the lack of physical activities and busy lifestyles of people is expected to bolster the sales of slimming tea in the assessment period. The increasing incidence of diabetes has compelled people to focus more on the adoption of a healthy and convenient diet, which is set to influence the market.

According to the World Health Organization (WHO), the number of people suffering from diabetes grew from 108 million in 1980 to 422 million in 2014. There was a 5% increase in premature mortality associated with the disease between 2000 and 2016. These numbers are estimated to grow at a fast pace in future years, thereby propelling the global market.

What are the Challenges Faced by the Slimming Tea Industry?

The bitter taste of slimming tea often urges consumers to incline toward other alternatives, such as exercise and dieting. This factor may hamper the slimming tea market growth in the evaluation period. In addition to that, some of the slimming teas contain senna, which can cause short-term health problems, such as abdominal cramps, diarrhea, and nausea. The production of this type of tea is not regulated by government bodies and this may decline in its sales in the future.

Get the data you need at a Fraction of the cost

Personalize your report by choosing insights you need
and save 40%!

Why is Asia Pacific Emerging as an Opportunistic Slimming Tea Market?

The rising number of cafes, attractive and convenient packaging of slimming tea and high disposable income of people in China and India are estimated to bolster the Asia Pacific slimming tea market share in the assessment period. The easy availability of slimming tea at offline and online stores is another factor that is set to augur well for the regional market.

In March 2022, for instance, NRI Chaiwala, a reputed tea shop in Delhi, launched multiple flavors of ‘Tea Leaf’ that include herbal chai, kadha chai, tandoori chai, mulethi chai, ginger lemon tea, and many more. This new range of tea flavors has many beneficial properties and will help the company to attract more consumers. Similar other product launches by renowned companies are expected to fuel the Asia Pacific market.
How is North America Contributing to Growth of the Slimming Tea Market?

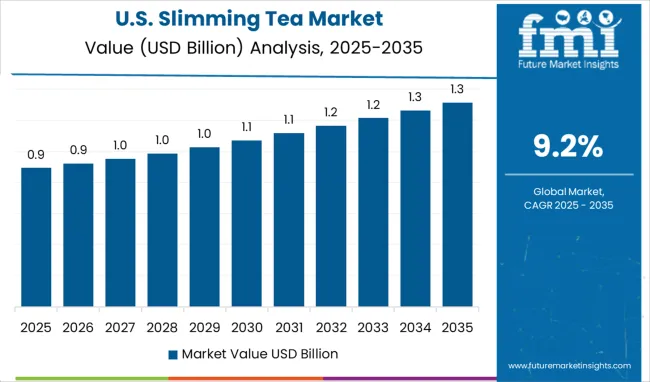
The availability of various types of slimming teas with innovative flavors, such as blueberry, orange, raspberry, and lemon in the USA and Canada is expected to drive the North American slimming tea market size in the forthcoming years. The high demand for caffeine-free and sugar-free teas in these countries is another significant factor that is projected to propel the market.

The presence of many small and medium manufacturers, as well as the low cost of manufacturing, is likely to augur well for the North American market. The rising prevalence of obesity in the USA is also set to accelerate the market.

As per the Centers for Disease Control and Prevention (CDC), the prevalence of obesity was 42.4% in the USA between 2017 to 2018. This trend is projected to continue throughout the forthcoming years, thereby pushing sales of slimming tea across North America.
Market Competition

Some of the leading companies operating in the global slimming tea market include Sira Impex Pvt. Ltd., Tea Treasure, Changzhou Kakoo Tea Foodstuff Co., Ltd., Hyleys, Swastik Eucalyptus Oil Co., 21stCentury Healthcare, Inc., Okuma Nutritionals, Kudos Ayurveda, Triple Leaf Tea Inc., Himalayan Brew Tea Factory, HERBALGREENLAB, Denmark, Tea Aroma, and Imperial Tea Groups among others.

Reputed companies are mainly focusing on launching various innovative products to cater to the surging demand from consumers. Meanwhile, a few other companies are engaging in partnerships and collaborations to co-develop new products as per the specific requirements of consumers to gain a competitive edge.

Report Scope

Report Attribute Details
Growth Rate CAGR of 9.2% from 2022 to 2032
Base Year for Estimation 2021
Historical Data 2015 to 2020
Forecast Period 2022 to 2032
Quantitative Units Revenue in USD Billion, Volume in Kilotons, and CAGR from 2022 to 2032
Report Coverage Revenue Forecast, Volume Forecast, Company Ranking, Competitive Landscape, Growth Factors, Trends, and Pricing Analysis
Segments Covered
  • Form
  • Nature
  • End Use
  • Distribution Channel
  • Region
Regions Covered
  • North America
  • Latin America
  • Western Europe
  • Eastern Europe
  • Asia Pacific Excluding Japan
  • Japan
  • Middle East and Africa
Key Countries Profiled
  • USA
  • Canada
  • Brazil
  • Argentina
  • Germany
  • United Kingdom
  • France
  • Spain
  • Italy
  • Nordics
  • BENELUX
  • Australia & New Zealand
  • China
  • India
  • ASIAN
  • GCC Countries
  • South Africa
Key Companies Profiled
  • Sira Impex Pvt. Ltd.
  • Tea Treasure
  • Changzhou Kakoo Tea Foodstuff Co., Ltd.
  • Hyleys
  • Swastik Eucalyptus Oil Co.
  • 21stCentury Healthcare, Inc.
  • Okuma Nutritionals
  • Kudos Ayurveda
  • Triple Leaf Tea Inc.
  • Himalayan Brew Tea Factory
  • HERBALGREENLAB
  • Deemark
  • Tea Aroma
  • Imperial Tea Groups
Customization Available Upon Request

Key Segments Profiled in the Slimming Tea Industry Survey

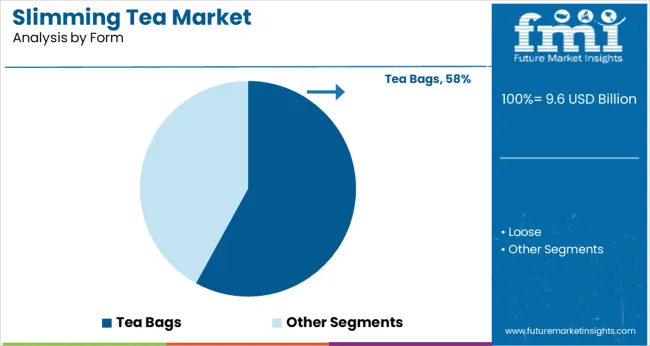
By Form:

  • Loose
  • Tea Bags

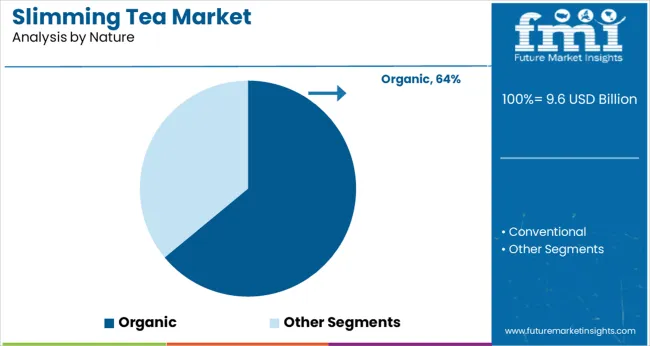
By Nature:

  • Organic
  • Conventional

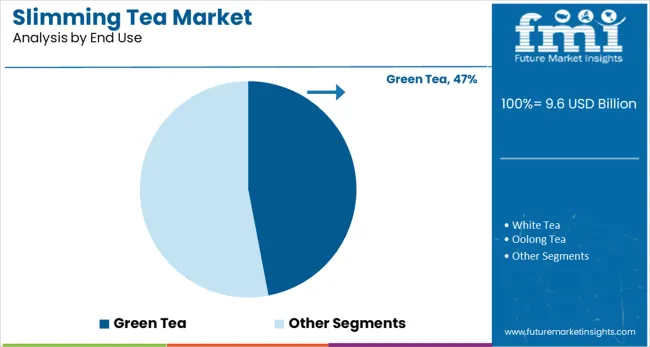
By End Use:

  • Green Tea
  • White Tea
  • Oolong Tea
  • Others

By Distribution Channel:

  • Supermarket/ Hypermarket
  • Online Retailers
  • Specialty Stores
  • Mass Grocery Stores

By Region:

  • North America
  • Latin America
  • Western Europe
  • Eastern Europe
  • Asia Pacific Excluding Japan
  • Japan
  • Middle East and Africa

Frequently Asked Questions

How is the Slimming Tea Market Growing?

The slimming tea market is predicted to grow at 9.2% CAGR through 2032.

Which Region Holds the Highest Revenue Potential in the Slimming Tea Market?

Asia Pacific slimming tea holds the highest revenue potential.

What is the Future Scope of Growth for the Slimming Tea Market?

The slimming tea market is expected to surpass US$ 11.5 Billion by 2032.

What is the Current Slimming Tea Market Size?

The slimming tea market size is anticipated to be over US$ 7.4 Billion in 2022.

Table of Content
1. Executive Summary | Slimming Tea Market

    1.1. Global Market Outlook

    1.2. Demand-side Trends

    1.3. Supply-side Trends

    1.4. Technology Roadmap Analysis

    1.5. Analysis and Recommendations

2. Market Overview

    2.1. Market Coverage / Taxonomy

    2.2. Market Definition / Scope / Limitations

3. Market Background

    3.1. Market Dynamics

        3.1.1. Drivers

        3.1.2. Restraints

        3.1.3. Opportunity

        3.1.4. Trends

    3.2. Scenario Forecast

        3.2.1. Demand in Optimistic Scenario

        3.2.2. Demand in Likely Scenario

        3.2.3. Demand in Conservative Scenario

    3.3. Opportunity Map Analysis

    3.4. Product Life Cycle Analysis

    3.5. Supply Chain Analysis

        3.5.1. Supply Side Participants and their Roles

            3.5.1.1. Producers

            3.5.1.2. Mid-Level Participants (Traders/ Agents/ Brokers)

            3.5.1.3. Wholesalers and Distributors

        3.5.2. Value Added and Value Created at Node in the Supply Chain

        3.5.3. List of Raw Material Suppliers

        3.5.4. List of Existing and Potential Buyers

    3.6. Investment Feasibility Matrix

    3.7. Value Chain Analysis

        3.7.1. Profit Margin Analysis

        3.7.2. Wholesalers and Distributors

        3.7.3. Retailers

    3.8. PESTLE and Porter’s Analysis

    3.9. Regulatory Landscape

        3.9.1. By Key Regions

        3.9.2. By Key Countries

    3.10. Regional Parent Market Outlook

    3.11. Production and Consumption Statistics

    3.12. Import and Export Statistics

4. Global Market Analysis 2017 to 2021 and Forecast, 2022 to 2032

    4.1. Historical Market Size Value (US$ Million) & Volume (MT) Analysis, 2017 to 2021

    4.2. Current and Future Market Size Value (US$ Million) & Volume (MT) Projections, 2022 to 2032

        4.2.1. Y-o-Y Growth Trend Analysis

        4.2.2. Absolute $ Opportunity Analysis

5. Global Market Analysis 2017 to 2021 and Forecast 2022 to 2032, By Product Type

    5.1. Introduction / Key Findings

    5.2. Historical Market Size Value (US$ Million) & Volume (MT) Analysis By Product Type, 2017 to 2021

    5.3. Current and Future Market Size Value (US$ Million) & Volume (MT) Analysis and Forecast By Product Type, 2022 to 2032

        5.3.1. Green Tea

        5.3.2. White Tea

        5.3.3. Oolong Tea

        5.3.4. Fruit/Herbal Tea

        5.3.5. Tea Blends

    5.4. Y-o-Y Growth Trend Analysis By Product Type, 2017 to 2021

    5.5. Absolute $ Opportunity Analysis By Product Type, 2022 to 2032 Deep-dive segmentation will be available in the sample on request

6. Global Market Analysis 2017 to 2021 and Forecast 2022 to 2032, By Flavour

    6.1. Introduction / Key Findings

    6.2. Historical Market Size Value (US$ Million) & Volume (MT) Analysis By Flavour, 2017 to 2021

    6.3. Current and Future Market Size Value (US$ Million) & Volume (MT) Analysis and Forecast By Flavour, 2022 to 2032

        6.3.1. Regular

        6.3.2. Flavored

    6.4. Y-o-Y Growth Trend Analysis By Flavour, 2017 to 2021

    6.5. Absolute $ Opportunity Analysis By Flavour, 2022 to 2032 Deep-dive segmentation will be available in the sample on request

7. Global Market Analysis 2017 to 2021 and Forecast 2022 to 2032, By Nature

    7.1. Introduction / Key Findings

    7.2. Historical Market Size Value (US$ Million) & Volume (MT) Analysis By Nature, 2017 to 2021

    7.3. Current and Future Market Size Value (US$ Million) & Volume (MT) Analysis and Forecast By Nature, 2022 to 2032

        7.3.1. Organic

        7.3.2. Conventional

    7.4. Y-o-Y Growth Trend Analysis By Nature, 2017 to 2021

    7.5. Absolute $ Opportunity Analysis By Nature, 2022 to 2032 Deep-dive segmentation will be available in the sample on request

8. Global Market Analysis 2017 to 2021 and Forecast 2022 to 2032, By Packaging

    8.1. Introduction / Key Findings

    8.2. Historical Market Size Value (US$ Million) & Volume (MT) Analysis By Packaging, 2017 to 2021

    8.3. Current and Future Market Size Value (US$ Million) & Volume (MT) Analysis and Forecast By Packaging, 2022 to 2032

        8.3.1. Pouches

        8.3.2. Carton

        8.3.3. Tins

    8.4. Y-o-Y Growth Trend Analysis By Packaging, 2017 to 2021

    8.5. Absolute $ Opportunity Analysis By Packaging, 2022 to 2032 Deep-dive segmentation will be available in the sample on request

9. Global Market Analysis 2017 to 2021 and Forecast 2022 to 2032, By Sales Channel

    9.1. Introduction / Key Findings

    9.2. Historical Market Size Value (US$ Million) & Volume (MT) Analysis By Sales Channel, 2017 to 2021

    9.3. Current and Future Market Size Value (US$ Million) & Volume (MT) Analysis and Forecast By Sales Channel, 2022 to 2032

        9.3.1. Store-based Retailing

        9.3.2. Online Retailing

    9.4. Y-o-Y Growth Trend Analysis By Sales Channel, 2017 to 2021

    9.5. Absolute $ Opportunity Analysis By Sales Channel, 2022 to 2032 Deep-dive segmentation will be available in the sample on request

10. Global Market Analysis 2017 to 2021 and Forecast 2022 to 2032, By Region

    10.1. Introduction

    10.2. Historical Market Size Value (US$ Million) & Volume (MT) Analysis By Region, 2017 to 2021

    10.3. Current Market Size Value (US$ Million) & Volume (MT) Analysis and Forecast By Region, 2022 to 2032

        10.3.1. North America

        10.3.2. Latin America

        10.3.3. Europe

        10.3.4. East Asia

        10.3.5. South Asia & Pacific

        10.3.6. Middle East and Africa

    10.4. Market Attractiveness Analysis By Region

11. North America Market Analysis 2017 to 2021 and Forecast 2022 to 2032, By Country

    11.1. Historical Market Size Value (US$ Million) & Volume (MT) Trend Analysis By Market Taxonomy, 2017 to 2021

    11.2. Market Size Value (US$ Million) & Volume (MT) Forecast By Market Taxonomy, 2022 to 2032

        11.2.1. By Country

            11.2.1.1. USA

            11.2.1.2. Canada

        11.2.2. By Product Type

        11.2.3. By Flavor

        11.2.4. By Nature

        11.2.5. By Packaging

        11.2.6. By Sales Channel

    11.3. Market Attractiveness Analysis

        11.3.1. By Country

        11.3.2. By Product Type

        11.3.3. By Flavor

        11.3.4. By Nature

        11.3.5. By Packaging

        11.3.6. By Sales Channel

    11.4. Key Takeaways

12. Latin America Market Analysis 2017 to 2021 and Forecast 2022 to 2032, By Country

    12.1. Historical Market Size Value (US$ Million) & Volume (MT) Trend Analysis By Market Taxonomy, 2017 to 2021

    12.2. Market Size Value (US$ Million) & Volume (MT) Forecast By Market Taxonomy, 2022 to 2032

        12.2.1. By Country

            12.2.1.1. Mexico

            12.2.1.2. Brazil

            12.2.1.3. Rest of Latin America

        12.2.2. By Product Type

        12.2.3. By Flavor

        12.2.4. By Nature

        12.2.5. By Packaging

        12.2.6. By Sales Channel

    12.3. Market Attractiveness Analysis

        12.3.1. By Country

        12.3.2. By Product Type

        12.3.3. By Flavor

        12.3.4. By Nature

        12.3.5. By Packaging

        12.3.6. By Sales Channel

    12.4. Key Takeaways

13. Europe Market Analysis 2017 to 2021 and Forecast 2022 to 2032, By Country

    13.1. Historical Market Size Value (US$ Million) & Volume (MT) Trend Analysis By Market Taxonomy, 2017 to 2021

    13.2. Market Size Value (US$ Million) & Volume (MT) Forecast By Market Taxonomy, 2022 to 2032

        13.2.1. By Country

            13.2.1.1. Germany

            13.2.1.2. Italy

            13.2.1.3. France

            13.2.1.4. United Kingdom

            13.2.1.5. Spain

            13.2.1.6. BENELUX

            13.2.1.7. Russia

            13.2.1.8. Rest of Europe

        13.2.2. By Product Type

        13.2.3. By Flavour

        13.2.4. By Nature

        13.2.5. By Packaging

        13.2.6. By Sales Channel

    13.3. Market Attractiveness Analysis

        13.3.1. By Country

        13.3.2. By Product Type

        13.3.3. By Flavour

        13.3.4. By Nature

        13.3.5. By Packaging

        13.3.6. By Sales Channel

    13.4. Key Takeaways

14. East Asia Market Analysis 2017 to 2021 and Forecast 2022 to 2032, By Country

    14.1. Historical Market Size Value (US$ Million) & Volume (MT) Trend Analysis By Market Taxonomy, 2017 to 2021

    14.2. Market Size Value (US$ Million) & Volume (MT) Forecast By Market Taxonomy, 2022 to 2032

        14.2.1. By Country

            14.2.1.1. China

            14.2.1.2. Japan

            14.2.1.3. South Korea

        14.2.2. By Product Type

        14.2.3. By Flavour

        14.2.4. By Nature

        14.2.5. By Packaging

        14.2.6. By Sales Channel

    14.3. Market Attractiveness Analysis

        14.3.1. By Country

        14.3.2. By Product Type

        14.3.3. By Flavour

        14.3.4. By Nature

        14.3.5. By Packaging

        14.3.6. By Sales Channel

    14.4. Key Takeaways

15. South Asia & Pacific Market Analysis 2017 to 2021 and Forecast 2022 to 2032, By Country

    15.1. Historical Market Size Value (US$ Million) & Volume (MT) Trend Analysis By Market Taxonomy, 2017 to 2021

    15.2. Market Size Value (US$ Million) & Volume (MT) Forecast By Market Taxonomy, 2022 to 2032

        15.2.1. By Country

            15.2.1.1. India

            15.2.1.2. ASEAN

            15.2.1.3. Australia and New Zealand

            15.2.1.4. Rest of South Asia & Pacific

        15.2.2. By Product Type

        15.2.3. By Flavour

        15.2.4. By Nature

        15.2.5. By Packaging

        15.2.6. By Sales Channel

    15.3. Market Attractiveness Analysis

        15.3.1. By Country

        15.3.2. By Product Type

        15.3.3. By Flavour

        15.3.4. By Nature

        15.3.5. By Packaging

        15.3.6. By Sales Channel

    15.4. Key Takeaways

16. Middle East and Africa Market Analysis 2017 to 2021 and Forecast 2022 to 2032, By Country

    16.1. Historical Market Size Value (US$ Million) & Volume (MT) Trend Analysis By Market Taxonomy, 2017 to 2021

    16.2. Market Size Value (US$ Million) & Volume (MT) Forecast By Market Taxonomy, 2022 to 2032

        16.2.1. By Country

            16.2.1.1. GCC Countries

            16.2.1.2. Turkey

            16.2.1.3. South Africa

            16.2.1.4. Rest of Middle East and Africa

        16.2.2. By Product Type

        16.2.3. By Flavour

        16.2.4. By Nature

        16.2.5. By Packaging

        16.2.6. By Sales Channel

    16.3. Market Attractiveness Analysis

        16.3.1. By Country

        16.3.2. By Product Type

        16.3.3. By Flavour

        16.3.4. By Nature

        16.3.5. By Packaging

        16.3.6. By Sales Channel

    16.4. Key Takeaways

17. Key Countries Market Analysis

    17.1. USA

        17.1.1. Pricing Analysis

        17.1.2. Market Share Analysis, 2021

            17.1.2.1. By Product Type

            17.1.2.2. By Flavour

            17.1.2.3. By Nature

            17.1.2.4. By Packaging

            17.1.2.5. By Sales Channel

    17.2. Canada

        17.2.1. Pricing Analysis

        17.2.2. Market Share Analysis, 2021

            17.2.2.1. By Product Type

            17.2.2.2. By Flavour

            17.2.2.3. By Nature

            17.2.2.4. By Packaging

            17.2.2.5. By Sales Channel

    17.3. Mexico

        17.3.1. Pricing Analysis

        17.3.2. Market Share Analysis, 2021

            17.3.2.1. By Product Type

            17.3.2.2. By Flavour

            17.3.2.3. By Nature

            17.3.2.4. By Packaging

            17.3.2.5. By Sales Channel

    17.4. Brazil

        17.4.1. Pricing Analysis

        17.4.2. Market Share Analysis, 2021

            17.4.2.1. By Product Type

            17.4.2.2. By Flavour

            17.4.2.3. By Nature

            17.4.2.4. By Packaging

            17.4.2.5. By Sales Channel

    17.5. Germany

        17.5.1. Pricing Analysis

        17.5.2. Market Share Analysis, 2021

            17.5.2.1. By Product Type

            17.5.2.2. By Flavour

            17.5.2.3. By Nature

            17.5.2.4. By Packaging

            17.5.2.5. By Sales Channel

    17.6. Italy

        17.6.1. Pricing Analysis

        17.6.2. Market Share Analysis, 2021

            17.6.2.1. By Product Type

            17.6.2.2. By Flavour

            17.6.2.3. By Nature

            17.6.2.4. By Packaging

            17.6.2.5. By Sales Channel

    17.7. France

        17.7.1. Pricing Analysis

        17.7.2. Market Share Analysis, 2021

            17.7.2.1. By Product Type

            17.7.2.2. By Flavour

            17.7.2.3. By Nature

            17.7.2.4. By Packaging

            17.7.2.5. By Sales Channel

    17.8. United Kingdom

        17.8.1. Pricing Analysis

        17.8.2. Market Share Analysis, 2021

            17.8.2.1. By Product Type

            17.8.2.2. By Flavour

            17.8.2.3. By Nature

            17.8.2.4. By Packaging

            17.8.2.5. By Sales Channel

    17.9. Spain

        17.9.1. Pricing Analysis

        17.9.2. Market Share Analysis, 2021

            17.9.2.1. By Product Type

            17.9.2.2. By Flavour

            17.9.2.3. By Nature

            17.9.2.4. By Packaging

            17.9.2.5. By Sales Channel

    17.10. BENELUX

        17.10.1. Pricing Analysis

        17.10.2. Market Share Analysis, 2021

            17.10.2.1. By Product Type

            17.10.2.2. By Flavour

            17.10.2.3. By Nature

            17.10.2.4. By Packaging

            17.10.2.5. By Sales Channel

    17.11. Russia

        17.11.1. Pricing Analysis

        17.11.2. Market Share Analysis, 2021

            17.11.2.1. By Product Type

            17.11.2.2. By Flavour

            17.11.2.3. By Nature

            17.11.2.4. By Packaging

            17.11.2.5. By Sales Channel

    17.12. China

        17.12.1. Pricing Analysis

        17.12.2. Market Share Analysis, 2021

            17.12.2.1. By Product Type

            17.12.2.2. By Flavour

            17.12.2.3. By Nature

            17.12.2.4. By Packaging

            17.12.2.5. By Sales Channel

    17.13. Japan

        17.13.1. Pricing Analysis

        17.13.2. Market Share Analysis, 2021

            17.13.2.1. By Product Type

            17.13.2.2. By Flavour

            17.13.2.3. By Nature

            17.13.2.4. By Packaging

            17.13.2.5. By Sales Channel

    17.14. South Korea

        17.14.1. Pricing Analysis

        17.14.2. Market Share Analysis, 2021

            17.14.2.1. By Product Type

            17.14.2.2. By Flavour

            17.14.2.3. By Nature

            17.14.2.4. By Packaging

            17.14.2.5. By Sales Channel

    17.15. India

        17.15.1. Pricing Analysis

        17.15.2. Market Share Analysis, 2021

            17.15.2.1. By Product Type

            17.15.2.2. By Flavour

            17.15.2.3. By Nature

            17.15.2.4. By Packaging

            17.15.2.5. By Sales Channel

    17.16. ASIAN

        17.16.1. Pricing Analysis

        17.16.2. Market Share Analysis, 2021

            17.16.2.1. By Product Type

            17.16.2.2. By Flavour

            17.16.2.3. By Nature

            17.16.2.4. By Packaging

            17.16.2.5. By Sales Channel

    17.17. Australia and New Zealand

        17.17.1. Pricing Analysis

        17.17.2. Market Share Analysis, 2021

            17.17.2.1. By Product Type

            17.17.2.2. By Flavour

            17.17.2.3. By Nature

            17.17.2.4. By Packaging

            17.17.2.5. By Sales Channel

    17.18. GCC Countries

        17.18.1. Pricing Analysis

        17.18.2. Market Share Analysis, 2021

            17.18.2.1. By Product Type

            17.18.2.2. By Flavour

            17.18.2.3. By Nature

            17.18.2.4. By Packaging

            17.18.2.5. By Sales Channel

    17.19. Turkey

        17.19.1. Pricing Analysis

        17.19.2. Market Share Analysis, 2021

            17.19.2.1. By Product Type

            17.19.2.2. By Flavour

            17.19.2.3. By Nature

            17.19.2.4. By Packaging

            17.19.2.5. By Sales Channel

    17.20. South Africa

        17.20.1. Pricing Analysis

        17.20.2. Market Share Analysis, 2021

            17.20.2.1. By Product Type

            17.20.2.2. By Flavour

            17.20.2.3. By Nature

            17.20.2.4. By Packaging

            17.20.2.5. By Sales Channel

18. Market Structure Analysis

    18.1. Competition Dashboard

    18.2. Competition Benchmarking

    18.3. Market Share Analysis of Top Players

        18.3.1. By Regional

        18.3.2. By Product Type

        18.3.3. By Flavour

        18.3.4. By Nature

        18.3.5. By Packaging

        18.3.6. By Sales Channel

19. Competition Analysis

    19.1. Competition Deep Dive

        19.1.1. Unilever PLC

            19.1.1.1. Overview

            19.1.1.2. Product Portfolio

            19.1.1.3. Profitability by Market Segments

            19.1.1.4. Sales Footprint

            19.1.1.5. Strategy Overview

                19.1.1.5.1. Marketing Strategy

                19.1.1.5.2. Product Strategy

                19.1.1.5.3. Channel Strategy

        19.1.2. The Republic of Tea

            19.1.2.1. Overview

            19.1.2.2. Product Portfolio

            19.1.2.3. Profitability by Market Segments

            19.1.2.4. Sales Footprint

            19.1.2.5. Strategy Overview

                19.1.2.5.1. Marketing Strategy

                19.1.2.5.2. Product Strategy

                19.1.2.5.3. Channel Strategy

        19.1.3. 21ST Century HealthCare, Inc

            19.1.3.1. Overview

            19.1.3.2. Product Portfolio

            19.1.3.3. Profitability by Market Segments

            19.1.3.4. Sales Footprint

            19.1.3.5. Strategy Overview

                19.1.3.5.1. Marketing Strategy

                19.1.3.5.2. Product Strategy

                19.1.3.5.3. Channel Strategy

        19.1.4. Xie's Import & Export cc (Closemeyer)

            19.1.4.1. Overview

            19.1.4.2. Product Portfolio

            19.1.4.3. Profitability by Market Segments

            19.1.4.4. Sales Footprint

            19.1.4.5. Strategy Overview

                19.1.4.5.1. Marketing Strategy

                19.1.4.5.2. Product Strategy

                19.1.4.5.3. Channel Strategy

        19.1.5. Mustika Ratu

            19.1.5.1. Overview

            19.1.5.2. Product Portfolio

            19.1.5.3. Profitability by Market Segments

            19.1.5.4. Sales Footprint

            19.1.5.5. Strategy Overview

                19.1.5.5.1. Marketing Strategy

                19.1.5.5.2. Product Strategy

                19.1.5.5.3. Channel Strategy

        19.1.6. Fit Tea

            19.1.6.1. Overview

            19.1.6.2. Product Portfolio

            19.1.6.3. Profitability by Market Segments

            19.1.6.4. Sales Footprint

            19.1.6.5. Strategy Overview

                19.1.6.5.1. Marketing Strategy

                19.1.6.5.2. Product Strategy

                19.1.6.5.3. Channel Strategy

        19.1.7. Diet Coaching Inc.

            19.1.7.1. Overview

            19.1.7.2. Product Portfolio

            19.1.7.3. Profitability by Market Segments

            19.1.7.4. Sales Footprint

            19.1.7.5. Strategy Overview

                19.1.7.5.1. Marketing Strategy

                19.1.7.5.2. Product Strategy

                19.1.7.5.3. Channel Strategy

        19.1.8. Badia Spices Inc.

            19.1.8.1. Overview

            19.1.8.2. Product Portfolio

            19.1.8.3. Profitability by Market Segments

            19.1.8.4. Sales Footprint

            19.1.8.5. Strategy Overview

                19.1.8.5.1. Marketing Strategy

                19.1.8.5.2. Product Strategy

                19.1.8.5.3. Channel Strategy

        19.1.9. Vita-Aid

            19.1.9.1. Overview

            19.1.9.2. Product Portfolio

            19.1.9.3. Profitability by Market Segments

            19.1.9.4. Sales Footprint

            19.1.9.5. Strategy Overview

                19.1.9.5.1. Marketing Strategy

                19.1.9.5.2. Product Strategy

                19.1.9.5.3. Channel Strategy

        19.1.10. Jiva Ayurveda

            19.1.10.1. Overview

            19.1.10.2. Product Portfolio

            19.1.10.3. Profitability by Market Segments

            19.1.10.4. Sales Footprint

            19.1.10.5. Strategy Overview

                19.1.10.5.1. Marketing Strategy

                19.1.10.5.2. Product Strategy

                19.1.10.5.3. Channel Strategy

        19.1.11. Royal Herbal

            19.1.11.1. Overview

            19.1.11.2. Product Portfolio

            19.1.11.3. Profitability by Market Segments

            19.1.11.4. Sales Footprint

            19.1.11.5. Strategy Overview

                19.1.11.5.1. Marketing Strategy

                19.1.11.5.2. Product Strategy

                19.1.11.5.3. Channel Strategy

        19.1.12. Valverbe Soc.

            19.1.12.1. Overview

            19.1.12.2. Product Portfolio

            19.1.12.3. Profitability by Market Segments

            19.1.12.4. Sales Footprint

            19.1.12.5. Strategy Overview

                19.1.12.5.1. Marketing Strategy

                19.1.12.5.2. Product Strategy

                19.1.12.5.3. Channel Strategy

        19.1.13. Gaia Herbs, LLC

            19.1.13.1. Overview

            19.1.13.2. Product Portfolio

            19.1.13.3. Profitability by Market Segments

            19.1.13.4. Sales Footprint

            19.1.13.5. Strategy Overview

                19.1.13.5.1. Marketing Strategy

                19.1.13.5.2. Product Strategy

                19.1.13.5.3. Channel Strategy

20. Assumptions & Acronyms Used

21. Research Methodology
Recommendations

Food and Beverage

Iced Tea Market

July 2020

REP-GB-832

March 2024

306 pages

Food and Beverage

Herbal Tea Market

December 2016

REP-GB-2513

July 2023

333 pages

Food and Beverage

Kombucha Tea Market

March 2022

REP-GB-14413

May 2023

333 pages

Food and Beverage

Organic Tea Market

March 2022

REP-GB-14375

May 2023

306 pages

Explore Food and Beverage Insights

View Reports