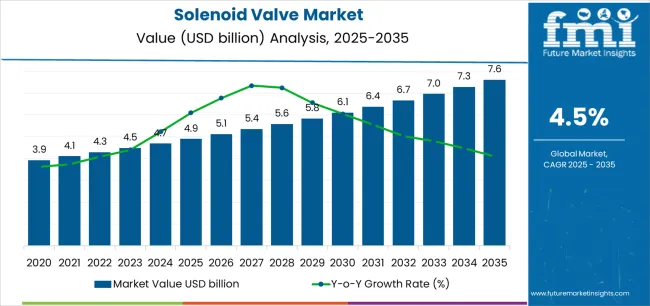
The solenoid valve market stands at the threshold of a decade-long expansion trajectory that promises to reshape automated fluid control technology and process optimization solutions. The market's journey from USD 4.9 billion in 2025 to USD 7.5 billion by 2035 represents substantial growth, demonstrating the accelerating adoption of advanced electromechanical actuation systems and precision flow control across industrial processes, water treatment facilities, and manufacturing operations.
The first half of the decade (2025-2030) will witness the market climbing from USD 4.9 billion to approximately USD 6.1 billion, adding USD 1.2 billion in value, which constitutes 46% of the total forecast growth period. This phase will be characterized by the rapid adoption of direct-acting solenoid valve systems, driven by increasing industrial automation requirements and the growing need for reliable on-off control solutions worldwide. Enhanced energy efficiency capabilities and diagnostic integration features will become standard expectations rather than premium options.
The latter half (2030-2035) will witness continued growth from USD 6.1 billion to USD 7.5 billion, representing an addition of USD 1.4 billion or 54% of the decade's expansion. This period will be defined by mass market penetration of IIoT-enabled smart valves, integration with comprehensive process control platforms, and seamless compatibility with Industry 4.0 infrastructure. The market trajectory signals fundamental shifts in how industrial facilities approach flow control and system automation, with participants positioned to benefit from growing demand across multiple material types and operation configurations.
| Period | Primary Revenue Buckets | Share | Notes |
|---|---|---|---|
| Today | New valve sales (process industries, water) | 52% | Capital projects, greenfield facilities |
| OEM equipment integration | 22% | Machine builders, system integrators | |
| Replacement & retrofit installations | 16% | Brownfield upgrades, maintenance replacement | |
| Spare parts (coils, seals, diaphragms) | 7% | Aftermarket service, repair components | |
| Engineering & commissioning services | 3% | System specification, installation support | |
| Future (3-5 yrs) | Smart/IIoT-enabled valve systems | 32-36% | Predictive maintenance, remote monitoring |
| Process automation upgrades | 22-26% | Industry 4.0 retrofits, digital transformation | |
| OEM integration | 18-22% | Equipment manufacturing, system packaging | |
| Standard replacement valves | 12-16% | Maintenance cycles, legacy system support | |
| Hygienic & specialty applications | 8-10% | Pharma, food processing, medical devices | |
| Service & lifecycle management | 4-6% | Predictive coil replacement, diagnostic services |
| Metric | Value |
|---|---|
| Market Value (2025) | USD 4.9 billion |
| Market Forecast (2035) | USD 7.5 billion |
| Growth Rate | 4.5% CAGR |
| Leading Technology | Direct-acting |
| Primary Application | Oil & Gas/Chemicals Segment |
The market demonstrates strong fundamentals with direct-acting solenoid valves capturing dominant share through proven reliability capabilities and process industry optimization. Oil and gas and chemicals applications drive primary demand, supported by increasing process automation requirements and safety system integration. Geographic expansion remains concentrated in developed markets with established industrial infrastructure, while emerging economies show accelerating adoption rates driven by manufacturing expansion initiatives and rising automation standards.
Primary Classification: The market segments by type into direct-acting and pilot-operated solenoid valves, representing the evolution from simple on-off control to sophisticated high-flow actuation solutions for comprehensive process management optimization.
Secondary Classification: Function segmentation divides the market into 2-way, 3-way, 4-way, and 5-way valve configurations, reflecting distinct requirements for flow direction control, mixing applications, and pneumatic circuit management standards.
Tertiary Classification: Material segmentation covers stainless steel, brass/bronze, engineering plastics, and aluminum and other materials, while operation classification spans normally closed (NC), normally open (NO), and universal/bistable configurations, and industry applications include oil and gas/chemicals, water and wastewater, food and beverage, power generation, pharma/medical, and automotive and other manufacturing sectors.
Regional Classification: Geographic distribution covers North America, Latin America, Western Europe, Eastern Europe, East Asia, South Asia Pacific, and Middle East & Africa, with developed markets leading installations while emerging economies show accelerating growth patterns driven by industrialization expansion programs.
The segmentation structure reveals technology progression from basic electromechanical actuation toward sophisticated smart valve systems with enhanced diagnostics and energy efficiency capabilities, while application diversity spans from chemical processing to water treatment requiring reliable automated flow control solutions.
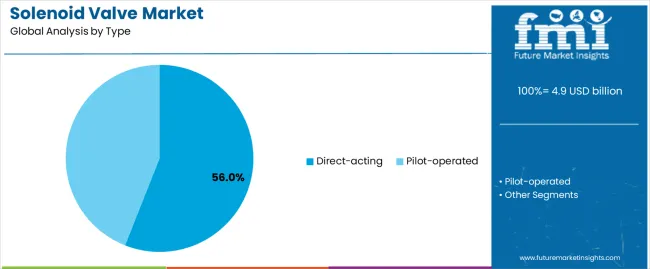
Market Position: Direct-acting solenoid valves command the leading position in the solenoid valve market with 56% market share through proven simplicity features, including reliable operation, compact design, and process industry optimization that enable facility operators to achieve dependable on-off control across diverse water treatment, chemical processing, and manufacturing environments.
Value Drivers: The segment benefits from facility preference for straightforward valve systems that provide fast response times, simple maintenance requirements, and operational reliability without requiring pilot pressure or complex internal mechanisms. Advanced design features enable low-pressure operation capability, compact installation footprints, and integration with standard control systems, where simplicity and proven performance represent critical specification requirements.
Competitive Advantages: Direct-acting solenoid valve systems differentiate through proven field reliability, lower cost structures for small port sizes, and compatibility with comprehensive automation strategies that enhance process effectiveness while maintaining optimal simplicity suitable for diverse industrial and commercial applications.
Key market characteristics:
Pilot-operated solenoid valves maintain a 44% market position in the solenoid valve market due to their high-flow handling capabilities and large port size advantages. These valves appeal to facilities requiring substantial flow capacity with relatively small actuator sizes for high-pressure applications. Market strength is driven by oil and gas expansion and large-capacity water systems, emphasizing efficient flow control solutions through pilot pressure mechanisms.
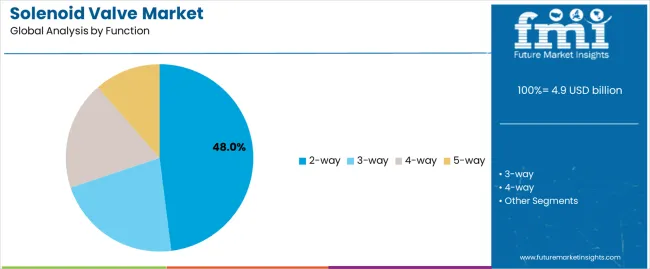
Market Context: 2-way solenoid valves demonstrate the dominant market position in the solenoid valve market with 48% market share due to widespread adoption of simple on-off control and increasing focus on isolation duty, shut-off applications, and direct flow management that maximizes operational simplicity while maintaining process reliability standards.
Appeal Factors: 2-way valve users prioritize straightforward flow control, single inlet/outlet simplicity, and compatibility with basic automation that enable effective shut-off operations across single-circuit applications. The segment benefits from substantial industrial investment and automation programs that emphasize the deployment of simple valve configurations for on-off duty and isolation applications.
Growth Drivers: Process automation programs incorporate 2-way solenoid valves as fundamental control elements for isolation and shut-off, while water treatment expansion increases demand for reliable on-off capabilities that comply with system requirements and minimize control complexity.
Market Challenges: Multi-directional flow requirements and mixing applications necessitate more complex valve configurations beyond simple 2-way capability.
Application dynamics include:
3-way solenoid valves capture 27% market share through mixing, diverting, and two-circuit control requirements in HVAC, process heating, and fluid distribution systems. 4-way valves hold 18% market share, while 5-way valves account for 7% through pneumatic cylinder control and compressed air circuit applications.
Market Position: Stainless steel valves command dominant market position with 46% market share through superior corrosion resistance and chemical compatibility advantages.
Value Drivers: This material provides the fundamental durability requirements for aggressive media, high-purity applications, and corrosive environments, meeting needs for chemical processing, food and beverage sanitation, and pharmaceutical production without material degradation.
Growth Characteristics: The segment benefits from strict hygienic standards, corrosion resistance requirements, and premium application specifications that support stainless steel selection and long service life expectations.
Brass/bronze valves capture 28% market share through general water service, HVAC applications, and cost-sensitive installations. Engineering plastics hold 17% share, while aluminum and other materials account for 9% through specialized lightweight and alternative material requirements.
Market Context: Normally Closed (NC) solenoid valves dominate the market with 64% market share, reflecting the preference for fail-safe shut-off and energy-efficient default positions.
Business Model Advantages: NC operation provides safety advantages through automatic shut-off during power failure, minimizing energy consumption during closed periods, and fail-safe positioning for most process applications requiring default isolation.
Operational Benefits: NC valves include water shut-off, chemical dosing control, and safety isolation applications where closed position represents the safe state and power-to-open configuration matches operational requirements.
Normally Open (NO) valves capture 22% market share through applications requiring default flow passage and fail-open safety requirements. Universal/bistable valves hold 14% market share through energy-saving latching designs and position-independent installation requirements.
Market Position: Oil and gas and chemicals industries command dominant position with 28% market share through extensive process automation and safety system requirements.
Value Drivers: These industries provide fundamental demand for automated flow control in refineries, chemical plants, and petrochemical facilities where safety-critical isolation, process sequencing, and hazardous location approvals drive consistent solenoid valve procurement.
Growth Characteristics: The segment benefits from complex process requirements, safety instrumented systems, and hazardous area certifications supporting premium valve specifications and rigorous performance standards.
Water and wastewater applications capture 22% market share through municipal utilities, treatment plants, and irrigation systems requiring reliable flow control. Food and beverage holds 16%, power generation accounts for 11%, pharma/medical represents 9%, while automotive and other manufacturing maintain 14% of the market.
| Category | Factor | Impact | Why It Matters |
|---|---|---|---|
| Driver | Industrial automation & Industry 4.0 adoption (smart manufacturing, IIoT integration, predictive maintenance) | ★★★★★ | Factory digitization driving intelligent valve deployment; IIoT-enabled solenoid valves with diagnostic coils and fieldbus communication enabling predictive maintenance and reducing unplanned downtime. |
| Driver | Water infrastructure investment & treatment capacity expansion (municipal systems, wastewater plants, irrigation automation) | ★★★★★ | Aging water infrastructure requiring modernization; treatment plant automation and smart water networks driving solenoid valve demand for reliable, energy-efficient flow control across utilities. |
| Driver | Process safety regulations & SIL requirements (functional safety standards, hazardous location compliance, emergency shutdown systems) | ★★★★☆ | Safety instrumented systems mandating certified valves; SIL-rated solenoid valves becoming essential in oil/gas and chemicals for regulatory compliance and risk mitigation. |
| Restraint | Competition from alternative actuation technologies (pneumatic actuators, motor-operated valves, proportional control) | ★★★☆☆ | Electric actuators and smart positioners gaining share; solenoid valves facing competition in proportional control and large valve applications despite on-off duty advantages. |
| Restraint | Maintenance requirements & coil burnout concerns (dirt sensitivity, voltage fluctuations, thermal failures) | ★★★☆☆ | Coil failures and media contamination requiring regular maintenance; operators concerned about reliability in demanding applications despite improved designs and materials. |
| Trend | Smart valves with diagnostic capabilities (embedded sensors, fieldbus connectivity, health monitoring, energy tracking) | ★★★★★ | Digital transformation driving intelligent valve adoption; integrated diagnostics enabling condition-based maintenance, energy optimization, and system integration with plant SCADA and MES platforms. |
| Trend | Energy-efficient & low-power designs (latching coils, holding-current reduction, energy-optimized electromagnets) | ★★★★☆ | Sustainability goals and energy costs driving efficiency focus; low-power solenoid valves reducing facility energy consumption while enabling battery-powered and solar applications in remote installations. |
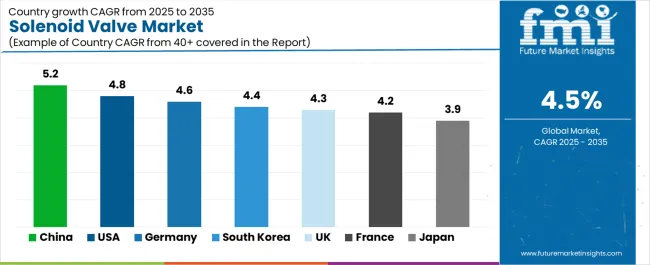
The solenoid valve market demonstrates varied regional dynamics with Growth Leaders including China (5.2% growth rate) and United States (4.8% growth rate) driving expansion through industrial capacity initiatives and automation upgrade development. Steady Performers encompass Germany (4.6% growth rate), South Korea (4.4% growth rate), and United Kingdom (4.3% growth rate), benefiting from established process industries and advanced manufacturing adoption. Developed Markets feature France (4.2% growth rate) and Japan (3.9% growth rate), where infrastructure modernization and energy efficiency support consistent growth patterns.
Regional synthesis reveals East Asian markets leading adoption through greenfield process capacity and water treatment expansion, while North American countries maintain strong growth supported by brownfield automation and smart valve technology advancement. European markets show steady growth driven by Industry 4.0 retrofits and hygienic valve integration trends.
| Region/Country | 2025-2035 Growth | How to win | What to watch out |
|---|---|---|---|
| China | 5.2% | Focus on IIoT-ready platforms | Local competition; price pressure |
| United States | 4.8% | Lead with smart/predictive tech | Long replacement cycles; budget constraints |
| Germany | 4.6% | Push Industry 4.0 integration | Conservative adoption; over-engineering |
| South Korea | 4.4% | Semiconductor cleanroom expertise | Export dependency; economic cycles |
| United Kingdom | 4.3% | Offshore energy solutions | Brexit logistics; skills shortage |
| France | 4.2% | Nuclear-grade certifications | Lengthy qualification; bureaucracy |
| Japan | 3.9% | Compact energy-saving designs | Shrinking industrial base; deflation |
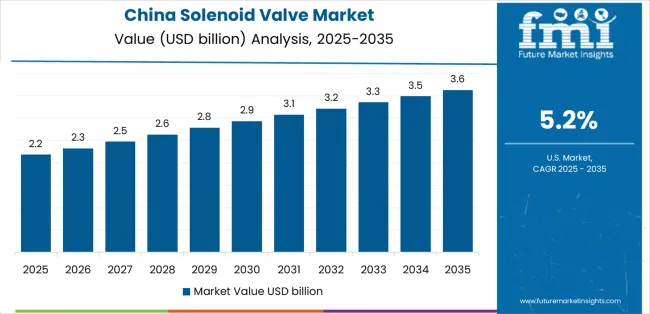
China establishes fastest market growth through aggressive industrial expansion programs and comprehensive water infrastructure development, integrating solenoid valves as standard components in chemical plants and municipal treatment installations. The country's 5.2% growth rate reflects government initiatives promoting industrial modernization and environmental protection that mandate the use of automated control systems in process and water facilities. Growth concentrates in major industrial regions, including Jiangsu chemical clusters, Guangdong manufacturing zones, and nationwide water treatment projects, where infrastructure development showcases expanding automation adoption that appeals to facility operators seeking reliable flow control and system efficiency.
Chinese industrial markets are adopting solenoid valve technology through increasing process automation and IIoT integration programs that combine domestic manufacturing advantages with improving quality standards, including process control valves and water treatment systems. Distribution channels through automation distributors and system integrators expand market access, while government environmental compliance and smart manufacturing initiatives support adoption across diverse industrial and municipal segments.
Strategic Market Indicators:
United States establishes market leadership through comprehensive brownfield upgrade programs and emerging smart valve technology adoption, integrating solenoid valves across aging infrastructure modernization and process optimization. The country's 4.8% growth rate reflects established industrial base and mature automation market that supports widespread solenoid valve upgrades in water utilities, power plants, and chemical facilities. Demand concentrates in infrastructure rehabilitation projects, industrial automation upgrades, and municipal water systems, where facility modernization showcases retrofit valve deployment that appeals to operators seeking improved reliability and diagnostic capabilities.
American industrial markets leverage established automation ecosystems and comprehensive safety regulations, including hazardous location certifications and functional safety requirements that maintain solenoid valve specifications. The market benefits from infrastructure investment programs and Industry 4.0 adoption that support brownfield automation and smart valve service models offering predictive coil replacement.
Market Intelligence Brief:
In Bavaria manufacturing clusters, North Rhine-Westphalia chemical parks, and nationwide industrial facilities, process operators are implementing advanced solenoid valves as smart components for digital transformation and hygienic processing applications, driven by Industry 4.0 initiatives and food/pharma quality standards that emphasize the importance of intelligent flow control. The market holds a 4.6% growth rate, supported by manufacturing modernization and stringent hygienic requirements that promote IIoT-enabled solenoid systems for industrial and processing facilities. German operators are deploying valve systems that provide diagnostic capabilities and sanitary design features, particularly appealing in advanced manufacturing regions where predictive maintenance and food safety represent critical operational requirements.
Market expansion benefits from substantial Industry 4.0 investment and comprehensive hygiene regulations that require intelligent and sanitary valve solutions. Technology adoption follows patterns established in automation equipment, where connectivity and quality compliance drive procurement decisions and facility-wide deployment.
Market Intelligence Brief:
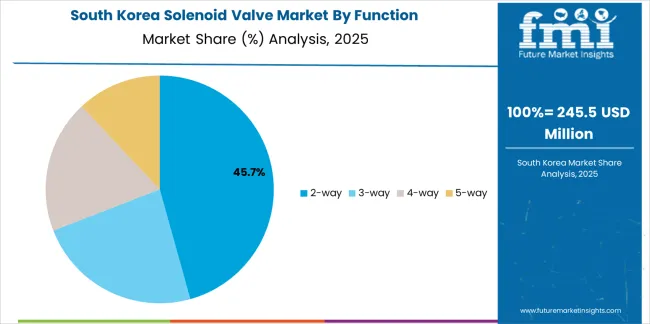
In Samsung semiconductor fabs, Hynix cleanroom facilities, and EV battery manufacturing plants, industrial operators are implementing precision solenoid valves as critical components for process control and clean utility management applications, driven by technology infrastructure investment and strict contamination control that emphasize the importance of reliable flow control. The market holds a 4.4% growth rate, supported by semiconductor capacity expansion and EV supply chain development that promote high-purity solenoid systems for cleanroom and battery production facilities. Korean operators are deploying valve systems that provide contamination-free operation and precise flow control, particularly appealing in high-tech manufacturing regions where product quality and yield protection represent paramount operational requirements.
Market expansion benefits from substantial semiconductor and EV investment and comprehensive purity standards that require specialized valve solutions. Technology adoption follows patterns established in cleanroom equipment, where contamination control and reliability drive specification decisions and precision system deployment.
Market Intelligence Brief:
United Kingdom's utilities and energy sector demonstrates comprehensive solenoid valve deployment with emphasis on offshore platforms and onshore energy projects through established reliability requirements and efficient actuation needs. The country maintains a 4.3% growth rate, driven by energy infrastructure investment and water utilities modernization.
Market dynamics focus on hazardous location valves for oil and gas applications combined with municipal water system upgrades requiring reliable automation. Energy sector activity and utilities improvement create sustained opportunities for solenoid valve installation in process and distribution infrastructure.
Strategic Market Considerations:
France's nuclear power infrastructure demonstrates sophisticated solenoid valve deployment with emphasis on safety-critical applications and district energy systems through stringent regulatory requirements. The country maintains a 4.2% growth rate, driven by nuclear facility maintenance and energy infrastructure investment.
Market dynamics focus on nuclear-grade valve certifications meeting rigorous safety and quality standards combined with district heating and cooling system automation. Process safety culture and infrastructure programs create consistent demand for certified solenoid valves in energy and utility applications.
Strategic Market Considerations:
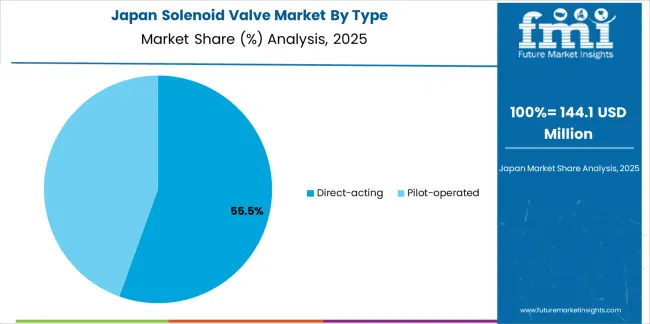
Japan's legacy industrial infrastructure demonstrates solenoid valve deployment with focus on energy-saving technology and compact designs through established quality culture and space constraints. The country maintains a 3.9% growth rate, driven by gradual plant modernization and efficiency improvement programs.
Market dynamics focus on compact, energy-efficient solenoid valves optimized for space-limited installations and power consumption reduction. Conservative upgrade cycles and quality expectations create sustained demand for premium solenoid valves supporting facility improvement and energy optimization.
Strategic Market Considerations:
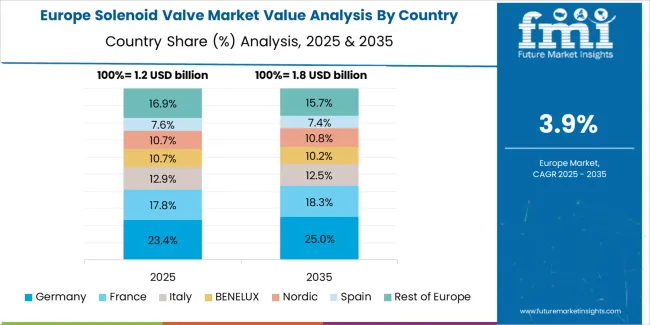
The solenoid valve market in Europe is projected to grow from USD 1.4 billion in 2025 to USD 2.2 billion by 2035, registering a CAGR of 4.6% over the forecast period. Germany is expected to lead with a 26.1% share in 2025, moderating to 25.6% by 2035 on steady upgrades in advanced manufacturing and hygienic processing.
France follows with an 18.7% share in 2025, edging to 19% by 2035 on investments in nuclear and water infrastructure. United Kingdom holds a 17.3% share in 2025, trending to 17.1% by 2035 with utilities modernization and offshore energy activity. Italy accounts for a 14.2% share in 2025, while Spain represents 11.7% in 2025, supported by food processing, pharmaceutical manufacturing, and water treatment programs. Rest of Europe collectively rises from 12% to 12.6% by 2035 as Nordics and Central/Eastern Europe accelerate smart valve and energy-efficient actuation adoption across industrial and utility applications.
| Stakeholder | What they actually control | Typical strengths | Typical blind spots |
|---|---|---|---|
| Global valve OEMs | Product development, global certification, distribution networks | Technology breadth, hazloc approvals, brand credibility | Local customization; application-specific expertise |
| Regional specialists | Local inventory, technical support, customer relationships | Application knowledge, responsive service, fast delivery | Technology innovation; global scale |
| Fluid power distributors | Stock availability, contractor relationships, working capital | Volume logistics, technical training, system integration | Manufacturing control; direct OEM access |
| OEM equipment integrators | Machine design, system packaging, end-user access | Application optimization, bundled value, customer lock-in | Valve technology depth; component sourcing flexibility |
| Smart valve innovators | IIoT platforms, diagnostic algorithms, predictive analytics | Digital differentiation, service revenue streams | Distribution reach; installed base scale |
| Item | Value |
|---|---|
| Quantitative Units | USD 4.9 billion |
| Type | Direct-acting, Pilot-operated |
| Function | 2-way, 3-way, 4-way, 5-way |
| Material | Stainless steel, Brass/bronze, Engineering plastics, Aluminum and others |
| Operation | Normally Closed (NC), Normally Open (NO), Universal/bistable |
| Industry | Oil & gas/chemicals, Water & wastewater, Food & beverage, Power generation, Pharma/medical, Automotive & other manufacturing |
| Regions Covered | North America, Latin America, Western Europe, Eastern Europe, East Asia, South Asia Pacific, Middle East & Africa |
| Countries Covered | United States, China, Germany, India, United Kingdom, Japan, South Korea, France, Canada, Brazil, Australia, and 25+ additional countries |
| Key Companies Profiled | Emerson (ASCO/Numatics), Parker Hannifin, Danfoss, Bürkert Fluid Control Systems, SMC Corporation, Festo, IMI Precision Engineering, Norgren, CKD Corporation, ODE S.r.l. |
| Additional Attributes | Dollar sales by type and industry categories, regional installation trends across East Asia, North America, and Western Europe, competitive landscape with valve manufacturers and fluid control suppliers, facility operator preferences for reliability and diagnostic capability, integration with automation systems and IIoT platforms, innovations in smart valve technology and energy efficiency, and development of hygienic and hazardous location solutions with enhanced performance and predictive maintenance optimization capabilities. |
The global solenoid valve market is estimated to be valued at USD 4.9 billion in 2025.
The market size for the solenoid valve market is projected to reach USD 7.6 billion by 2035.
The solenoid valve market is expected to grow at a 4.5% CAGR between 2025 and 2035.
The key product types in solenoid valve market are direct-acting and pilot-operated.
In terms of function, 2-way segment to command 48.0% share in the solenoid valve market in 2025.


Full Research Suite comprises of:
Market outlook & trends analysis
Interviews & case studies
Strategic recommendations
Vendor profiles & capabilities analysis
5-year forecasts
8 regions and 60+ country-level data splits
Market segment data splits
12 months of continuous data updates
DELIVERED AS:
PDF EXCEL ONLINE
Solenoid Valve Market Growth – Trends & Forecast 2024-2034
Automotive Solenoid Market
Valve Grinder Market Size and Share Forecast Outlook 2025 to 2035
Valve Seat Inserts Market Size and Share Forecast Outlook 2025 to 2035
Valve Driver Market Size and Share Forecast Outlook 2025 to 2035
Valve Remote Control Systems Market Analysis by Type, Application and Region - Forecast for 2025 to 2035
Valve Positioner Market Growth – Trends & Forecast (2024-2034)
Valve Cover Gasket Market
Valve Sack Market
ESD Valve Market Forecast and Outlook 2025 to 2035
EGR Valve Market
HVAC Valve Market Size and Share Forecast Outlook 2025 to 2035
Flat Valve Caps And Closures Market Size and Share Forecast Outlook 2025 to 2035
Gate Valve Market Growth – Trends & Forecast 2023-2033
Korea Valve Seat Insert Market Trend Analysis Based on Sales, Material, Engine, End-Use, and Provinces 2025 to 2035
Japan Valve Seat Inserts Market Trend Analysis Based on Sales Channel, Material, Engine, End-Use and Provinces 2025 to 2035
Lined Valve Market Growth – Trends & Forecast 2024-2034
Remote Valve Tissue Expanders Market Size and Share Forecast Outlook 2025 to 2035
Bag On Valve Product Market Size and Share Forecast Outlook 2025 to 2035
Engine Valve Market Size and Share Forecast Outlook 2025 to 2035

Thank you!
You will receive an email from our Business Development Manager. Please be sure to check your SPAM/JUNK folder too.
Chat With
MaRIA