Solid-State Array Market Size and Share Forecast Outlook 2025 to 2035

The Solid-State Array Market is estimated to be valued at USD 16.5 billion in 2025 and is projected to reach USD 66.6 billion by 2035, registering a compound annual growth rate (CAGR) of 15.0% over the forecast period.
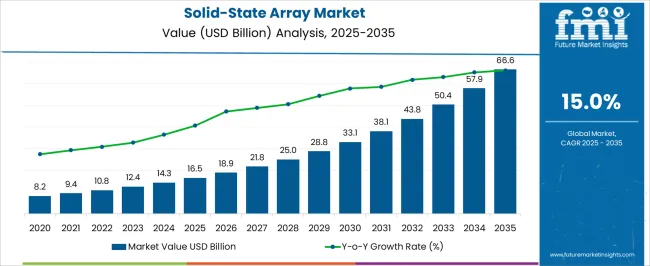
Quick Stats for Solid-State Array Market

  • Solid-State Array Market Industry Value (2025): USD 16.5 billion
  • Solid-State Array Market Forecast Value (2035): USD 66.6 billion
  • Solid-State Array Market Forecast CAGR: 15.0%
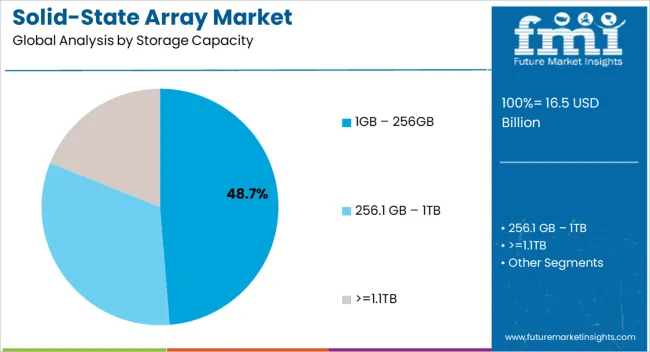
  • Leading Segment in Solid-State Array Market in 2025: 1GB – 256GB (48.7%)
  • Key Growth Region in Solid-State Array Market: North America, Asia-Pacific, Europe
  • Top Key Players in Solid-State Array Market: Fujitsu Ltd., IBM Corporation, Hitachi Data Systems, Hewlett Packard Enterprise, Huawei Technologies Co., Ltd., Kaminario, NetApp, Inc., Tegile Systems, Pure Storage, Tintri, Inc.

Solid State Array Market Market Value Analysis

Metric Value
Solid-State Array Market Estimated Value in (2025 E) USD 16.5 billion
Solid-State Array Market Forecast Value in (2035 F) USD 66.6 billion
Forecast CAGR (2025 to 2035) 15.0%

Rationale for Segmental Growth in the Solid State Array Market

The solid state array market is experiencing notable expansion as enterprises increasingly prioritize high performance storage solutions that ensure speed, reliability, and scalability. Growing data generation across industries including finance, healthcare, and telecommunications has intensified demand for solid state arrays due to their low latency and superior energy efficiency compared to traditional storage systems.

Advancements in flash memory technologies and declining costs of solid state storage are encouraging adoption across mid sized and large enterprises. In addition, the rising need for efficient data management to support artificial intelligence, machine learning, and big data analytics is further accelerating deployment.

Regulatory compliance requirements for data security and the need for uninterrupted business continuity are also contributing to market momentum. The outlook remains positive as enterprises shift toward cloud integration and hybrid IT environments, solidifying solid state arrays as a central component of modern storage infrastructure.
Segmental Analysis

Insights into the 1GB to 256GB Storage Capacity Segment

Solid State Array Market Analysis By Storage Capacity

The 1GB to 256GB storage capacity segment is projected to account for 48.70% of total market revenue by 2025 within the storage capacity category, making it the most prominent segment. This growth is driven by its suitability for diverse enterprise workloads requiring balanced performance and cost efficiency.

The segment supports applications ranging from operational databases to virtualized environments, providing the scalability needed for medium scale deployments. Its affordability and energy efficiency are making it the preferred choice for businesses seeking reliable storage without incurring the higher costs of larger capacity arrays.

The balance of performance, reliability, and affordability has reinforced the dominance of this segment in the overall market.
Insights into the Enterprise Application Segment

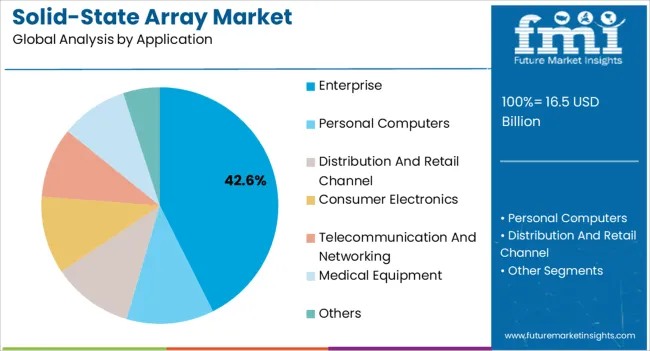
Solid State Array Market Analysis By Application

The enterprise application segment is expected to capture 42.60% of total market revenue by 2025 within the application category, positioning it as the leading segment. Growth is being driven by the rapid digitization of operations, increased reliance on data intensive applications, and the demand for secure and scalable storage infrastructure.

Enterprises are deploying solid state arrays to ensure low latency, high input output performance, and seamless integration with cloud platforms. The segment’s growth is further supported by ongoing investments in IT modernization and data center expansion initiatives.

With enterprises prioritizing resilience, scalability, and efficiency in their storage systems, this segment continues to dominate the market landscape.

Solid-State Array Market Historic Sales Compared to 2025-2035 Forecast Outlook

In the past years, the solid-state array market has demonstrated a positive sales trajectory of 13.6% between 2020 to 2025.

The solid-state array market witnessed robust sales growth from 2020 to 2025, driven by increasing demand for high-performance storage solutions. However, the forecast outlook for the period 2025 to 2035 indicates even stronger growth potential for the market.

Factors such as advancements in technology, expanding data storage needs, and the rising adoption of solid-state arrays in various industries are expected to fuel the market's growth during this forecast period. The market is projected to experience significant sales expansion, reflecting the increasing popularity and widespread adoption of solid-state arrays as a preferred storage solution.

What Factors are Holding a Sway over the Solid-State Array Market Dynamics?

Expanding need for data storage:

The growing demand for mass storage and storage devices is the major driver of the solid-state array market. Also, the high usage of solid-state arrays in data centers for high-performance computing and big data workloads is the major factor that is driving the growth of the solid-state array market.

Big data, cloud computing, and the Internet of Things (IoT) are also likely to scale up the sales of solid-state array to an extent.

The rise in acceptance of solid-state arrays:

Due to their advantages over conventional hard disc drives in terms of performance and reliability, solid-state arrays are growing in popularity (HDDs), in turn expanding the market size. They are used in a wide range of products, including storage systems, laptops, and business servers.

HDD to SSD transition:

Due to SSDs' falling prices, rising capacities, and better performance characteristics when compared to HDDs, the switch from HDD to SSD is quickening, expanding the overall solid-state array market size. On the flip side, the high design cost is expected to be the restraint in the growth of the solid-state array market.

Also, the low environmental stability and rapidly changing technology are some of the factors which may hinder the solid-state array market. Moreover, the lack of device interoperability may slow down the demand for solid-state array during the forecast period.

Solid-State Array Market - Country-wise Insight

How Will the Solid-State Array Expand Across the USA?

The United States has captured a substantial value share of 19.5% in the solid-state array market due to various factors. The country's technological advancements and innovation prowess have propelled it to the forefront of the industry. With a strong emphasis on research and development, the United States has fostered a favorable environment for the development and manufacturing of solid-state arrays.

Additionally, the country boasts a robust IT infrastructure, which facilitates the effective implementation and utilization of these storage solutions. The United States also benefits from a strong market demand driven by the increasing need for efficient and high-performance storage solutions in the era of data-driven applications. The presence of key players and a favorable business environment further contribute to the United States' significant market share, establishing it as a leading player in the solid-state array market.

The presence of leading players and continuous investments in research and development also contribute to the growth of the solid-state array market in the UK.

The United Kingdom (UK) is experiencing a notable compound annual growth rate (CAGR) of 15.1% in the solid-state array market due to several key factors. The country's strong emphasis on digital transformation across various industries, such as finance, healthcare, and manufacturing, is driving the demand for high-performance storage solutions like solid-state arrays. Furthermore, the UK's increasing focus on data-driven applications, such as artificial intelligence and big data analytics, necessitates efficient and reliable storage systems, making solid-state arrays a preferred choice.

India has emerged as a highly lucrative revenue belt for the solid-state array market, with a projected compound annual growth rate (CAGR) of 18.2% from 2025 to 2035.

Firstly, India is experiencing rapid digital transformation across various sectors, including IT, telecommunications, healthcare, and e-commerce. This transformation requires robust storage solutions to handle the increasing volume of data generated, stored, and processed by organizations. Solid-state arrays, with their high performance, reliability, and scalability, are well-suited to meet these demands.

The rise of smartphone usage, internet penetration, and e-commerce activities further drive the need for efficient and high-capacity storage solutions. Additionally, government initiatives such as "Digital India" and "Make in India" promote the adoption of advanced technologies, including solid-state arrays, to support the country's digital infrastructure and economic growth.

Furthermore, the presence of major technology companies, increasing investments in data centers, and the strong IT services industry in India contribute to the growth of the solid-state array market.

Solid-State Array Market - Category-wise Insights

The 1GB-256GB storage capacity range holds a significant share of 40.3% in the solid-state array market.

It offers a cost-effective solution for consumers and businesses. With a balance between storage space and affordability, this range appeals to a wide range of users. It caters to mainstream usage by providing ample storage for operating systems, applications, and personal data. This makes it suitable for everyday computing needs.

Additionally, solid-state arrays in this capacity range often exhibit optimized performance characteristics, including fast read and write speeds, low latency, and efficient data access. These features make them suitable for various applications, from consumer electronics to entry-level servers.

Lastly, the continuous advancements in technology within this capacity range have improved performance, reliability, and overall value, further contributing to its high market share.

Consumer electronics have a prominent share of 18.3% in the solid-state array market.

This is primarily due to the increasing demand for high-performance storage solutions in devices such as smartphones, tablets, laptops, gaming consoles, and portable media players. Solid-state arrays provide several advantages for consumer electronics, including faster data transfer speeds, improved energy efficiency, and enhanced durability compared to traditional hard disk drives. These benefits make them ideal for applications that require quick access to data, such as gaming, multimedia streaming, and multitasking. Furthermore, the decreasing cost of solid-state storage has made it more accessible to a wider range of consumers, further driving its adoption in consumer electronic devices. As a result, consumer electronics hold a substantial portion of the solid-state array market and continue to fuel its growth.
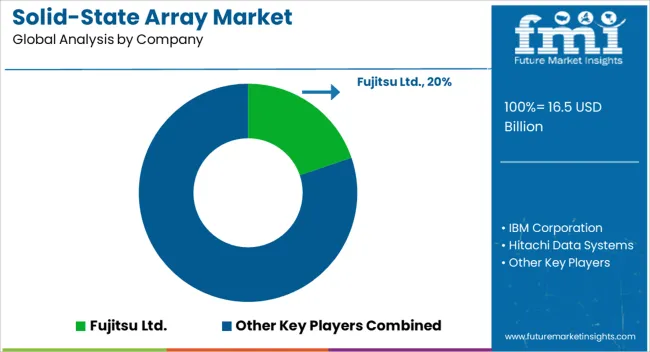
The competitive landscape of the solid-state array market is dynamic and characterized by several key players vying for market share. These players include established technology giants, niche storage vendors, and emerging startups. Some prominent companies

Solid State Array Market Analysis By Company

  • Dell Technologies: Dell Technologies offers a range of solid-state arrays with advanced features, high performance, and scalability. They cater to various industry verticals, including enterprise data centers and cloud service providers.
  • Hewlett Packard Enterprise (HPE): HPE offers solid-state arrays designed for enterprise workloads, emphasizing performance, reliability, and data management capabilities. Their offerings target a wide range of use cases, from small businesses to large enterprises.
  • IBM: IBM offers solid-state arrays that integrate with their broader storage portfolio and emphasize features such as data compression, deduplication, and encryption. Their solutions target enterprise customers with demanding workloads.
  • Pure Storage: Pure Storage focuses solely on solid-state arrays and is known for its all-flash storage solutions. They offer high-performance arrays with advanced data reduction and management features, targeting both enterprise and mid-market customers.
  • NetApp: NetApp provides solid-state arrays as part of its broader storage portfolio, delivering solutions for both traditional and cloud-native workloads. Their offerings emphasize data management, scalability, and hybrid cloud integration.
  • Hitachi Vantara: Hitachi Vantara offers solid-state arrays with advanced data services, including data deduplication, compression, and replication. They cater to various industries, such as finance, healthcare, and manufacturing.

Scope of Report

Attribute Details
Forecast Period 2025 to 2035
Historical Data Available for 2020 to 2025
Market Analysis USD Billion for Value
Key Countries Covered USA, Canada, Germany, U.K., France, Italy, Spain, Russia, China, Japan, South Korea, India, Thailand, Malaysia, Indonesia, Australia, New Zealand, GCC Countries, Turkey, Northern Africa, and South Africa
Key Segments Covered Storage Capacity, Application, Region
Key Companies Profiled Fujitsu Ltd.; IBM Corporation; Hitachi Data systems; Hewlett Packard Enterprise; Huawei Technologies Co., Ltd.; Kaminario; NetApp, Inc.; Tegile systems; Pure Storage; Tintri, Inc.
Report Coverage Market Forecast, Company Share Analysis, Competition Intelligence, DROT Analysis, Market Dynamics and Challenges, and Strategic Growth Initiatives
Customization & Pricing Available upon Request

Solid-State Array Market

By Storage Capacity:

  • 1GB – 256GB
  • 256.1 GB- 1TB
  • >=1.1TB

By Application:

  • Enterprise
  • Personal Computers
  • Distribution and Retail Channel
  • Consumer Electronics
  • Telecommunication and Networking
  • Medical Equipment
  • Others

By Region:

  • North America
  • Latin America
  • Europe
  • South Asia & Pacific
  • East Asia
  • Middle East & Africa (MEA)

Table of Content

  1. Executive Summary
    • Global Market Outlook
    • Demand-side Trends
    • Supply-side Trends
    • Technology Roadmap Analysis
    • Analysis and Recommendations
  2. Market Overview
    • Market Coverage / Taxonomy
    • Market Definition / Scope / Limitations
  3. Market Background
    • Market Dynamics
      • Drivers
      • Restraints
      • Opportunity
      • Trends
    • Scenario Forecast
      • Demand in Optimistic Scenario
      • Demand in Likely Scenario
      • Demand in Conservative Scenario
    • Opportunity Map Analysis
    • Product Life Cycle Analysis
    • Supply Chain Analysis
    • Investment Feasibility Matrix
    • Value Chain Analysis
    • PESTLE and Porter’s Analysis
    • Regulatory Landscape
    • Regional Parent Market Outlook
    • Production and Consumption Statistics
    • Import and Export Statistics
  4. Global Market Analysis 2020 to 2024 and Forecast, 2025 to 2035
    • Historical Market Size Value (USD Million) Analysis, 2020 to 2024
    • Current and Future Market Size Value (USD Million) Projections, 2025 to 2035
      • Y-o-Y Growth Trend Analysis
      • Absolute $ Opportunity Analysis
  5. Global Market Pricing Analysis 2020 to 2024 and Forecast 2025 to 2035
  6. Global Market Analysis 2020 to 2024 and Forecast 2025 to 2035, By Storage Capacity
    • Introduction / Key Findings
    • Historical Market Size Value (USD Million) Analysis By Storage Capacity , 2020 to 2024
    • Current and Future Market Size Value (USD Million) Analysis and Forecast By Storage Capacity , 2025 to 2035
      • 1GB - 256GB
      • 256.1 GB - 1TB
      • >=1.1TB
    • Y-o-Y Growth Trend Analysis By Storage Capacity , 2020 to 2024
    • Absolute $ Opportunity Analysis By Storage Capacity , 2025 to 2035
  7. Global Market Analysis 2020 to 2024 and Forecast 2025 to 2035, By Application
    • Introduction / Key Findings
    • Historical Market Size Value (USD Million) Analysis By Application, 2020 to 2024
    • Current and Future Market Size Value (USD Million) Analysis and Forecast By Application, 2025 to 2035
      • Enterprise
      • Personal Computers
      • Distribution And Retail Channel
      • Consumer Electronics
      • Telecommunication And Networking
      • Medical Equipment
      • Others
    • Y-o-Y Growth Trend Analysis By Application, 2020 to 2024
    • Absolute $ Opportunity Analysis By Application, 2025 to 2035
  8. Global Market Analysis 2020 to 2024 and Forecast 2025 to 2035, By Region
    • Introduction
    • Historical Market Size Value (USD Million) Analysis By Region, 2020 to 2024
    • Current Market Size Value (USD Million) Analysis and Forecast By Region, 2025 to 2035
      • North America
      • Latin America
      • Western Europe
      • Eastern Europe
      • East Asia
      • South Asia and Pacific
      • Middle East & Africa
    • Market Attractiveness Analysis By Region
  9. North America Market Analysis 2020 to 2024 and Forecast 2025 to 2035, By Country
    • Historical Market Size Value (USD Million) Trend Analysis By Market Taxonomy, 2020 to 2024
    • Market Size Value (USD Million) Forecast By Market Taxonomy, 2025 to 2035
      • By Country
        • USA
        • Canada
        • Mexico
      • By Storage Capacity
      • By Application
    • Market Attractiveness Analysis
      • By Country
      • By Storage Capacity
      • By Application
    • Key Takeaways
  10. Latin America Market Analysis 2020 to 2024 and Forecast 2025 to 2035, By Country
    • Historical Market Size Value (USD Million) Trend Analysis By Market Taxonomy, 2020 to 2024
    • Market Size Value (USD Million) Forecast By Market Taxonomy, 2025 to 2035
      • By Country
        • Brazil
        • Chile
        • Rest of Latin America
      • By Storage Capacity
      • By Application
    • Market Attractiveness Analysis
      • By Country
      • By Storage Capacity
      • By Application
    • Key Takeaways
  11. Western Europe Market Analysis 2020 to 2024 and Forecast 2025 to 2035, By Country
    • Historical Market Size Value (USD Million) Trend Analysis By Market Taxonomy, 2020 to 2024
    • Market Size Value (USD Million) Forecast By Market Taxonomy, 2025 to 2035
      • By Country
        • Germany
        • UK
        • Italy
        • Spain
        • France
        • Nordic
        • BENELUX
        • Rest of Western Europe
      • By Storage Capacity
      • By Application
    • Market Attractiveness Analysis
      • By Country
      • By Storage Capacity
      • By Application
    • Key Takeaways
  12. Eastern Europe Market Analysis 2020 to 2024 and Forecast 2025 to 2035, By Country
    • Historical Market Size Value (USD Million) Trend Analysis By Market Taxonomy, 2020 to 2024
    • Market Size Value (USD Million) Forecast By Market Taxonomy, 2025 to 2035
      • By Country
        • Russia
        • Poland
        • Hungary
        • Balkan & Baltic
        • Rest of Eastern Europe
      • By Storage Capacity
      • By Application
    • Market Attractiveness Analysis
      • By Country
      • By Storage Capacity
      • By Application
    • Key Takeaways
  13. East Asia Market Analysis 2020 to 2024 and Forecast 2025 to 2035, By Country
    • Historical Market Size Value (USD Million) Trend Analysis By Market Taxonomy, 2020 to 2024
    • Market Size Value (USD Million) Forecast By Market Taxonomy, 2025 to 2035
      • By Country
        • China
        • Japan
        • South Korea
      • By Storage Capacity
      • By Application
    • Market Attractiveness Analysis
      • By Country
      • By Storage Capacity
      • By Application
    • Key Takeaways
  14. South Asia and Pacific Market Analysis 2020 to 2024 and Forecast 2025 to 2035, By Country
    • Historical Market Size Value (USD Million) Trend Analysis By Market Taxonomy, 2020 to 2024
    • Market Size Value (USD Million) Forecast By Market Taxonomy, 2025 to 2035
      • By Country
        • India
        • ASEAN
        • Australia & New Zealand
        • Rest of South Asia and Pacific
      • By Storage Capacity
      • By Application
    • Market Attractiveness Analysis
      • By Country
      • By Storage Capacity
      • By Application
    • Key Takeaways
  15. Middle East & Africa Market Analysis 2020 to 2024 and Forecast 2025 to 2035, By Country
    • Historical Market Size Value (USD Million) Trend Analysis By Market Taxonomy, 2020 to 2024
    • Market Size Value (USD Million) Forecast By Market Taxonomy, 2025 to 2035
      • By Country
        • Kingdom of Saudi Arabia
        • Other GCC Countries
        • Turkiye
        • South Africa
        • Other African Union
        • Rest of Middle East & Africa
      • By Storage Capacity
      • By Application
    • Market Attractiveness Analysis
      • By Country
      • By Storage Capacity
      • By Application
    • Key Takeaways
  16. Key Countries Market Analysis
    • USA
      • Pricing Analysis
      • Market Share Analysis, 2024
        • By Storage Capacity
        • By Application
    • Canada
      • Pricing Analysis
      • Market Share Analysis, 2024
        • By Storage Capacity
        • By Application
    • Mexico
      • Pricing Analysis
      • Market Share Analysis, 2024
        • By Storage Capacity
        • By Application
    • Brazil
      • Pricing Analysis
      • Market Share Analysis, 2024
        • By Storage Capacity
        • By Application
    • Chile
      • Pricing Analysis
      • Market Share Analysis, 2024
        • By Storage Capacity
        • By Application
    • Germany
      • Pricing Analysis
      • Market Share Analysis, 2024
        • By Storage Capacity
        • By Application
    • UK
      • Pricing Analysis
      • Market Share Analysis, 2024
        • By Storage Capacity
        • By Application
    • Italy
      • Pricing Analysis
      • Market Share Analysis, 2024
        • By Storage Capacity
        • By Application
    • Spain
      • Pricing Analysis
      • Market Share Analysis, 2024
        • By Storage Capacity
        • By Application
    • France
      • Pricing Analysis
      • Market Share Analysis, 2024
        • By Storage Capacity
        • By Application
    • India
      • Pricing Analysis
      • Market Share Analysis, 2024
        • By Storage Capacity
        • By Application
    • ASEAN
      • Pricing Analysis
      • Market Share Analysis, 2024
        • By Storage Capacity
        • By Application
    • Australia & New Zealand
      • Pricing Analysis
      • Market Share Analysis, 2024
        • By Storage Capacity
        • By Application
    • China
      • Pricing Analysis
      • Market Share Analysis, 2024
        • By Storage Capacity
        • By Application
    • Japan
      • Pricing Analysis
      • Market Share Analysis, 2024
        • By Storage Capacity
        • By Application
    • South Korea
      • Pricing Analysis
      • Market Share Analysis, 2024
        • By Storage Capacity
        • By Application
    • Russia
      • Pricing Analysis
      • Market Share Analysis, 2024
        • By Storage Capacity
        • By Application
    • Poland
      • Pricing Analysis
      • Market Share Analysis, 2024
        • By Storage Capacity
        • By Application
    • Hungary
      • Pricing Analysis
      • Market Share Analysis, 2024
        • By Storage Capacity
        • By Application
    • Kingdom of Saudi Arabia
      • Pricing Analysis
      • Market Share Analysis, 2024
        • By Storage Capacity
        • By Application
    • Turkiye
      • Pricing Analysis
      • Market Share Analysis, 2024
        • By Storage Capacity
        • By Application
    • South Africa
      • Pricing Analysis
      • Market Share Analysis, 2024
        • By Storage Capacity
        • By Application
  17. Market Structure Analysis
    • Competition Dashboard
    • Competition Benchmarking
    • Market Share Analysis of Top Players
      • By Regional
      • By Storage Capacity
      • By Application
  18. Competition Analysis
    • Competition Deep Dive
      • Fujitsu Ltd.
        • Overview
        • Product Portfolio
        • Profitability by Market Segments (Product/Age /Sales Channel/Region)
        • Sales Footprint
        • Strategy Overview
          • Marketing Strategy
          • Product Strategy
          • Channel Strategy
      • IBM Corporation
      • Hitachi Data Systems
      • Hewlett Packard Enterprise
      • Huawei Technologies Co., Ltd.
      • Kaminario
      • NetApp, Inc.
      • Tegile Systems
      • Pure Storage
      • Tintri, Inc.
  19. Assumptions & Acronyms Used
  20. Research Methodology

List of Tables

  • Table 1: Global Market Value (USD Million) Forecast by Region, 2020-2035
  • Table 2: Global Market Value (USD Million) Forecast by Storage Capacity , 2020-2035
  • Table 3: Global Market Value (USD Million) Forecast by Application, 2020-2035
  • Table 4: North America Market Value (USD Million) Forecast by Country, 2020-2035
  • Table 5: North America Market Value (USD Million) Forecast by Storage Capacity , 2020-2035
  • Table 6: North America Market Value (USD Million) Forecast by Application, 2020-2035
  • Table 7: Latin America Market Value (USD Million) Forecast by Country, 2020-2035
  • Table 8: Latin America Market Value (USD Million) Forecast by Storage Capacity , 2020-2035
  • Table 9: Latin America Market Value (USD Million) Forecast by Application, 2020-2035
  • Table 10: Western Europe Market Value (USD Million) Forecast by Country, 2020-2035
  • Table 11: Western Europe Market Value (USD Million) Forecast by Storage Capacity , 2020-2035
  • Table 12: Western Europe Market Value (USD Million) Forecast by Application, 2020-2035
  • Table 13: Eastern Europe Market Value (USD Million) Forecast by Country, 2020-2035
  • Table 14: Eastern Europe Market Value (USD Million) Forecast by Storage Capacity , 2020-2035
  • Table 15: Eastern Europe Market Value (USD Million) Forecast by Application, 2020-2035
  • Table 16: East Asia Market Value (USD Million) Forecast by Country, 2020-2035
  • Table 17: East Asia Market Value (USD Million) Forecast by Storage Capacity , 2020-2035
  • Table 18: East Asia Market Value (USD Million) Forecast by Application, 2020-2035
  • Table 19: South Asia and Pacific Market Value (USD Million) Forecast by Country, 2020-2035
  • Table 20: South Asia and Pacific Market Value (USD Million) Forecast by Storage Capacity , 2020-2035
  • Table 21: South Asia and Pacific Market Value (USD Million) Forecast by Application, 2020-2035
  • Table 22: Middle East & Africa Market Value (USD Million) Forecast by Country, 2020-2035
  • Table 23: Middle East & Africa Market Value (USD Million) Forecast by Storage Capacity , 2020-2035
  • Table 24: Middle East & Africa Market Value (USD Million) Forecast by Application, 2020-2035

List of Figures

  • Figure 1: Global Market Pricing Analysis
  • Figure 2: Global Market Value (USD Million) Forecast 2020-2035
  • Figure 3: Global Market Value Share and BPS Analysis by Storage Capacity , 2025 and 2035
  • Figure 4: Global Market Y-o-Y Growth Comparison by Storage Capacity , 2025-2035
  • Figure 5: Global Market Attractiveness Analysis by Storage Capacity
  • Figure 6: Global Market Value Share and BPS Analysis by Application, 2025 and 2035
  • Figure 7: Global Market Y-o-Y Growth Comparison by Application, 2025-2035
  • Figure 8: Global Market Attractiveness Analysis by Application
  • Figure 9: Global Market Value (USD Million) Share and BPS Analysis by Region, 2025 and 2035
  • Figure 10: Global Market Y-o-Y Growth Comparison by Region, 2025-2035
  • Figure 11: Global Market Attractiveness Analysis by Region
  • Figure 12: North America Market Incremental Dollar Opportunity, 2025-2035
  • Figure 13: Latin America Market Incremental Dollar Opportunity, 2025-2035
  • Figure 14: Western Europe Market Incremental Dollar Opportunity, 2025-2035
  • Figure 15: Eastern Europe Market Incremental Dollar Opportunity, 2025-2035
  • Figure 16: East Asia Market Incremental Dollar Opportunity, 2025-2035
  • Figure 17: South Asia and Pacific Market Incremental Dollar Opportunity, 2025-2035
  • Figure 18: Middle East & Africa Market Incremental Dollar Opportunity, 2025-2035
  • Figure 19: North America Market Value Share and BPS Analysis by Country, 2025 and 2035
  • Figure 20: North America Market Value Share and BPS Analysis by Storage Capacity , 2025 and 2035
  • Figure 21: North America Market Y-o-Y Growth Comparison by Storage Capacity , 2025-2035
  • Figure 22: North America Market Attractiveness Analysis by Storage Capacity
  • Figure 23: North America Market Value Share and BPS Analysis by Application, 2025 and 2035
  • Figure 24: North America Market Y-o-Y Growth Comparison by Application, 2025-2035
  • Figure 25: North America Market Attractiveness Analysis by Application
  • Figure 26: Latin America Market Value Share and BPS Analysis by Country, 2025 and 2035
  • Figure 27: Latin America Market Value Share and BPS Analysis by Storage Capacity , 2025 and 2035
  • Figure 28: Latin America Market Y-o-Y Growth Comparison by Storage Capacity , 2025-2035
  • Figure 29: Latin America Market Attractiveness Analysis by Storage Capacity
  • Figure 30: Latin America Market Value Share and BPS Analysis by Application, 2025 and 2035
  • Figure 31: Latin America Market Y-o-Y Growth Comparison by Application, 2025-2035
  • Figure 32: Latin America Market Attractiveness Analysis by Application
  • Figure 33: Western Europe Market Value Share and BPS Analysis by Country, 2025 and 2035
  • Figure 34: Western Europe Market Value Share and BPS Analysis by Storage Capacity , 2025 and 2035
  • Figure 35: Western Europe Market Y-o-Y Growth Comparison by Storage Capacity , 2025-2035
  • Figure 36: Western Europe Market Attractiveness Analysis by Storage Capacity
  • Figure 37: Western Europe Market Value Share and BPS Analysis by Application, 2025 and 2035
  • Figure 38: Western Europe Market Y-o-Y Growth Comparison by Application, 2025-2035
  • Figure 39: Western Europe Market Attractiveness Analysis by Application
  • Figure 40: Eastern Europe Market Value Share and BPS Analysis by Country, 2025 and 2035
  • Figure 41: Eastern Europe Market Value Share and BPS Analysis by Storage Capacity , 2025 and 2035
  • Figure 42: Eastern Europe Market Y-o-Y Growth Comparison by Storage Capacity , 2025-2035
  • Figure 43: Eastern Europe Market Attractiveness Analysis by Storage Capacity
  • Figure 44: Eastern Europe Market Value Share and BPS Analysis by Application, 2025 and 2035
  • Figure 45: Eastern Europe Market Y-o-Y Growth Comparison by Application, 2025-2035
  • Figure 46: Eastern Europe Market Attractiveness Analysis by Application
  • Figure 47: East Asia Market Value Share and BPS Analysis by Country, 2025 and 2035
  • Figure 48: East Asia Market Value Share and BPS Analysis by Storage Capacity , 2025 and 2035
  • Figure 49: East Asia Market Y-o-Y Growth Comparison by Storage Capacity , 2025-2035
  • Figure 50: East Asia Market Attractiveness Analysis by Storage Capacity
  • Figure 51: East Asia Market Value Share and BPS Analysis by Application, 2025 and 2035
  • Figure 52: East Asia Market Y-o-Y Growth Comparison by Application, 2025-2035
  • Figure 53: East Asia Market Attractiveness Analysis by Application
  • Figure 54: South Asia and Pacific Market Value Share and BPS Analysis by Country, 2025 and 2035
  • Figure 55: South Asia and Pacific Market Value Share and BPS Analysis by Storage Capacity , 2025 and 2035
  • Figure 56: South Asia and Pacific Market Y-o-Y Growth Comparison by Storage Capacity , 2025-2035
  • Figure 57: South Asia and Pacific Market Attractiveness Analysis by Storage Capacity
  • Figure 58: South Asia and Pacific Market Value Share and BPS Analysis by Application, 2025 and 2035
  • Figure 59: South Asia and Pacific Market Y-o-Y Growth Comparison by Application, 2025-2035
  • Figure 60: South Asia and Pacific Market Attractiveness Analysis by Application
  • Figure 61: Middle East & Africa Market Value Share and BPS Analysis by Country, 2025 and 2035
  • Figure 62: Middle East & Africa Market Value Share and BPS Analysis by Storage Capacity , 2025 and 2035
  • Figure 63: Middle East & Africa Market Y-o-Y Growth Comparison by Storage Capacity , 2025-2035
  • Figure 64: Middle East & Africa Market Attractiveness Analysis by Storage Capacity
  • Figure 65: Middle East & Africa Market Value Share and BPS Analysis by Application, 2025 and 2035
  • Figure 66: Middle East & Africa Market Y-o-Y Growth Comparison by Application, 2025-2035
  • Figure 67: Middle East & Africa Market Attractiveness Analysis by Application
  • Figure 68: Global Market - Tier Structure Analysis
  • Figure 69: Global Market - Company Share Analysis

Frequently Asked Questions

How big is the solid-state array market in 2025?

The global solid-state array market is estimated to be valued at USD 16.5 billion in 2025.

What will be the size of solid-state array market in 2035?

The market size for the solid-state array market is projected to reach USD 66.6 billion by 2035.

How much will be the solid-state array market growth between 2025 and 2035?

The solid-state array market is expected to grow at a 15.0% CAGR between 2025 and 2035.

What are the key product types in the solid-state array market?

The key product types in solid-state array market are 1gb – 256gb, 256.1 gb – 1tb and >=1.1tb.

Which application segment to contribute significant share in the solid-state array market in 2025?

In terms of application, enterprise segment to command 42.6% share in the solid-state array market in 2025.

Explore Similar Insights

Future Market Insights

Solid-State Array Market

Chat With MaRIA

Chat With

MaRIA

Hi There, I am MaRIA, Your Market Research Intelligence Assistant. How may I help you?