DNA Microarray Market Size and Share Forecast Outlook From 2025 to 2035

The DNA microarray market is experiencing steady expansion. Rising demand for advanced genetic analysis, increasing adoption of precision medicine, and ongoing genomic research initiatives are driving market growth. The current landscape is defined by technological advancements in hybridization techniques, improved data interpretation tools, and integration of automation for high-throughput applications.

Regulatory support for molecular diagnostics and increased investment in life sciences research are enhancing adoption across clinical and academic sectors. Cost optimization and technological innovation are allowing laboratories to achieve higher efficiency and reproducibility in genetic testing.

The future outlook remains positive, supported by continued emphasis on personalized healthcare, expansion of research in gene expression profiling, and the growing role of DNA microarrays in disease pathway analysis The growth rationale is centered on the segment’s ability to deliver accurate, scalable, and efficient genomic data analysis solutions that support both research and clinical diagnostics, thereby sustaining market momentum and expanding its relevance across multiple end-use domains.
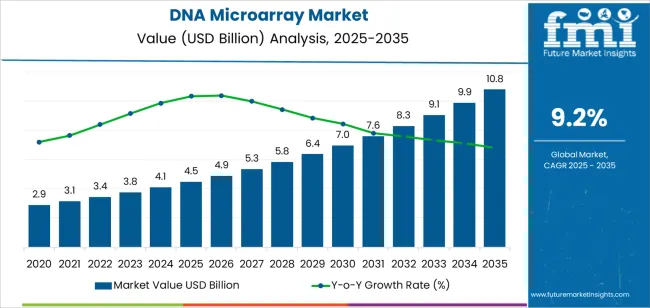
Quick Stats for DNA Microarray Market

  • DNA Microarray Market Industry Value (2025): USD 4.5 billion
  • DNA Microarray Market Forecast Value (2035): USD 10.8 billion
  • DNA Microarray Market Forecast CAGR: 9.2%
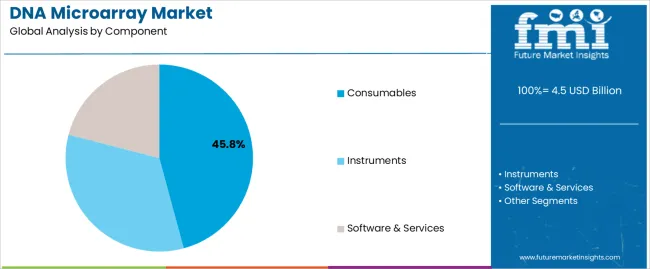
  • Leading Segment in DNA Microarray Market in 2025: Consumables (45.8%)
  • Key Growth Region in DNA Microarray Market: North America, Asia-Pacific, Europe
  • Top Key Players in DNA Microarray Market: Thermo Fisher Scientific Inc., Agilent Technologies Inc., Illumina Inc., PerkinElmer Inc., Bio-Rad Laboratories Inc., Roche Diagnostics, Qiagen N.V., Oxford Gene Technology (OGT), Applied Microarrays, Inc., Eurofins Genomics LLC, LC Sciences

Dna Microarray Market Market Value Analysis

Metric Value
DNA Microarray Market Estimated Value in (2025 E) USD 4.5 billion
DNA Microarray Market Forecast Value in (2035 F) USD 10.8 billion
Forecast CAGR (2025 to 2035) 9.2%

Segmental Analysis:

The market is segmented by Component, Type, Application, and End User and region. By Component, the market is divided into Consumables, Instruments, and Software & Services. In terms of Type, the market is classified into Complementary, Oligonucleotide, and Other Types. Based on Application, the market is segmented into Gene Expression Analysis, Genotyping, Transcription Factor Binding Analysis, and Other Applications. By End User, the market is divided into Academic & Research Institute, Pharmaceutical And Biotechnology Companies, Diagnostic Centers, Hospitals and Clinics, and Other End-Users. Regionally, the market is classified into North America, Latin America, Western Europe, Eastern Europe, Balkan & Baltic Countries, Russia & Belarus, Central Asia, East Asia, South Asia & Pacific, and the Middle East & Africa.
Insights into the Component Segment:

Dna Microarray Market Analysis By Component

The consumables segment, accounting for 45.80% of the component category, has been leading due to its recurring demand in research and diagnostic laboratories. Consistent utilization of reagents, slides, and assay kits has ensured continuous revenue generation.

Advancements in consumable design and reagent stability have improved data precision and workflow reliability. The segment’s growth has been supported by the increasing volume of genetic testing and rising investments in molecular biology research.

Manufacturers are focusing on improving shelf life, batch consistency, and compatibility with automated platforms The consumables segment is expected to maintain dominance as laboratories expand testing capacity and adopt newer generations of DNA microarray technologies that rely heavily on consistent, high-quality input materials.
Insights into the Type Segment:

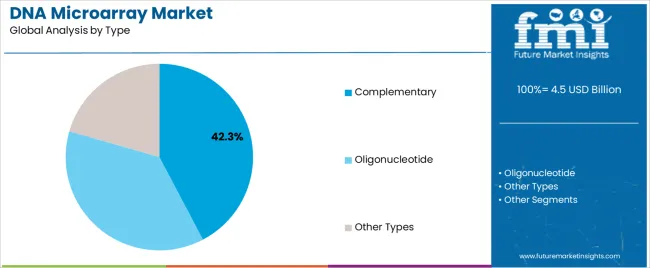
Dna Microarray Market Analysis By Type

The complementary DNA microarray segment, representing 42.30% of the type category, has maintained its leading position due to its efficiency in detecting gene expression patterns and hybridization accuracy. This segment’s strength lies in its ability to deliver comprehensive data across a wide range of biological samples.

Ongoing enhancements in probe design and data analysis software have reinforced its adoption in both research and clinical settings. The segment’s market share is being supported by rising usage in oncology and pharmacogenomics studies.

Manufacturers are investing in improved signal detection systems and enhanced bioinformatics tools, which are contributing to greater analytical precision These advancements are expected to sustain the segment’s competitiveness and broaden its applications across diagnostic and therapeutic research areas.
Insights into the Application Segment:

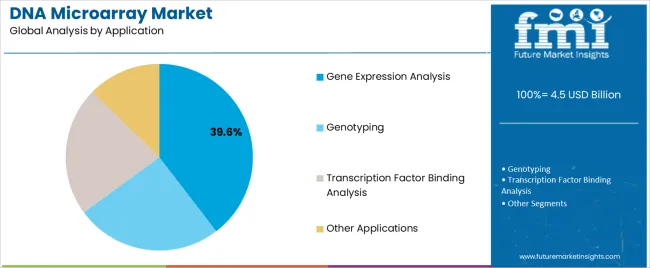
Dna Microarray Market Analysis By Application

The gene expression analysis segment, holding 39.60% of the application category, has remained dominant due to its critical role in identifying gene activity and understanding disease mechanisms. This segment’s growth is being driven by the increasing focus on personalized medicine and large-scale genomic research projects.

Its adoption has been supported by technological developments that allow simultaneous analysis of thousands of genes, improving research productivity and clinical insights. The ability to correlate gene expression profiles with disease progression and therapeutic response has enhanced its clinical utility.

Expanding use in cancer research, pharmacogenomics, and developmental biology is expected to further strengthen demand Continued innovation in data processing and microarray miniaturization will support sustained market growth and reinforce the prominence of gene expression analysis within the overall DNA microarray landscape.

Top DNA Microarray Market Dynamics and Industry Trends

  • Growing advancements in microarray technology.
  • Expanding applications in clinical diagnostics and research.
  • A growing demand for individualized treatment.
  • Rising funding in genomics research.

Comparison of Historical vs Future Outlook on Changing Consumer Trends for DNA Microarray Industry

From 2020 to 2025, the DNA microarray market experienced a CAGR of 11.7%. Gene expression profiling, functional genomics, genome-wide association studies (GWAS), and epigenetics research all extensively use DNA microarrays.

Because of their capacity to scan hundreds of genes at once, researchers can find possible treatment targets, uncover illness biomarkers, and decipher intricate biological processes.

DNA microarrays are essential for molecular diagnostics, genetic testing, cancer profiling, and prenatal screening in clinical diagnostics. Microarray technology's high-throughput capability allows for quick and thorough analysis of patient samples, supporting early illness detection, therapy optimization, and individualized healthcare solutions.

The market is anticipated to develop as long as microarray technology continues to progress. Through the creation of higher-density arrays, better data analysis algorithms, and better probe designs, assay sensitivity, specificity, and throughput have all increased.

Projections indicate that the global DNA microarray market is expected to experience a CAGR of 9.2% from 2025 to 2035.

Historical CAGR 2020 to 2025 11.7%
Forecast CAGR 2025 to 2035 9.2%

Key Growth Drivers Fueling the DNA Microarray Industry

  • The performance and usefulness of DNA microarrays are improved by ongoing developments in genomic technologies, including enhancements in microarray design, probe chemistry, and data analysis algorithms.
  • The need for DNA microarrays is fuelled by the growing use of personalized medicine techniques, which use genomic data to customize medical treatments for specific patients.
  • The rising incidence of chronic diseases, including cancer, cardiovascular diseases, and neurological disorders, drives the need for DNA microarrays in molecular diagnostics and clinical research.
  • In the DNA microarray industry, partnerships and collaborations among industrial participants, educational institutions, and research groups stimulate innovation and market expansion.
  • Government funding programs, research grants, and regulatory support all work to advance the creation and use of DNA microarray technologies.

Factors Restraining the Demand for DNA Microarray Solutions

  • Competition from NGS platforms challenges the market for DNA microarrays because researchers may opt to adopt sequencing-based techniques for genomic analysis, particularly when applications need whole-genome sequencing or targeted sequencing of specific genomic regions.
  • Because DNA microarray technology requires a large initial investment in infrastructure, reagents, and equipment, research laboratories and healthcare facilities may face financial difficulties when using this technique.
  • The adoption and usage of microarray technologies may be limited by financial demands and resource constraints, particularly in academic and nonprofit research institutions.

Analysis of Top Countries Researching, Certifying, Distributing, and Using DNA Microarrays

The table provided highlights the top five countries regarding revenue, with South Korea and Japan leading the list.

Precision medicine, which involves tailoring medical interventions to particular patient characteristics like genetic profiles, is gaining increasing attention from both South Korea and Japan.

DNA microarrays are crucial to precision medicine because they enable the analysis of genetic variants and biomarkers connected to medication metabolism, treatment response, and illness risk. This has encouraged industry growth.

Countries Forecast CAGRs from 2025 to 2035
The United States 9.4%
The United Kingdom 10.3%
China 9.8%
Japan 10.8%
South Korea 11.1%

Increased Advancement in Technology to Drive Market in the United States

The DNA microarray market in the United States is expected to expand with a CAGR of 9.4% from 2025 to 2035. Increasing advancements in microarray technology have led to increased sensitivity, accuracy, and throughput of DNA microarray assays, expanding their applications in research and clinical diagnostics.

Increasing demand in biopharmaceutical research and development for drug discovery, target identification, and biomarker discovery is expected to drive market growth. The healthcare sector is rapidly expanding due to the increasing application of DNA Microarrays in clinical settings for activities like cancer diagnosis, infectious disease detection, and prenatal genetic screening.

The Presence of Major Pharmaceutical Companies Drives the Adoption of DNA Microarray in the United Kingdom

The growth of the DNA microarray industry is attributed to extensive, cutting-edge research and development in the United Kingdom. The United Kingdom is expected to expand at a CAGR of 10.3% through 2035. Increasing use of DNA microarrays in clinical diagnostics for applications such as infectious disease detection, cancer profiling, and genetic screening.

Large investment allocations by government and private players contribute to the industry's growth in the United Kingdom. The biotechnology and pharmaceutical industry, which includes established companies and startups focused on DNA microarrays, is present in the country.

Growing Advances in Healthcare to Propel Market Growth in China

China is expected to exhibit significant market growth over the forecast period. The Chinese market for DNA microarray is anticipated to grow at a CAGR of 9.8%.

The growing emphasis on precision medicines and increased demand for personalized medicines in China boosts the market growth. The increasing advances in healthcare and the use of DNA microarray in clinical diagnostics fuel the market growth in China.

China's biotechnology industry has been growing quickly due to investments from the public and commercial sectors. DNA microarrays are in greater demand for use in research, diagnostics, and drug discovery applications due to the expanding emphasis on biopharmaceuticals, agricultural biotechnology, and precision medicine.
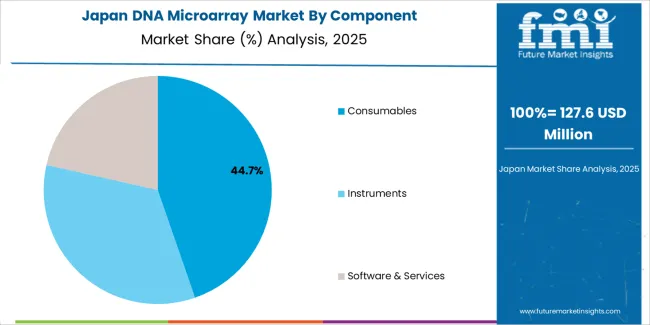
Government Support for Biotechnology in Japan to Boost Market Growth

Dna Microarray Market Japan Market Share Analysis By Component

The DNA microarray market in Japan is expected to expand with a CAGR of 10.8% from 2025 to 2035. Japan has been at the forefront of DNA microarray research and development, with several leading pharmaceutical and biotech companies investing heavily in the technology.

The Japanese government has also been actively promoting the development of DNA microarray by providing funding support and favorable regulations to researchers and pharmaceutical companies.

The availability of advanced technologies for microarrays, such as higher throughput platforms, improved data analysis tools, and automation, enhances the performance and capabilities of DNA microarrays, making them more attractive for research and clinical applications. This is further propelling the growth of the market in Japan.
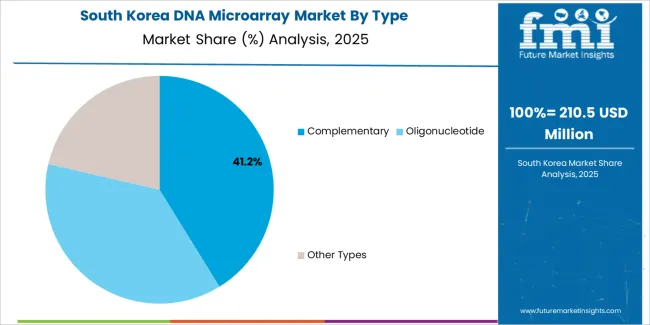
Increasing Demand for Personalized Healthcare Solutions in South Korea to Drive Market Growth

Dna Microarray Market South Korea Market Share Analysis By Type

The DNA microarray market in South Korea is expected to expand with a CAGR of 11.1% from 2025 to 2035. South Korea boasts a robust biotechnology sector focusing on research and development.

The country is home to leading biotech companies, research institutions, and academic centers that drive innovation in DNA microarray technology and its applications across various fields, including healthcare, agriculture, and environmental science.

The demand for sophisticated diagnostic technologies and personalized treatment solutions is driven by South Korea's high prevalence of chronic diseases and growing aging population. Clinical diagnostics is increasingly using DNA microarrays for tasks including genetic testing, infectious illness diagnosis, and cancer profiling.

DNA Microarray Industry Analysis by Top Investment Segments

The section below shows the leading segment. The consumables segment is set to rise at a CAGR of 9.0% from 2025 to 2035. Based on type, the complementary DNA microarray segment is anticipated to hold a dominant share through 2035. It is set to exhibit a CAGR of 8.8% from 2025 to 2035.

Category CAGR from 2025 to 2035
Consumables 9.0%
Complementary DNA Microarray 8.8%

Consumables Emerge as a Significant Segment in the Market

Based on components, the consumables segment is anticipated to thrive at a CAGR of 9.0% from 2025 to 2035. Consumables like microarray slides and probes are necessary components for DNA microarray experiments as they play a substantial role. Thus, the reagents are typically only usable once per test or have extremely limited duration to ensure that resampling is needed.

DNA microarray experiments can potentially process many samples simultaneously, often achieved by working with large volumes of consumables. They can supply a high throughput of samples. The rising sample count inevitably entails a proportional increase in the speed of consumables’ use.

Complementary DNA Microarray Segment is expected to Expand at the Fastest CAGR Over the Forecast Period.

Based on the type, the complementary DNA microarray segment is anticipated to thrive at a CAGR of 8.8% from 2025 to 2035. The complementary DNA microarray segment is anticipated to develop at the fastest rate over the projection period.

DNA microarrays are an effective method for examining gene expression in various organisms. The growing number of applications for DNA microarrays, including polymorphism screening, mapping genomic DNA clones, and gene discoveries, is driving the expansion of this market.
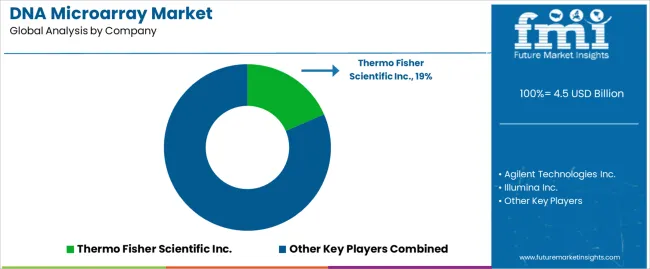
Key DNA Microarray Market Players and Concentration

Dna Microarray Market Analysis By Company

The market is very competitive because many top biotech and pharmaceutical companies are in it. It is distinguished by fierce rivalry, quick technical progress, and significant R&D activity focused on creating cutting-edge DNA microarrays.

The leading players in the market are investing in research and development to enhance their DNA microarray platforms, improve assay sensitivity and specificity, and develop new applications.

  • In July 2025 - The first completely automated immunoassay to be commercially accessible in India, Elecsys® HCV Duo, was introduced by Roche Diagnostics India. It enables the independent and simultaneous assessment of the hepatitis C virus (HCV) antigen and antibody status from a single human plasma or blood sample.

Key Shifting Preferences Covered in DNA Microarray Market Report

  • Recent Advances in DNA Microarray Market
  • DNA Microarray Industry Analysis in East Asia
  • Strategies of Key Players in the DNA Microarray Market
  • DNA Microarray Market Overview
  • DNA Microarray Technology Pricing Outlook

Scope and Coverage of the DNA Microarray Market Report

Attributes Details
Estimated Market Size in 2025 USD 4.1 billion
Projected Market Valuation in 2035 USD 9.9 billion
Value-based CAGR 2025 to 2035 9.2%
Forecast Period 2025 to 2035
Historical Data Available for 2020 to 2025
Market Analysis Value in USD billion
Key Regions Covered North America; Latin America; Western Europe; Eastern Europe; South Asia and Pacific; East Asia; The Middle East and Africa
Key Market Segments Covered Component, Type, Application, End User, Region
Key Countries Profiled The United States, Canada, Brazil, Mexico, Germany, The United Kingdom, France, Spain, Italy, Russia, Poland, Czech Republic, Romania, India, Bangladesh, Australia, New Zealand, China, Japan, South Korea, GCC countries, South Africa, Israel
Key Companies Profiled Thermo Fisher Scientific Inc.; Agilent Technologies Inc.; Illumina Inc.; PerkinElmer Inc.; Bio-Rad Laboratories Inc.; Roche Diagnostics; Qiagen N.V.; Oxford Gene Technology (OGT); Applied Microarrays, Inc.; Eurofins Genomics LLC; LC Sciences

Top Segments Studied in the DNA Microarray Market Report

By Component:

  • Consumables
  • Instruments
  • Software & Services

By Type:

  • Complementary
  • Oligonucleotide
  • Other Types

By Application:

  • Gene Expression Analysis
  • Genotyping
  • Transcription Factor Binding Analysis
  • Other Applications

By End User:

  • Academic & Research Institute
  • Pharmaceutical and Biotechnology Companies
  • Diagnostic Centers
  • Hospitals and Clinics
  • Other End-Users

By Region:

  • North America
  • Latin America
  • Western Europe
  • Eastern Europe
  • South Asia and Pacific
  • East Asia
  • Middle East and Africa

Frequently Asked Questions

How big is the dna microarray market in 2025?

The global dna microarray market is estimated to be valued at USD 4.5 billion in 2025.

What will be the size of dna microarray market in 2035?

The market size for the dna microarray market is projected to reach USD 10.8 billion by 2035.

How much will be the dna microarray market growth between 2025 and 2035?

The dna microarray market is expected to grow at a 9.2% CAGR between 2025 and 2035.

What are the key product types in the dna microarray market?

The key product types in dna microarray market are consumables, instruments and software & services.

Which type segment to contribute significant share in the dna microarray market in 2025?

In terms of type, complementary segment to command 42.3% share in the dna microarray market in 2025.

Table of Content

  1. Executive Summary
    • Global Market Outlook
    • Demand to side Trends
    • Supply to side Trends
    • Technology Roadmap Analysis
    • Analysis and Recommendations
  2. Market Overview
    • Market Coverage / Taxonomy
    • Market Definition / Scope / Limitations
  3. Market Background
    • Market Dynamics
      • Drivers
      • Restraints
      • Opportunity
      • Trends
    • Scenario Forecast
      • Demand in Optimistic Scenario
      • Demand in Likely Scenario
      • Demand in Conservative Scenario
    • Opportunity Map Analysis
    • Product Life Cycle Analysis
    • Supply Chain Analysis
    • Investment Feasibility Matrix
    • Value Chain Analysis
    • PESTLE and Porter’s Analysis
    • Regulatory Landscape
    • Regional Parent Market Outlook
    • Production and Consumption Statistics
    • Import and Export Statistics
  4. Global Market Analysis 2020 to 2024 and Forecast, 2025 to 2035
    • Historical Market Size Value (USD Million) Analysis, 2020 to 2024
    • Current and Future Market Size Value (USD Million) Projections, 2025 to 2035
      • Y to o to Y Growth Trend Analysis
      • Absolute $ Opportunity Analysis
  5. Global Market Pricing Analysis 2020 to 2024 and Forecast 2025 to 2035
  6. Global Market Analysis 2020 to 2024 and Forecast 2025 to 2035, By Component
    • Introduction / Key Findings
    • Historical Market Size Value (USD Million) Analysis By Component , 2020 to 2024
    • Current and Future Market Size Value (USD Million) Analysis and Forecast By Component , 2025 to 2035
      • Consumables
      • Instruments
      • Software & Services
    • Y to o to Y Growth Trend Analysis By Component , 2020 to 2024
    • Absolute $ Opportunity Analysis By Component , 2025 to 2035
  7. Global Market Analysis 2020 to 2024 and Forecast 2025 to 2035, By Type
    • Introduction / Key Findings
    • Historical Market Size Value (USD Million) Analysis By Type, 2020 to 2024
    • Current and Future Market Size Value (USD Million) Analysis and Forecast By Type, 2025 to 2035
      • Complementary
      • Oligonucleotide
      • Other Types
    • Y to o to Y Growth Trend Analysis By Type, 2020 to 2024
    • Absolute $ Opportunity Analysis By Type, 2025 to 2035
  8. Global Market Analysis 2020 to 2024 and Forecast 2025 to 2035, By Application
    • Introduction / Key Findings
    • Historical Market Size Value (USD Million) Analysis By Application, 2020 to 2024
    • Current and Future Market Size Value (USD Million) Analysis and Forecast By Application, 2025 to 2035
      • Gene Expression Analysis
      • Genotyping
      • Transcription Factor Binding Analysis
      • Other Applications
    • Y to o to Y Growth Trend Analysis By Application, 2020 to 2024
    • Absolute $ Opportunity Analysis By Application, 2025 to 2035
  9. Global Market Analysis 2020 to 2024 and Forecast 2025 to 2035, By End User
    • Introduction / Key Findings
    • Historical Market Size Value (USD Million) Analysis By End User, 2020 to 2024
    • Current and Future Market Size Value (USD Million) Analysis and Forecast By End User, 2025 to 2035
      • Academic & Research Institute
      • Pharmaceutical And Biotechnology Companies
      • Diagnostic Centers
      • Hospitals and Clinics
      • Other End-Users
    • Y to o to Y Growth Trend Analysis By End User, 2020 to 2024
    • Absolute $ Opportunity Analysis By End User, 2025 to 2035
  10. Global Market Analysis 2020 to 2024 and Forecast 2025 to 2035, By Region
    • Introduction
    • Historical Market Size Value (USD Million) Analysis By Region, 2020 to 2024
    • Current Market Size Value (USD Million) Analysis and Forecast By Region, 2025 to 2035
      • North America
      • Latin America
      • Western Europe
      • Eastern Europe
      • East Asia
      • South Asia and Pacific
      • Middle East & Africa
    • Market Attractiveness Analysis By Region
  11. North America Market Analysis 2020 to 2024 and Forecast 2025 to 2035, By Country
    • Historical Market Size Value (USD Million) Trend Analysis By Market Taxonomy, 2020 to 2024
    • Market Size Value (USD Million) Forecast By Market Taxonomy, 2025 to 2035
      • By Country
        • USA
        • Canada
        • Mexico
      • By Component
      • By Type
      • By Application
      • By End User
    • Market Attractiveness Analysis
      • By Country
      • By Component
      • By Type
      • By Application
      • By End User
    • Key Takeaways
  12. Latin America Market Analysis 2020 to 2024 and Forecast 2025 to 2035, By Country
    • Historical Market Size Value (USD Million) Trend Analysis By Market Taxonomy, 2020 to 2024
    • Market Size Value (USD Million) Forecast By Market Taxonomy, 2025 to 2035
      • By Country
        • Brazil
        • Chile
        • Rest of Latin America
      • By Component
      • By Type
      • By Application
      • By End User
    • Market Attractiveness Analysis
      • By Country
      • By Component
      • By Type
      • By Application
      • By End User
    • Key Takeaways
  13. Western Europe Market Analysis 2020 to 2024 and Forecast 2025 to 2035, By Country
    • Historical Market Size Value (USD Million) Trend Analysis By Market Taxonomy, 2020 to 2024
    • Market Size Value (USD Million) Forecast By Market Taxonomy, 2025 to 2035
      • By Country
        • Germany
        • UK
        • Italy
        • Spain
        • France
        • Nordic
        • BENELUX
        • Rest of Western Europe
      • By Component
      • By Type
      • By Application
      • By End User
    • Market Attractiveness Analysis
      • By Country
      • By Component
      • By Type
      • By Application
      • By End User
    • Key Takeaways
  14. Eastern Europe Market Analysis 2020 to 2024 and Forecast 2025 to 2035, By Country
    • Historical Market Size Value (USD Million) Trend Analysis By Market Taxonomy, 2020 to 2024
    • Market Size Value (USD Million) Forecast By Market Taxonomy, 2025 to 2035
      • By Country
        • Russia
        • Poland
        • Hungary
        • Balkan & Baltic
        • Rest of Eastern Europe
      • By Component
      • By Type
      • By Application
      • By End User
    • Market Attractiveness Analysis
      • By Country
      • By Component
      • By Type
      • By Application
      • By End User
    • Key Takeaways
  15. East Asia Market Analysis 2020 to 2024 and Forecast 2025 to 2035, By Country
    • Historical Market Size Value (USD Million) Trend Analysis By Market Taxonomy, 2020 to 2024
    • Market Size Value (USD Million) Forecast By Market Taxonomy, 2025 to 2035
      • By Country
        • China
        • Japan
        • South Korea
      • By Component
      • By Type
      • By Application
      • By End User
    • Market Attractiveness Analysis
      • By Country
      • By Component
      • By Type
      • By Application
      • By End User
    • Key Takeaways
  16. South Asia and Pacific Market Analysis 2020 to 2024 and Forecast 2025 to 2035, By Country
    • Historical Market Size Value (USD Million) Trend Analysis By Market Taxonomy, 2020 to 2024
    • Market Size Value (USD Million) Forecast By Market Taxonomy, 2025 to 2035
      • By Country
        • India
        • ASEAN
        • Australia & New Zealand
        • Rest of South Asia and Pacific
      • By Component
      • By Type
      • By Application
      • By End User
    • Market Attractiveness Analysis
      • By Country
      • By Component
      • By Type
      • By Application
      • By End User
    • Key Takeaways
  17. Middle East & Africa Market Analysis 2020 to 2024 and Forecast 2025 to 2035, By Country
    • Historical Market Size Value (USD Million) Trend Analysis By Market Taxonomy, 2020 to 2024
    • Market Size Value (USD Million) Forecast By Market Taxonomy, 2025 to 2035
      • By Country
        • Kingdom of Saudi Arabia
        • Other GCC Countries
        • Turkiye
        • South Africa
        • Other African Union
        • Rest of Middle East & Africa
      • By Component
      • By Type
      • By Application
      • By End User
    • Market Attractiveness Analysis
      • By Country
      • By Component
      • By Type
      • By Application
      • By End User
    • Key Takeaways
  18. Key Countries Market Analysis
    • USA
      • Pricing Analysis
      • Market Share Analysis, 2024
        • By Component
        • By Type
        • By Application
        • By End User
    • Canada
      • Pricing Analysis
      • Market Share Analysis, 2024
        • By Component
        • By Type
        • By Application
        • By End User
    • Mexico
      • Pricing Analysis
      • Market Share Analysis, 2024
        • By Component
        • By Type
        • By Application
        • By End User
    • Brazil
      • Pricing Analysis
      • Market Share Analysis, 2024
        • By Component
        • By Type
        • By Application
        • By End User
    • Chile
      • Pricing Analysis
      • Market Share Analysis, 2024
        • By Component
        • By Type
        • By Application
        • By End User
    • Germany
      • Pricing Analysis
      • Market Share Analysis, 2024
        • By Component
        • By Type
        • By Application
        • By End User
    • UK
      • Pricing Analysis
      • Market Share Analysis, 2024
        • By Component
        • By Type
        • By Application
        • By End User
    • Italy
      • Pricing Analysis
      • Market Share Analysis, 2024
        • By Component
        • By Type
        • By Application
        • By End User
    • Spain
      • Pricing Analysis
      • Market Share Analysis, 2024
        • By Component
        • By Type
        • By Application
        • By End User
    • France
      • Pricing Analysis
      • Market Share Analysis, 2024
        • By Component
        • By Type
        • By Application
        • By End User
    • India
      • Pricing Analysis
      • Market Share Analysis, 2024
        • By Component
        • By Type
        • By Application
        • By End User
    • ASEAN
      • Pricing Analysis
      • Market Share Analysis, 2024
        • By Component
        • By Type
        • By Application
        • By End User
    • Australia & New Zealand
      • Pricing Analysis
      • Market Share Analysis, 2024
        • By Component
        • By Type
        • By Application
        • By End User
    • China
      • Pricing Analysis
      • Market Share Analysis, 2024
        • By Component
        • By Type
        • By Application
        • By End User
    • Japan
      • Pricing Analysis
      • Market Share Analysis, 2024
        • By Component
        • By Type
        • By Application
        • By End User
    • South Korea
      • Pricing Analysis
      • Market Share Analysis, 2024
        • By Component
        • By Type
        • By Application
        • By End User
    • Russia
      • Pricing Analysis
      • Market Share Analysis, 2024
        • By Component
        • By Type
        • By Application
        • By End User
    • Poland
      • Pricing Analysis
      • Market Share Analysis, 2024
        • By Component
        • By Type
        • By Application
        • By End User
    • Hungary
      • Pricing Analysis
      • Market Share Analysis, 2024
        • By Component
        • By Type
        • By Application
        • By End User
    • Kingdom of Saudi Arabia
      • Pricing Analysis
      • Market Share Analysis, 2024
        • By Component
        • By Type
        • By Application
        • By End User
    • Turkiye
      • Pricing Analysis
      • Market Share Analysis, 2024
        • By Component
        • By Type
        • By Application
        • By End User
    • South Africa
      • Pricing Analysis
      • Market Share Analysis, 2024
        • By Component
        • By Type
        • By Application
        • By End User
  19. Market Structure Analysis
    • Competition Dashboard
    • Competition Benchmarking
    • Market Share Analysis of Top Players
      • By Regional
      • By Component
      • By Type
      • By Application
      • By End User
  20. Competition Analysis
    • Competition Deep Dive
      • Thermo Fisher Scientific Inc.
        • Overview
        • Product Portfolio
        • Profitability by Market Segments (Product/Age /Sales Channel/Region)
        • Sales Footprint
        • Strategy Overview
          • Marketing Strategy
          • Product Strategy
          • Channel Strategy
      • Agilent Technologies Inc.
      • Illumina Inc.
      • PerkinElmer Inc.
      • Bio-Rad Laboratories Inc.
      • Roche Diagnostics
      • Qiagen N.V.
      • Oxford Gene Technology (OGT)
      • Applied Microarrays, Inc.
      • Eurofins Genomics LLC
      • LC Sciences
  21. Assumptions & Acronyms Used
  22. Research Methodology

List of Tables

  • Table 1: Global Market Value (USD Million) Forecast by Region, 2020 to 2035
  • Table 2: Global Market Value (USD Million) Forecast by Component , 2020 to 2035
  • Table 3: Global Market Value (USD Million) Forecast by Type, 2020 to 2035
  • Table 4: Global Market Value (USD Million) Forecast by Application, 2020 to 2035
  • Table 5: Global Market Value (USD Million) Forecast by End User, 2020 to 2035
  • Table 6: North America Market Value (USD Million) Forecast by Country, 2020 to 2035
  • Table 7: North America Market Value (USD Million) Forecast by Component , 2020 to 2035
  • Table 8: North America Market Value (USD Million) Forecast by Type, 2020 to 2035
  • Table 9: North America Market Value (USD Million) Forecast by Application, 2020 to 2035
  • Table 10: North America Market Value (USD Million) Forecast by End User, 2020 to 2035
  • Table 11: Latin America Market Value (USD Million) Forecast by Country, 2020 to 2035
  • Table 12: Latin America Market Value (USD Million) Forecast by Component , 2020 to 2035
  • Table 13: Latin America Market Value (USD Million) Forecast by Type, 2020 to 2035
  • Table 14: Latin America Market Value (USD Million) Forecast by Application, 2020 to 2035
  • Table 15: Latin America Market Value (USD Million) Forecast by End User, 2020 to 2035
  • Table 16: Western Europe Market Value (USD Million) Forecast by Country, 2020 to 2035
  • Table 17: Western Europe Market Value (USD Million) Forecast by Component , 2020 to 2035
  • Table 18: Western Europe Market Value (USD Million) Forecast by Type, 2020 to 2035
  • Table 19: Western Europe Market Value (USD Million) Forecast by Application, 2020 to 2035
  • Table 20: Western Europe Market Value (USD Million) Forecast by End User, 2020 to 2035
  • Table 21: Eastern Europe Market Value (USD Million) Forecast by Country, 2020 to 2035
  • Table 22: Eastern Europe Market Value (USD Million) Forecast by Component , 2020 to 2035
  • Table 23: Eastern Europe Market Value (USD Million) Forecast by Type, 2020 to 2035
  • Table 24: Eastern Europe Market Value (USD Million) Forecast by Application, 2020 to 2035
  • Table 25: Eastern Europe Market Value (USD Million) Forecast by End User, 2020 to 2035
  • Table 26: East Asia Market Value (USD Million) Forecast by Country, 2020 to 2035
  • Table 27: East Asia Market Value (USD Million) Forecast by Component , 2020 to 2035
  • Table 28: East Asia Market Value (USD Million) Forecast by Type, 2020 to 2035
  • Table 29: East Asia Market Value (USD Million) Forecast by Application, 2020 to 2035
  • Table 30: East Asia Market Value (USD Million) Forecast by End User, 2020 to 2035
  • Table 31: South Asia and Pacific Market Value (USD Million) Forecast by Country, 2020 to 2035
  • Table 32: South Asia and Pacific Market Value (USD Million) Forecast by Component , 2020 to 2035
  • Table 33: South Asia and Pacific Market Value (USD Million) Forecast by Type, 2020 to 2035
  • Table 34: South Asia and Pacific Market Value (USD Million) Forecast by Application, 2020 to 2035
  • Table 35: South Asia and Pacific Market Value (USD Million) Forecast by End User, 2020 to 2035
  • Table 36: Middle East & Africa Market Value (USD Million) Forecast by Country, 2020 to 2035
  • Table 37: Middle East & Africa Market Value (USD Million) Forecast by Component , 2020 to 2035
  • Table 38: Middle East & Africa Market Value (USD Million) Forecast by Type, 2020 to 2035
  • Table 39: Middle East & Africa Market Value (USD Million) Forecast by Application, 2020 to 2035
  • Table 40: Middle East & Africa Market Value (USD Million) Forecast by End User, 2020 to 2035

List of Figures

  • Figure 1: Global Market Pricing Analysis
  • Figure 2: Global Market Value (USD Million) Forecast 2020-2035
  • Figure 3: Global Market Value Share and BPS Analysis by Component , 2025 and 2035
  • Figure 4: Global Market Y to o to Y Growth Comparison by Component , 2025-2035
  • Figure 5: Global Market Attractiveness Analysis by Component
  • Figure 6: Global Market Value Share and BPS Analysis by Type, 2025 and 2035
  • Figure 7: Global Market Y to o to Y Growth Comparison by Type, 2025-2035
  • Figure 8: Global Market Attractiveness Analysis by Type
  • Figure 9: Global Market Value Share and BPS Analysis by Application, 2025 and 2035
  • Figure 10: Global Market Y to o to Y Growth Comparison by Application, 2025-2035
  • Figure 11: Global Market Attractiveness Analysis by Application
  • Figure 12: Global Market Value Share and BPS Analysis by End User, 2025 and 2035
  • Figure 13: Global Market Y to o to Y Growth Comparison by End User, 2025-2035
  • Figure 14: Global Market Attractiveness Analysis by End User
  • Figure 15: Global Market Value (USD Million) Share and BPS Analysis by Region, 2025 and 2035
  • Figure 16: Global Market Y to o to Y Growth Comparison by Region, 2025-2035
  • Figure 17: Global Market Attractiveness Analysis by Region
  • Figure 18: North America Market Incremental Dollar Opportunity, 2025-2035
  • Figure 19: Latin America Market Incremental Dollar Opportunity, 2025-2035
  • Figure 20: Western Europe Market Incremental Dollar Opportunity, 2025-2035
  • Figure 21: Eastern Europe Market Incremental Dollar Opportunity, 2025-2035
  • Figure 22: East Asia Market Incremental Dollar Opportunity, 2025-2035
  • Figure 23: South Asia and Pacific Market Incremental Dollar Opportunity, 2025-2035
  • Figure 24: Middle East & Africa Market Incremental Dollar Opportunity, 2025-2035
  • Figure 25: North America Market Value Share and BPS Analysis by Country, 2025 and 2035
  • Figure 26: North America Market Value Share and BPS Analysis by Component , 2025 and 2035
  • Figure 27: North America Market Y to o to Y Growth Comparison by Component , 2025-2035
  • Figure 28: North America Market Attractiveness Analysis by Component
  • Figure 29: North America Market Value Share and BPS Analysis by Type, 2025 and 2035
  • Figure 30: North America Market Y to o to Y Growth Comparison by Type, 2025-2035
  • Figure 31: North America Market Attractiveness Analysis by Type
  • Figure 32: North America Market Value Share and BPS Analysis by Application, 2025 and 2035
  • Figure 33: North America Market Y to o to Y Growth Comparison by Application, 2025-2035
  • Figure 34: North America Market Attractiveness Analysis by Application
  • Figure 35: North America Market Value Share and BPS Analysis by End User, 2025 and 2035
  • Figure 36: North America Market Y to o to Y Growth Comparison by End User, 2025-2035
  • Figure 37: North America Market Attractiveness Analysis by End User
  • Figure 38: Latin America Market Value Share and BPS Analysis by Country, 2025 and 2035
  • Figure 39: Latin America Market Value Share and BPS Analysis by Component , 2025 and 2035
  • Figure 40: Latin America Market Y to o to Y Growth Comparison by Component , 2025-2035
  • Figure 41: Latin America Market Attractiveness Analysis by Component
  • Figure 42: Latin America Market Value Share and BPS Analysis by Type, 2025 and 2035
  • Figure 43: Latin America Market Y to o to Y Growth Comparison by Type, 2025-2035
  • Figure 44: Latin America Market Attractiveness Analysis by Type
  • Figure 45: Latin America Market Value Share and BPS Analysis by Application, 2025 and 2035
  • Figure 46: Latin America Market Y to o to Y Growth Comparison by Application, 2025-2035
  • Figure 47: Latin America Market Attractiveness Analysis by Application
  • Figure 48: Latin America Market Value Share and BPS Analysis by End User, 2025 and 2035
  • Figure 49: Latin America Market Y to o to Y Growth Comparison by End User, 2025-2035
  • Figure 50: Latin America Market Attractiveness Analysis by End User
  • Figure 51: Western Europe Market Value Share and BPS Analysis by Country, 2025 and 2035
  • Figure 52: Western Europe Market Value Share and BPS Analysis by Component , 2025 and 2035
  • Figure 53: Western Europe Market Y to o to Y Growth Comparison by Component , 2025-2035
  • Figure 54: Western Europe Market Attractiveness Analysis by Component
  • Figure 55: Western Europe Market Value Share and BPS Analysis by Type, 2025 and 2035
  • Figure 56: Western Europe Market Y to o to Y Growth Comparison by Type, 2025-2035
  • Figure 57: Western Europe Market Attractiveness Analysis by Type
  • Figure 58: Western Europe Market Value Share and BPS Analysis by Application, 2025 and 2035
  • Figure 59: Western Europe Market Y to o to Y Growth Comparison by Application, 2025-2035
  • Figure 60: Western Europe Market Attractiveness Analysis by Application
  • Figure 61: Western Europe Market Value Share and BPS Analysis by End User, 2025 and 2035
  • Figure 62: Western Europe Market Y to o to Y Growth Comparison by End User, 2025-2035
  • Figure 63: Western Europe Market Attractiveness Analysis by End User
  • Figure 64: Eastern Europe Market Value Share and BPS Analysis by Country, 2025 and 2035
  • Figure 65: Eastern Europe Market Value Share and BPS Analysis by Component , 2025 and 2035
  • Figure 66: Eastern Europe Market Y to o to Y Growth Comparison by Component , 2025-2035
  • Figure 67: Eastern Europe Market Attractiveness Analysis by Component
  • Figure 68: Eastern Europe Market Value Share and BPS Analysis by Type, 2025 and 2035
  • Figure 69: Eastern Europe Market Y to o to Y Growth Comparison by Type, 2025-2035
  • Figure 70: Eastern Europe Market Attractiveness Analysis by Type
  • Figure 71: Eastern Europe Market Value Share and BPS Analysis by Application, 2025 and 2035
  • Figure 72: Eastern Europe Market Y to o to Y Growth Comparison by Application, 2025-2035
  • Figure 73: Eastern Europe Market Attractiveness Analysis by Application
  • Figure 74: Eastern Europe Market Value Share and BPS Analysis by End User, 2025 and 2035
  • Figure 75: Eastern Europe Market Y to o to Y Growth Comparison by End User, 2025-2035
  • Figure 76: Eastern Europe Market Attractiveness Analysis by End User
  • Figure 77: East Asia Market Value Share and BPS Analysis by Country, 2025 and 2035
  • Figure 78: East Asia Market Value Share and BPS Analysis by Component , 2025 and 2035
  • Figure 79: East Asia Market Y to o to Y Growth Comparison by Component , 2025-2035
  • Figure 80: East Asia Market Attractiveness Analysis by Component
  • Figure 81: East Asia Market Value Share and BPS Analysis by Type, 2025 and 2035
  • Figure 82: East Asia Market Y to o to Y Growth Comparison by Type, 2025-2035
  • Figure 83: East Asia Market Attractiveness Analysis by Type
  • Figure 84: East Asia Market Value Share and BPS Analysis by Application, 2025 and 2035
  • Figure 85: East Asia Market Y to o to Y Growth Comparison by Application, 2025-2035
  • Figure 86: East Asia Market Attractiveness Analysis by Application
  • Figure 87: East Asia Market Value Share and BPS Analysis by End User, 2025 and 2035
  • Figure 88: East Asia Market Y to o to Y Growth Comparison by End User, 2025-2035
  • Figure 89: East Asia Market Attractiveness Analysis by End User
  • Figure 90: South Asia and Pacific Market Value Share and BPS Analysis by Country, 2025 and 2035
  • Figure 91: South Asia and Pacific Market Value Share and BPS Analysis by Component , 2025 and 2035
  • Figure 92: South Asia and Pacific Market Y to o to Y Growth Comparison by Component , 2025-2035
  • Figure 93: South Asia and Pacific Market Attractiveness Analysis by Component
  • Figure 94: South Asia and Pacific Market Value Share and BPS Analysis by Type, 2025 and 2035
  • Figure 95: South Asia and Pacific Market Y to o to Y Growth Comparison by Type, 2025-2035
  • Figure 96: South Asia and Pacific Market Attractiveness Analysis by Type
  • Figure 97: South Asia and Pacific Market Value Share and BPS Analysis by Application, 2025 and 2035
  • Figure 98: South Asia and Pacific Market Y to o to Y Growth Comparison by Application, 2025-2035
  • Figure 99: South Asia and Pacific Market Attractiveness Analysis by Application
  • Figure 100: South Asia and Pacific Market Value Share and BPS Analysis by End User, 2025 and 2035
  • Figure 101: South Asia and Pacific Market Y to o to Y Growth Comparison by End User, 2025-2035
  • Figure 102: South Asia and Pacific Market Attractiveness Analysis by End User
  • Figure 103: Middle East & Africa Market Value Share and BPS Analysis by Country, 2025 and 2035
  • Figure 104: Middle East & Africa Market Value Share and BPS Analysis by Component , 2025 and 2035
  • Figure 105: Middle East & Africa Market Y to o to Y Growth Comparison by Component , 2025-2035
  • Figure 106: Middle East & Africa Market Attractiveness Analysis by Component
  • Figure 107: Middle East & Africa Market Value Share and BPS Analysis by Type, 2025 and 2035
  • Figure 108: Middle East & Africa Market Y to o to Y Growth Comparison by Type, 2025-2035
  • Figure 109: Middle East & Africa Market Attractiveness Analysis by Type
  • Figure 110: Middle East & Africa Market Value Share and BPS Analysis by Application, 2025 and 2035
  • Figure 111: Middle East & Africa Market Y to o to Y Growth Comparison by Application, 2025-2035
  • Figure 112: Middle East & Africa Market Attractiveness Analysis by Application
  • Figure 113: Middle East & Africa Market Value Share and BPS Analysis by End User, 2025 and 2035
  • Figure 114: Middle East & Africa Market Y to o to Y Growth Comparison by End User, 2025-2035
  • Figure 115: Middle East & Africa Market Attractiveness Analysis by End User
  • Figure 116: Global Market - Tier Structure Analysis
  • Figure 117: Global Market - Company Share Analysis
Dashboard
Dashboard
Dashboard
Dashboard
Dashboard
Dashboard

Full Research Suite comprises of:

Market outlook & trends analysis

Market outlook & trends analysis

Interviews & case studies

Interviews & case studies

Strategic recommendations

Strategic recommendations

Vendor profiles & capabilities analysis

Vendor profiles & capabilities analysis

5-year forecasts

5-year forecasts

8 regions and 60+ country-level data splits

8 regions and 60+ country-level data splits

Market segment data splits

Market segment data splits

12 months of continuous data updates

12 months of continuous data updates

DELIVERED AS:

PDF EXCEL ONLINE

Full Research Suite


$5000

$7500

$10000

Buy Report Now
Similar Industry Reports

Similar Industry Reports

DNA Methylation Conversion Kit Market

DNA Methylation Conversion Kit Market Size and Share Forecast Outlook 2025 to 2035

DNA-Modified Plant Extracts Market

DNA-Modified Plant Extracts Market Analysis - Size and Share Forecast Outlook 2025 to 2035

DNA-Repair Enzymes Market

DNA-Repair Enzymes Market Analysis - Size, Share, and Forecast Outlook 2025 to 2035

DNA Chromatography Chips Market

DNA Chromatography Chips Market Size and Share Forecast Outlook 2025 to 2035

DNA Methylation Market

DNA Methylation Market Size and Share Forecast Outlook 2025 to 2035

DNA Polymerase Market

DNA Polymerase Market Analysis - Size, Share, and Forecast 2025 to 2035

DNA Sequencing Services Market

DNA Sequencing Services Market Trends - Growth & Forecast 2025 to 2035

DNA Synthesis Market

DNA Synthesis Market Growth - Trends & Forecast 2025 to 2035

DNA-Based Skin Care Market

DNA-Based Skin Care Market – Trends & Forecast 2025 to 2035

DNA/RNA Extraction Market

DNA/RNA Extraction Market Growth & Demand 2025 to 2035

DNA Diagnostics Market

DNA Diagnostics Market Growth - Trends & Forecast 2024 to 2034

DNA Sequencing Electrophoresis Systems Market

DNA Sequencing Electrophoresis Systems Market

DNA modifying agents Market

DNA modifying agents Market

cDNA Synthesis Market

cDNA Synthesis Market

Pet DNA Testing Market

Pet DNA Testing Market Analysis by Animal Type, Sample Type, Test Type, End User and Region: Forecast for 2025 to 2035

Japan DNA Polymerase Market

Japan DNA Polymerase Market Analysis – Growth, Applications & Outlook 2025-2035

Cosmid DNA Isolation Market

Cosmid DNA Isolation Market

Germany DNA Polymerase Market

Germany DNA Polymerase Market Trends – Size, Share & Growth 2025-2035

Handheld DNA Reader Market

Handheld DNA Reader Market Size and Share Forecast Outlook 2025 to 2035

Enzymatic DNA Synthesis Market

Enzymatic DNA Synthesis Market Size and Share Forecast Outlook 2025 to 2035

Future Market Insights

DNA Microarray Market

Chat With MaRIA

Chat With

MaRIA

Hi There, I am MaRIA, Your Market Research Intelligence Assistant. How may I help you?