Reports

- Global Locations -

Headquarters

Future Market Insights, Inc.

Christiana Corporate, 200
Continental Drive, Suite 401,
Newark, Delaware - 19713,
United States

T: +1-845-579-5705

Americas

Future Market Insights, Inc.

616 Corporate Way, Suite 2-9018,
Valley Cottage, NY 10989, United States

T: +1-347-918-3531

MEA

Future Market Insights

1602-6 Jumeirah Bay X2 Tower, Plot No: JLT-PH2-X2A,
Jumeirah Lakes Towers, Dubai,
United Arab Emirates

Europe

Future Market Insights

3rd Floor, 207 Regent Street,
W1B 3HH London
United Kingdom

T: + 44 (0) 20 8123 9659
D: +44 (0) 20 3287 4268

Asia Pacific

Future Market Insights

IndiaLand Global Tech Park, Unit UG-1, Behind Grand HighStreet, Phase 1, Hinjawadi, MH, Pune – 411057, India

DNA Sequencing Services Market Snapshot (2023 to 2033)

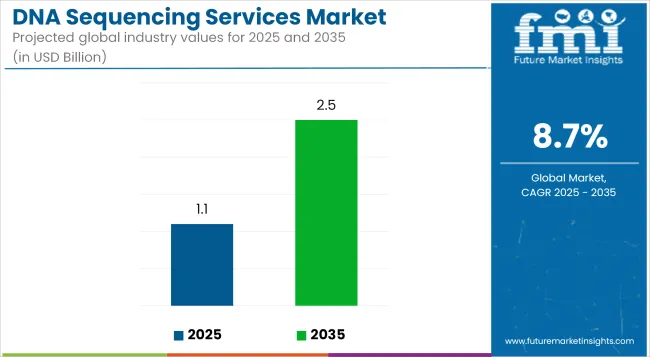
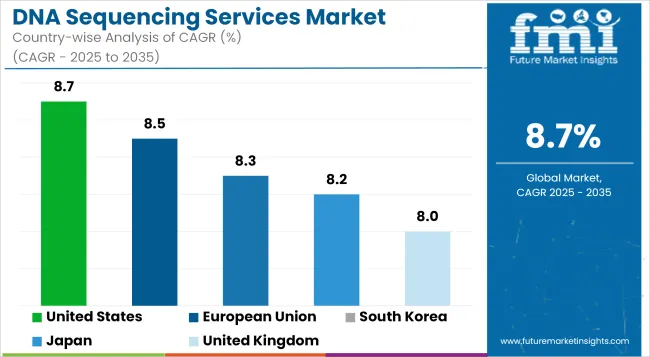
The global DNA sequencing services market is anticipated to be valued at US$ 945.6 million in 2023. The market is forecast to expand at a CAGR of 8.2% from 2023 to 2033, valued at US$ 2,080.2 million by 2033. Growth is attributed to the increase in cancer cases around the world.

DNA sequencing determines the sequence of the four DNA bases: adenine, thymine, guanine, and cytosine. Adenine (A) always pairs with thymine (T); cytosine (C) always pairs with guanine (G). The sequencing of the DNA base pairs is important to establish the genetic information to be used further in determining regulatory instructions, gene positioning, and others.

Data Points Key Statistics
Growth Rate (2018 to 2022) US$ 6.7% CAGR
Expected Market Value (2023) US$ 945.6 million
Anticipated Forecast Value (2033) US$ 2,080.2 million
Projected Growth Rate (2023 to 2033) 8.2% CAGR

DNA sequencing has been used as an important tool in diagnosing chronic diseases as it highlights changes in the gene that causes disease. During the time of cell division, the base pairs are copied, and this is the fact that most of the experiments are carried out on the DNA bases.

Rapid advancements in sequencing technology and bioinformatics have enabled the identification of DNA variations, which are expected to boost the growth of the DNA sequencing services industry during the forecast period.

On the other hand, ethical and legal limitation associated with NGS is one of the crucial factors expected to hamper the growth of the DNA sequencing services industry over the analysis period.

Don't pay for what you don't need

Customize your report by selecting specific countries or regions and save 30%!

Some Prominent Drivers Spearheading DNA Sequencing Services Market Growth

Factors such as the increase in cancer cases around the world, rising research studies, increasing collaborations between research institutes and market players, as well as rising applications of DNA next-generation sequencing and technological advancements in sequencing technologies, are all expected to accelerate the growth of the DNA sequencing services industry over the analysis period.

The need for DNA sequencing methods is expected to expand as research and development activities for treatments to treat genetic disorders increase. Substantial market demand may be created as research and development investments increase and studies related to treating genetic disorders among individuals grow.

Governments in industrialized economies have implemented programs and laws to encourage scientists and researchers to explore treatments for chronic and rare diseases.

Hospitals choose DNA sequencing techniques because they can deliver clinical diagnosis in less time, which helps the market grow. In addition, DNA sequencing can be utilized to collect the most up-to-date data and identify transmission links to avoid infections across hospital settings. All these factors are expected to propel the growth of the DNA sequencing services industry during the forecast period.

Challenges Faced by the DNA Sequencing Services Industry

The need for more skilled professionals is a key factor expected to hamper the growth of the DNA sequencing services market during the forecast period. Additionally, ethical and legal limitation associated with NGS is another key factor expected to impede the market growth over the analysis period.

Sabyasachi Ghosh
Sabyasachi Ghosh

Principal Consultant

Talk to Analyst

Find your sweet spots for generating winning opportunities in this market.

North America May Emerging as an Opportunistic DNA Sequencing Services Market

Region North America
Market Share % (2022) 40.6%

Regarding regional platforms, North America holds a significant market share in DNA sequencing services industry.

North America is the biggest DNA sequencing services industry market, attributed to several clinical laboratories that use NGS to offer genetic testing services, which drives the regional market.

Europe is Contributing Profoundly to the Growth of the DNA Sequencing Services Market

Region Europe
Market Share % (2022) 32.4%

According to Future Market Insights, Europe is expected to provide immense growth opportunities for DNA sequencing services and reach a significant share of more than 32.4% in 2023.

The DNA sequencing services market in Europe is expected to witness significant market growth, owing to many prominent market players in the region.

Get the data you need at a Fraction of the cost

Personalize your report by choosing insights you need
and save 40%!

Role of Start-ups in the DNA Sequencing Services Market

Prominent market players in the DNA sequencing services industry are working hand-in-hand to provide the best-in-class DNA sequencing services for enhancing the global genetics arena.

However, many global start-ups in the DNA sequencing services market are stepping forward to match the requirements of the DNA sequencing services domain.

  • Hesaam Esfandyarpour founded Genapsys, a California-based company that develops DNA sequencing technologies and systems, in 2010. GenapSys raised US$ 75 million in February 2020 to fund the global expansion of its tabletop DNA sequencer to aid in the control of coronavirus in the region.
  • Otogenetics Corporation is a privately held corporation founded in 2007. The company's headquarters are in Atlanta, Georgia, the United States. Otogenetics Corporation, a high throughput NGS clinical laboratory, entered into an agreement with Swift Biosciences, Inc. in July 2020 to supply Swift 2S Turbo DNA Library Kits to ramp up its NGS-based clinical services.

Global Startups of DNA Sequencing Services Market

  • Ganit Labs
  • LifeCell International
  • Theramyt Novobiologics
  • Vitas Pharma Research
  • Achira Labs
  • BGI Genomics
  • Pacific Biosciences of California
  • New England Biolabs
  • GenapSys Inc.

Market Competition

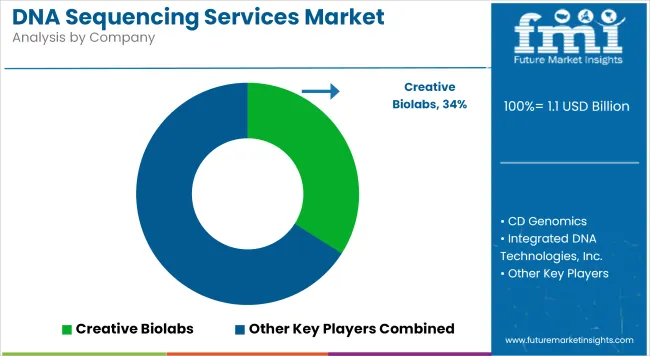
Some key participants present in the global DNA sequencing services market include Illumina Inc., Thermo Fischer Scientific Inc., Oxford Nanopore Technologies Plc, Agilent Technologies, Inc., QIAGEN, Eurofins Scientific, F. Hoffmann-La Roche Ltd., Takara Bio Inc., GENEWIZ, Inc., Hamilton Company, Macrogen Inc., Zymo Research Corporation, and Tecan Trading AG, among others.

Due to the presence of several leading participants, the market is highly competitive. Global players such as Illumina Inc., Thermo Fischer Scientific Inc., and Oxford Nanopore Technologies plc. Account for a considerable market size, several regional-level players are also operating across key growth regions, particularly in North America.

Recent Developments

  • In December 2020, Eurofins Genomics released SARS-CoV-2 NGS services that are both cost-effective and optimized, allowing for entire viral genome sequencing.
  • In May 2020, Roche introduced the KAPA Target Enrichment portfolio and the KAPA HyperExome whole-exome research panel for target enrichment during sequencing.
  • Illumina recently received Emergency Use Authorization (EUA) from the FDA for its COVIDSeq Test, which is used to sequence the entire genome of the novel SARS-CoV-2 virus.
  • Face2Gene LABS was launched in June 2019 by PerkinElmer, Inc. and FDNA, an artificial intelligence company, to provide genomic services in conjunction with Next-Generation Phenotyping (NGP) technologies for more accurate and efficient diagnoses.

Report Scope

Attribute Details
Growth Rate CAGR of 8.2% from 2023 to 2033
Market Value in 2023 US$ 945.6 million
Market Value in 2033 US$ 2,080.2 million
Base Year for Estimation 2022
Historical Data 2018 to 2022
Forecast Period 2023 to 2033
Quantitative Units Revenue in US$ million, and CAGR from 2023 to 2033
Report Coverage Revenue Forecast, Volume Forecast, Company Ranking, Competitive Landscape, Growth Factors, Trends and Pricing Analysis
Segments Covered
  • Product Type
  • End Use
  • Application
  • Region
Regions Covered
  • North America
  • Latin America
  • Europe
  • Asia Pacific
  • The Middle East and Africa
Key Countries Profiled
  • The United States
  • Canada
  • Brazil
  • Mexico
  • Germany
  • The United Kingdom
  • France
  • Spain
  • Italy
  • China
  • Japan
  • South Korea
  • India
  • Malaysia
  • Singapore
  • Australia
  • New Zealand
  • GCC
  • South Africa
  • Israel
Key Companies Profiled
  • Thermo Fisher Scientific Inc.
  • Abbott Laboratories
  • GE Healthcare
  • Merck KGaA
  • Agilent Technologies Inc.
  • Roche Holdings AG
  • Pacific Biosciences
  • Illumina Inc.
  • Bio-Rad Laboratories Inc.
Customization Available Upon Request

Key Segments Profiled in The DNA Sequencing Services Industry Survey

By Product Type:

  • Maxam–Gilbert DNA Sequencing
  • Chain-Termination Methods
  • Dye-Terminator Sequencing
  • Automation and Sample Preparation
  • Large-scale DNA Sequencing
  • New DNA Sequencing Methods
  • High Throughput DNA Sequencing
  • Parallel Signature Sequencing (MPSS)
  • Polony Sequencing
  • Pyrosequencing
  • Illumina (Solexa) Sequencing
  • SOLiD Sequencing
  • Others

By End Use:

  • Automotive Industry
  • Chemical Industry
  • Agriculture
  • Oil and Gas
  • Research and Development
  • Other End Uses

By Application:

  • Hospitals
  • Diagnostic Centers
  • Biotechnology and Pharmaceutical Industry
  • Academic Research Institutes
  • Other Application Areas

By Region:

  • North America
  • Latin America
  • Europe
  • Asia Pacific
  • The Middle East & Africa

Frequently Asked Questions

What is the Current Market Valuation?

The market is estimated to secure a valuation of US$ 945.6 million in 2023.

What is the Growth Forecast for the Market?

The market is forecast to register a CAGR of 8.2% through 2033.

How is the Historical Performance of the Market?

The market expanded at a CAGR of 6.7%

Which is the Top Trend in the Market?

Advances in sequencing and bioinformatics DNA variations are the top trend.

What is the Projected Size of the Market by 2033?

The global market size is estimated to reach US$ 2,080.2 million by 2033.

Table of Content

1. Executive Summary

    1.1. Global Market Outlook

    1.2. Demand-side Trends

    1.3. Supply-side Trends

    1.4. Technology Roadmap Analysis

    1.5. Analysis and Recommendations

2. Market Overview

    2.1. Market Coverage / Taxonomy

    2.2. Market Definition / Scope / Limitations

3. Market Background

    3.1. Market Dynamics

        3.1.1. Drivers

        3.1.2. Restraints

        3.1.3. Opportunity

        3.1.4. Trends

    3.2. Scenario Forecast

        3.2.1. Demand in Optimistic Scenario

        3.2.2. Demand in Likely Scenario

        3.2.3. Demand in Conservative Scenario

    3.3. Opportunity Map Analysis

    3.4. Investment Feasibility Matrix

    3.5. PESTLE and Porter’s Analysis

    3.6. Regulatory Landscape

        3.6.1. By Key Regions

        3.6.2. By Key Countries

    3.7. Regional Parent Market Outlook

4. Global Market Analysis 2018 to 2022 and Forecast, 2023 to 2033

    4.1. Historical Market Size Value (US$ Million) Analysis, 2018 to 2022

    4.2. Current and Future Market Size Value (US$ Million) Projections, 2023 to 2033

        4.2.1. Y-o-Y Growth Trend Analysis

        4.2.2. Absolute $ Opportunity Analysis

5. Global Market Analysis 2018 to 2022 and Forecast 2023 to 2033, By Product Type

    5.1. Introduction / Key Findings

    5.2. Historical Market Size Value (US$ Million) Analysis By Product Type, 2018 to 2022

    5.3. Current and Future Market Size Value (US$ Million) Analysis and Forecast By Product Type, 2023 to 2033

        5.3.1. Maxam–Gilbert DNA Sequencing

        5.3.2. Chain-Termination Methods

        5.3.3. Dye-Terminator Sequencing

        5.3.4. Automation and Sample Preparation

        5.3.5. Large-Scale DNA Sequencing

        5.3.6. New DNA Sequencing Methods

        5.3.7. High Throughput DNA Sequencing

        5.3.8. Parallel Signature Sequencing (MPSS)

        5.3.9. Polony Sequencing

        5.3.10. Pyrosequencing

        5.3.11. SOLiD Sequencing

        5.3.12. Others

    5.4. Y-o-Y Growth Trend Analysis By Product Type, 2018 to 2022

    5.5. Absolute $ Opportunity Analysis By Product Type, 2023 to 2033

6. Global Market Analysis 2018 to 2022 and Forecast 2023 to 2033, By Application

    6.1. Introduction / Key Findings

    6.2. Historical Market Size Value (US$ Million) Analysis By Application, 2018 to 2022

    6.3. Current and Future Market Size Value (US$ Million) Analysis and Forecast By Application, 2023 to 2033

        6.3.1. Clinical Investigation

        6.3.2. Oncology

        6.3.3. Forensics & Agrigenomics

        6.3.4. Reproductive Health

        6.3.5. HLA Typing

        6.3.6. Others

    6.4. Y-o-Y Growth Trend Analysis By Application, 2018 to 2022

    6.5. Absolute $ Opportunity Analysis By Application, 2023 to 2033

7. Global Market Analysis 2018 to 2022 and Forecast 2023 to 2033, By End-Use

    7.1. Introduction / Key Findings

    7.2. Historical Market Size Value (US$ Million) Analysis by End-Use, 2018 to 2022

    7.3. Current and Future Market Size Value (US$ Million) Analysis and Forecast by End-Use, 2023 to 2033

        7.3.1. Clinical Research

        7.3.2. Academic Research

        7.3.3. Biotechnology & Pharmaceutical Companies

        7.3.4. Hospitals & Clinics

        7.3.5. Others

    7.4. Y-o-Y Growth Trend Analysis by End-Use, 2018 to 2022

    7.5. Absolute $ Opportunity Analysis by End-Use, 2023 to 2033

8. Global Market Analysis 2018 to 2022 and Forecast 2023 to 2033, By Region

    8.1. Introduction

    8.2. Historical Market Size Value (US$ Million) Analysis By Region, 2018 to 2022

    8.3. Current Market Size Value (US$ Million) Analysis and Forecast By Region, 2023 to 2033

        8.3.1. North America

        8.3.2. Latin America

        8.3.3. Western Europe

        8.3.4. Eastern Europe

        8.3.5. South Asia and Pacific

        8.3.6. East Asia

        8.3.7. Middle East and Africa

    8.4. Market Attractiveness Analysis By Region

9. North America Market Analysis 2018 to 2022 and Forecast 2023 to 2033, By Country

    9.1. Historical Market Size Value (US$ Million) Trend Analysis By Market Taxonomy, 2018 to 2022

    9.2. Market Size Value (US$ Million) Forecast By Market Taxonomy, 2023 to 2033

        9.2.1. By Country

            9.2.1.1. The USA

            9.2.1.2. Canada

        9.2.2. By Product Type

        9.2.3. By Application

        9.2.4. By End-Use

    9.3. Market Attractiveness Analysis

        9.3.1. By Country

        9.3.2. By Product Type

        9.3.3. By Application

        9.3.4. By End-Use

    9.4. Key Takeaways

10. Latin America Market Analysis 2018 to 2022 and Forecast 2023 to 2033, By Country

    10.1. Historical Market Size Value (US$ Million) Trend Analysis By Market Taxonomy, 2018 to 2022

    10.2. Market Size Value (US$ Million) Forecast By Market Taxonomy, 2023 to 2033

        10.2.1. By Country

            10.2.1.1. Brazil

            10.2.1.2. Mexico

            10.2.1.3. Rest of Latin America

        10.2.2. By Product Type

        10.2.3. By Application

        10.2.4. By End-Use

    10.3. Market Attractiveness Analysis

        10.3.1. By Country

        10.3.2. By Product Type

        10.3.3. By Application

        10.3.4. By End-Use

    10.4. Key Takeaways

11. Western Europe Market Analysis 2018 to 2022 and Forecast 2023 to 2033, By Country

    11.1. Historical Market Size Value (US$ Million) Trend Analysis By Market Taxonomy, 2018 to 2022

    11.2. Market Size Value (US$ Million) Forecast By Market Taxonomy, 2023 to 2033

        11.2.1. By Country

            11.2.1.1. Germany

            11.2.1.2. United Kingdom

            11.2.1.3. France

            11.2.1.4. Spain

            11.2.1.5. Italy

            11.2.1.6. Rest of Western Europe

        11.2.2. By Product Type

        11.2.3. By Application

        11.2.4. By End-Use

    11.3. Market Attractiveness Analysis

        11.3.1. By Country

        11.3.2. By Product Type

        11.3.3. By Application

        11.3.4. By End-Use

    11.4. Key Takeaways

12. Eastern Europe Market Analysis 2018 to 2022 and Forecast 2023 to 2033, By Country

    12.1. Historical Market Size Value (US$ Million) Trend Analysis By Market Taxonomy, 2018 to 2022

    12.2. Market Size Value (US$ Million) Forecast By Market Taxonomy, 2023 to 2033

        12.2.1. By Country

            12.2.1.1. Poland

            12.2.1.2. Russia

            12.2.1.3. Czech Republic

            12.2.1.4. Romania

            12.2.1.5. Rest of Eastern Europe

        12.2.2. By Product Type

        12.2.3. By Application

        12.2.4. By End-Use

    12.3. Market Attractiveness Analysis

        12.3.1. By Country

        12.3.2. By Product Type

        12.3.3. By Application

        12.3.4. By End-Use

    12.4. Key Takeaways

13. South Asia and Pacific Market Analysis 2018 to 2022 and Forecast 2023 to 2033, By Country

    13.1. Historical Market Size Value (US$ Million) Trend Analysis By Market Taxonomy, 2018 to 2022

    13.2. Market Size Value (US$ Million) Forecast By Market Taxonomy, 2023 to 2033

        13.2.1. By Country

            13.2.1.1. India

            13.2.1.2. Bangladesh

            13.2.1.3. Australia

            13.2.1.4. New Zealand

            13.2.1.5. Rest of South Asia and Pacific

        13.2.2. By Product Type

        13.2.3. By Application

        13.2.4. By End-Use

    13.3. Market Attractiveness Analysis

        13.3.1. By Country

        13.3.2. By Product Type

        13.3.3. By Application

        13.3.4. By End-Use

    13.4. Key Takeaways

14. East Asia Market Analysis 2018 to 2022 and Forecast 2023 to 2033, By Country

    14.1. Historical Market Size Value (US$ Million) Trend Analysis By Market Taxonomy, 2018 to 2022

    14.2. Market Size Value (US$ Million) Forecast By Market Taxonomy, 2023 to 2033

        14.2.1. By Country

            14.2.1.1. China

            14.2.1.2. Japan

            14.2.1.3. South Korea

        14.2.2. By Product Type

        14.2.3. By Application

        14.2.4. By End-Use

    14.3. Market Attractiveness Analysis

        14.3.1. By Country

        14.3.2. By Product Type

        14.3.3. By Application

        14.3.4. By End-Use

    14.4. Key Takeaways

15. Middle East and Africa Market Analysis 2018 to 2022 and Forecast 2023 to 2033, By Country

    15.1. Historical Market Size Value (US$ Million) Trend Analysis By Market Taxonomy, 2018 to 2022

    15.2. Market Size Value (US$ Million) Forecast By Market Taxonomy, 2023 to 2033

        15.2.1. By Country

            15.2.1.1. GCC Countries

            15.2.1.2. South Africa

            15.2.1.3. Israel

            15.2.1.4. Rest of MEA

        15.2.2. By Product Type

        15.2.3. By Application

        15.2.4. By End-Use

    15.3. Market Attractiveness Analysis

        15.3.1. By Country

        15.3.2. By Product Type

        15.3.3. By Application

        15.3.4. By End-Use

    15.4. Key Takeaways

16. Key Countries Market Analysis

    16.1. USA

        16.1.1. Pricing Analysis

        16.1.2. Market Share Analysis, 2022

            16.1.2.1. By Product Type

            16.1.2.2. By Application

            16.1.2.3. By End-Use

    16.2. Canada

        16.2.1. Pricing Analysis

        16.2.2. Market Share Analysis, 2022

            16.2.2.1. By Product Type

            16.2.2.2. By Application

            16.2.2.3. By End-Use

    16.3. Brazil

        16.3.1. Pricing Analysis

        16.3.2. Market Share Analysis, 2022

            16.3.2.1. By Product Type

            16.3.2.2. By Application

            16.3.2.3. By End-Use

    16.4. Mexico

        16.4.1. Pricing Analysis

        16.4.2. Market Share Analysis, 2022

            16.4.2.1. By Product Type

            16.4.2.2. By Application

            16.4.2.3. By End-Use

    16.5. Germany

        16.5.1. Pricing Analysis

        16.5.2. Market Share Analysis, 2022

            16.5.2.1. By Product Type

            16.5.2.2. By Application

            16.5.2.3. By End-Use

    16.6. United Kingdom

        16.6.1. Pricing Analysis

        16.6.2. Market Share Analysis, 2022

            16.6.2.1. By Product Type

            16.6.2.2. By Application

            16.6.2.3. By End-Use

    16.7. France

        16.7.1. Pricing Analysis

        16.7.2. Market Share Analysis, 2022

            16.7.2.1. By Product Type

            16.7.2.2. By Application

            16.7.2.3. By End-Use

    16.8. Spain

        16.8.1. Pricing Analysis

        16.8.2. Market Share Analysis, 2022

            16.8.2.1. By Product Type

            16.8.2.2. By Application

            16.8.2.3. By End-Use

    16.9. Italy

        16.9.1. Pricing Analysis

        16.9.2. Market Share Analysis, 2022

            16.9.2.1. By Product Type

            16.9.2.2. By Application

            16.9.2.3. By End-Use

    16.10. Poland

        16.10.1. Pricing Analysis

        16.10.2. Market Share Analysis, 2022

            16.10.2.1. By Product Type

            16.10.2.2. By Application

            16.10.2.3. By End-Use

    16.11. Russia

        16.11.1. Pricing Analysis

        16.11.2. Market Share Analysis, 2022

            16.11.2.1. By Product Type

            16.11.2.2. By Application

            16.11.2.3. By End-Use

    16.12. Czech Republic

        16.12.1. Pricing Analysis

        16.12.2. Market Share Analysis, 2022

            16.12.2.1. By Product Type

            16.12.2.2. By Application

            16.12.2.3. By End-Use

    16.13. Romania

        16.13.1. Pricing Analysis

        16.13.2. Market Share Analysis, 2022

            16.13.2.1. By Product Type

            16.13.2.2. By Application

            16.13.2.3. By End-Use

    16.14. India

        16.14.1. Pricing Analysis

        16.14.2. Market Share Analysis, 2022

            16.14.2.1. By Product Type

            16.14.2.2. By Application

            16.14.2.3. By End-Use

    16.15. Bangladesh

        16.15.1. Pricing Analysis

        16.15.2. Market Share Analysis, 2022

            16.15.2.1. By Product Type

            16.15.2.2. By Application

            16.15.2.3. By End-Use

    16.16. Australia

        16.16.1. Pricing Analysis

        16.16.2. Market Share Analysis, 2022

            16.16.2.1. By Product Type

            16.16.2.2. By Application

            16.16.2.3. By End-Use

    16.17. New Zealand

        16.17.1. Pricing Analysis

        16.17.2. Market Share Analysis, 2022

            16.17.2.1. By Product Type

            16.17.2.2. By Application

            16.17.2.3. By End-Use

    16.18. China

        16.18.1. Pricing Analysis

        16.18.2. Market Share Analysis, 2022

            16.18.2.1. By Product Type

            16.18.2.2. By Application

            16.18.2.3. By End-Use

    16.19. Japan

        16.19.1. Pricing Analysis

        16.19.2. Market Share Analysis, 2022

            16.19.2.1. By Product Type

            16.19.2.2. By Application

            16.19.2.3. By End-Use

    16.20. South Korea

        16.20.1. Pricing Analysis

        16.20.2. Market Share Analysis, 2022

            16.20.2.1. By Product Type

            16.20.2.2. By Application

            16.20.2.3. By End-Use

    16.21. GCC Countries

        16.21.1. Pricing Analysis

        16.21.2. Market Share Analysis, 2022

            16.21.2.1. By Product Type

            16.21.2.2. By Application

            16.21.2.3. By End-Use

    16.22. South Africa

        16.22.1. Pricing Analysis

        16.22.2. Market Share Analysis, 2022

            16.22.2.1. By Product Type

            16.22.2.2. By Application

            16.22.2.3. By End-Use

    16.23. Israel

        16.23.1. Pricing Analysis

        16.23.2. Market Share Analysis, 2022

            16.23.2.1. By Product Type

            16.23.2.2. By Application

            16.23.2.3. By End-Use

17. Market Structure Analysis

    17.1. Competition Dashboard

    17.2. Competition Benchmarking

    17.3. Market Share Analysis of Top Players

        17.3.1. By Regional

        17.3.2. By Product Type

        17.3.3. By Application

        17.3.4. By End-Use

18. Competition Analysis

    18.1. Competition Deep Dive

        18.1.1. Thermo Fisher Scientific Inc.

            18.1.1.1. Overview

            18.1.1.2. Product Portfolio

            18.1.1.3. Profitability by Market Segments

            18.1.1.4. Sales Footprint

            18.1.1.5. Strategy Overview

                18.1.1.5.1. Marketing Strategy

        18.1.2. Abbott Laboratories

            18.1.2.1. Overview

            18.1.2.2. Product Portfolio

            18.1.2.3. Profitability by Market Segments

            18.1.2.4. Sales Footprint

            18.1.2.5. Strategy Overview

                18.1.2.5.1. Marketing Strategy

        18.1.3. GE Healthcare

            18.1.3.1. Overview

            18.1.3.2. Product Portfolio

            18.1.3.3. Profitability by Market Segments

            18.1.3.4. Sales Footprint

            18.1.3.5. Strategy Overview

                18.1.3.5.1. Marketing Strategy

        18.1.4. Merck KGaA

            18.1.4.1. Overview

            18.1.4.2. Product Portfolio

            18.1.4.3. Profitability by Market Segments

            18.1.4.4. Sales Footprint

            18.1.4.5. Strategy Overview

                18.1.4.5.1. Marketing Strategy

        18.1.5. Agilent Technologies Inc.

            18.1.5.1. Overview

            18.1.5.2. Product Portfolio

            18.1.5.3. Profitability by Market Segments

            18.1.5.4. Sales Footprint

            18.1.5.5. Strategy Overview

                18.1.5.5.1. Marketing Strategy

        18.1.6. Roche Holdings AG

            18.1.6.1. Overview

            18.1.6.2. Product Portfolio

            18.1.6.3. Profitability by Market Segments

            18.1.6.4. Sales Footprint

            18.1.6.5. Strategy Overview

                18.1.6.5.1. Marketing Strategy

        18.1.7. Pacific Biosciences

            18.1.7.1. Overview

            18.1.7.2. Product Portfolio

            18.1.7.3. Profitability by Market Segments

            18.1.7.4. Sales Footprint

            18.1.7.5. Strategy Overview

                18.1.7.5.1. Marketing Strategy

        18.1.8. Illumina Inc.

            18.1.8.1. Overview

            18.1.8.2. Product Portfolio

            18.1.8.3. Profitability by Market Segments

            18.1.8.4. Sales Footprint

            18.1.8.5. Strategy Overview

                18.1.8.5.1. Marketing Strategy

        18.1.9. Bio-Rad Laboratories Inc.

            18.1.9.1. Overview

            18.1.9.2. Product Portfolio

            18.1.9.3. Profitability by Market Segments

            18.1.9.4. Sales Footprint

            18.1.9.5. Strategy Overview

                18.1.9.5.1. Marketing Strategy

        18.1.10. Myriad Genetics

            18.1.10.1. Overview

            18.1.10.2. Product Portfolio

            18.1.10.3. Profitability by Market Segments

            18.1.10.4. Sales Footprint

            18.1.10.5. Strategy Overview

                18.1.10.5.1. Marketing Strategy

19. Assumptions & Acronyms Used

20. Research Methodology

Don't pay for what you don't need

Customize your report by selecting specific countries or regions and save 30%!

List of Tables

Table 1: Global Market Value (US$ Million) Forecast by Region, 2018 to 2033

Table 2: Global Market Value (US$ Million) Forecast by Product Type, 2018 to 2033

Table 3: Global Market Value (US$ Million) Forecast by Application, 2018 to 2033

Table 4: Global Market Value (US$ Million) Forecast by End-Use, 2018 to 2033

Table 5: North America Market Value (US$ Million) Forecast by Country, 2018 to 2033

Table 6: North America Market Value (US$ Million) Forecast by Product Type, 2018 to 2033

Table 7: North America Market Value (US$ Million) Forecast by Application, 2018 to 2033

Table 8: North America Market Value (US$ Million) Forecast by End-Use, 2018 to 2033

Table 9: Latin America Market Value (US$ Million) Forecast by Country, 2018 to 2033

Table 10: Latin America Market Value (US$ Million) Forecast by Product Type, 2018 to 2033

Table 11: Latin America Market Value (US$ Million) Forecast by Application, 2018 to 2033

Table 12: Latin America Market Value (US$ Million) Forecast by End-Use, 2018 to 2033

Table 13: Western Europe Market Value (US$ Million) Forecast by Country, 2018 to 2033

Table 14: Western Europe Market Value (US$ Million) Forecast by Product Type, 2018 to 2033

Table 15: Western Europe Market Value (US$ Million) Forecast by Application, 2018 to 2033

Table 16: Western Europe Market Value (US$ Million) Forecast by End-Use, 2018 to 2033

Table 17: Eastern Europe Market Value (US$ Million) Forecast by Country, 2018 to 2033

Table 18: Eastern Europe Market Value (US$ Million) Forecast by Product Type, 2018 to 2033

Table 19: Eastern Europe Market Value (US$ Million) Forecast by Application, 2018 to 2033

Table 20: Eastern Europe Market Value (US$ Million) Forecast by End-Use, 2018 to 2033

Table 21: South Asia and Pacific Market Value (US$ Million) Forecast by Country, 2018 to 2033

Table 22: South Asia and Pacific Market Value (US$ Million) Forecast by Product Type, 2018 to 2033

Table 23: South Asia and Pacific Market Value (US$ Million) Forecast by Application, 2018 to 2033

Table 24: South Asia and Pacific Market Value (US$ Million) Forecast by End-Use, 2018 to 2033

Table 25: East Asia Market Value (US$ Million) Forecast by Country, 2018 to 2033

Table 26: East Asia Market Value (US$ Million) Forecast by Product Type, 2018 to 2033

Table 27: East Asia Market Value (US$ Million) Forecast by Application, 2018 to 2033

Table 28: East Asia Market Value (US$ Million) Forecast by End-Use, 2018 to 2033

Table 29: Middle East and Africa Market Value (US$ Million) Forecast by Country, 2018 to 2033

Table 30: Middle East and Africa Market Value (US$ Million) Forecast by Product Type, 2018 to 2033

Table 31: Middle East and Africa Market Value (US$ Million) Forecast by Application, 2018 to 2033

Table 32: Middle East and Africa Market Value (US$ Million) Forecast by End-Use, 2018 to 2033
Sabyasachi Ghosh
Sabyasachi Ghosh

Principal Consultant

Talk to Analyst

Find your sweet spots for generating winning opportunities in this market.

List of Charts

Figure 1: Global Market Value (US$ Million) by Product Type, 2023 to 2033

Figure 2: Global Market Value (US$ Million) by Application, 2023 to 2033

Figure 3: Global Market Value (US$ Million) by End-Use, 2023 to 2033

Figure 4: Global Market Value (US$ Million) by Region, 2023 to 2033

Figure 5: Global Market Value (US$ Million) Analysis by Region, 2018 to 2033

Figure 6: Global Market Value Share (%) and BPS Analysis by Region, 2023 to 2033

Figure 7: Global Market Y-o-Y Growth (%) Projections by Region, 2023 to 2033

Figure 8: Global Market Value (US$ Million) Analysis by Product Type, 2018 to 2033

Figure 9: Global Market Value Share (%) and BPS Analysis by Product Type, 2023 to 2033

Figure 10: Global Market Y-o-Y Growth (%) Projections by Product Type, 2023 to 2033

Figure 11: Global Market Value (US$ Million) Analysis by Application, 2018 to 2033

Figure 12: Global Market Value Share (%) and BPS Analysis by Application, 2023 to 2033

Figure 13: Global Market Y-o-Y Growth (%) Projections by Application, 2023 to 2033

Figure 14: Global Market Value (US$ Million) Analysis by End-Use, 2018 to 2033

Figure 15: Global Market Value Share (%) and BPS Analysis by End-Use, 2023 to 2033

Figure 16: Global Market Y-o-Y Growth (%) Projections by End-Use, 2023 to 2033

Figure 17: Global Market Attractiveness by Product Type, 2023 to 2033

Figure 18: Global Market Attractiveness by Application, 2023 to 2033

Figure 19: Global Market Attractiveness by End-Use, 2023 to 2033

Figure 20: Global Market Attractiveness by Region, 2023 to 2033

Figure 21: North America Market Value (US$ Million) by Product Type, 2023 to 2033

Figure 22: North America Market Value (US$ Million) by Application, 2023 to 2033

Figure 23: North America Market Value (US$ Million) by End-Use, 2023 to 2033

Figure 24: North America Market Value (US$ Million) by Country, 2023 to 2033

Figure 25: North America Market Value (US$ Million) Analysis by Country, 2018 to 2033

Figure 26: North America Market Value Share (%) and BPS Analysis by Country, 2023 to 2033

Figure 27: North America Market Y-o-Y Growth (%) Projections by Country, 2023 to 2033

Figure 28: North America Market Value (US$ Million) Analysis by Product Type, 2018 to 2033

Figure 29: North America Market Value Share (%) and BPS Analysis by Product Type, 2023 to 2033

Figure 30: North America Market Y-o-Y Growth (%) Projections by Product Type, 2023 to 2033

Figure 31: North America Market Value (US$ Million) Analysis by Application, 2018 to 2033

Figure 32: North America Market Value Share (%) and BPS Analysis by Application, 2023 to 2033

Figure 33: North America Market Y-o-Y Growth (%) Projections by Application, 2023 to 2033

Figure 34: North America Market Value (US$ Million) Analysis by End-Use, 2018 to 2033

Figure 35: North America Market Value Share (%) and BPS Analysis by End-Use, 2023 to 2033

Figure 36: North America Market Y-o-Y Growth (%) Projections by End-Use, 2023 to 2033

Figure 37: North America Market Attractiveness by Product Type, 2023 to 2033

Figure 38: North America Market Attractiveness by Application, 2023 to 2033

Figure 39: North America Market Attractiveness by End-Use, 2023 to 2033

Figure 40: North America Market Attractiveness by Country, 2023 to 2033

Figure 41: Latin America Market Value (US$ Million) by Product Type, 2023 to 2033

Figure 42: Latin America Market Value (US$ Million) by Application, 2023 to 2033

Figure 43: Latin America Market Value (US$ Million) by End-Use, 2023 to 2033

Figure 44: Latin America Market Value (US$ Million) by Country, 2023 to 2033

Figure 45: Latin America Market Value (US$ Million) Analysis by Country, 2018 to 2033

Figure 46: Latin America Market Value Share (%) and BPS Analysis by Country, 2023 to 2033

Figure 47: Latin America Market Y-o-Y Growth (%) Projections by Country, 2023 to 2033

Figure 48: Latin America Market Value (US$ Million) Analysis by Product Type, 2018 to 2033

Figure 49: Latin America Market Value Share (%) and BPS Analysis by Product Type, 2023 to 2033

Figure 50: Latin America Market Y-o-Y Growth (%) Projections by Product Type, 2023 to 2033

Figure 51: Latin America Market Value (US$ Million) Analysis by Application, 2018 to 2033

Figure 52: Latin America Market Value Share (%) and BPS Analysis by Application, 2023 to 2033

Figure 53: Latin America Market Y-o-Y Growth (%) Projections by Application, 2023 to 2033

Figure 54: Latin America Market Value (US$ Million) Analysis by End-Use, 2018 to 2033

Figure 55: Latin America Market Value Share (%) and BPS Analysis by End-Use, 2023 to 2033

Figure 56: Latin America Market Y-o-Y Growth (%) Projections by End-Use, 2023 to 2033

Figure 57: Latin America Market Attractiveness by Product Type, 2023 to 2033

Figure 58: Latin America Market Attractiveness by Application, 2023 to 2033

Figure 59: Latin America Market Attractiveness by End-Use, 2023 to 2033

Figure 60: Latin America Market Attractiveness by Country, 2023 to 2033

Figure 61: Western Europe Market Value (US$ Million) by Product Type, 2023 to 2033

Figure 62: Western Europe Market Value (US$ Million) by Application, 2023 to 2033

Figure 63: Western Europe Market Value (US$ Million) by End-Use, 2023 to 2033

Figure 64: Western Europe Market Value (US$ Million) by Country, 2023 to 2033

Figure 65: Western Europe Market Value (US$ Million) Analysis by Country, 2018 to 2033

Figure 66: Western Europe Market Value Share (%) and BPS Analysis by Country, 2023 to 2033

Figure 67: Western Europe Market Y-o-Y Growth (%) Projections by Country, 2023 to 2033

Figure 68: Western Europe Market Value (US$ Million) Analysis by Product Type, 2018 to 2033

Figure 69: Western Europe Market Value Share (%) and BPS Analysis by Product Type, 2023 to 2033

Figure 70: Western Europe Market Y-o-Y Growth (%) Projections by Product Type, 2023 to 2033

Figure 71: Western Europe Market Value (US$ Million) Analysis by Application, 2018 to 2033

Figure 72: Western Europe Market Value Share (%) and BPS Analysis by Application, 2023 to 2033

Figure 73: Western Europe Market Y-o-Y Growth (%) Projections by Application, 2023 to 2033

Figure 74: Western Europe Market Value (US$ Million) Analysis by End-Use, 2018 to 2033

Figure 75: Western Europe Market Value Share (%) and BPS Analysis by End-Use, 2023 to 2033

Figure 76: Western Europe Market Y-o-Y Growth (%) Projections by End-Use, 2023 to 2033

Figure 77: Western Europe Market Attractiveness by Product Type, 2023 to 2033

Figure 78: Western Europe Market Attractiveness by Application, 2023 to 2033

Figure 79: Western Europe Market Attractiveness by End-Use, 2023 to 2033

Figure 80: Western Europe Market Attractiveness by Country, 2023 to 2033

Figure 81: Eastern Europe Market Value (US$ Million) by Product Type, 2023 to 2033

Figure 82: Eastern Europe Market Value (US$ Million) by Application, 2023 to 2033

Figure 83: Eastern Europe Market Value (US$ Million) by End-Use, 2023 to 2033

Figure 84: Eastern Europe Market Value (US$ Million) by Country, 2023 to 2033

Figure 85: Eastern Europe Market Value (US$ Million) Analysis by Country, 2018 to 2033

Figure 86: Eastern Europe Market Value Share (%) and BPS Analysis by Country, 2023 to 2033

Figure 87: Eastern Europe Market Y-o-Y Growth (%) Projections by Country, 2023 to 2033

Figure 88: Eastern Europe Market Value (US$ Million) Analysis by Product Type, 2018 to 2033

Figure 89: Eastern Europe Market Value Share (%) and BPS Analysis by Product Type, 2023 to 2033

Figure 90: Eastern Europe Market Y-o-Y Growth (%) Projections by Product Type, 2023 to 2033

Figure 91: Eastern Europe Market Value (US$ Million) Analysis by Application, 2018 to 2033

Figure 92: Eastern Europe Market Value Share (%) and BPS Analysis by Application, 2023 to 2033

Figure 93: Eastern Europe Market Y-o-Y Growth (%) Projections by Application, 2023 to 2033

Figure 94: Eastern Europe Market Value (US$ Million) Analysis by End-Use, 2018 to 2033

Figure 95: Eastern Europe Market Value Share (%) and BPS Analysis by End-Use, 2023 to 2033

Figure 96: Eastern Europe Market Y-o-Y Growth (%) Projections by End-Use, 2023 to 2033

Figure 97: Eastern Europe Market Attractiveness by Product Type, 2023 to 2033

Figure 98: Eastern Europe Market Attractiveness by Application, 2023 to 2033

Figure 99: Eastern Europe Market Attractiveness by End-Use, 2023 to 2033

Figure 100: Eastern Europe Market Attractiveness by Country, 2023 to 2033

Figure 101: South Asia and Pacific Market Value (US$ Million) by Product Type, 2023 to 2033

Figure 102: South Asia and Pacific Market Value (US$ Million) by Application, 2023 to 2033

Figure 103: South Asia and Pacific Market Value (US$ Million) by End-Use, 2023 to 2033

Figure 104: South Asia and Pacific Market Value (US$ Million) by Country, 2023 to 2033

Figure 105: South Asia and Pacific Market Value (US$ Million) Analysis by Country, 2018 to 2033

Figure 106: South Asia and Pacific Market Value Share (%) and BPS Analysis by Country, 2023 to 2033

Figure 107: South Asia and Pacific Market Y-o-Y Growth (%) Projections by Country, 2023 to 2033

Figure 108: South Asia and Pacific Market Value (US$ Million) Analysis by Product Type, 2018 to 2033

Figure 109: South Asia and Pacific Market Value Share (%) and BPS Analysis by Product Type, 2023 to 2033

Figure 110: South Asia and Pacific Market Y-o-Y Growth (%) Projections by Product Type, 2023 to 2033

Figure 111: South Asia and Pacific Market Value (US$ Million) Analysis by Application, 2018 to 2033

Figure 112: South Asia and Pacific Market Value Share (%) and BPS Analysis by Application, 2023 to 2033

Figure 113: South Asia and Pacific Market Y-o-Y Growth (%) Projections by Application, 2023 to 2033

Figure 114: South Asia and Pacific Market Value (US$ Million) Analysis by End-Use, 2018 to 2033

Figure 115: South Asia and Pacific Market Value Share (%) and BPS Analysis by End-Use, 2023 to 2033

Figure 116: South Asia and Pacific Market Y-o-Y Growth (%) Projections by End-Use, 2023 to 2033

Figure 117: South Asia and Pacific Market Attractiveness by Product Type, 2023 to 2033

Figure 118: South Asia and Pacific Market Attractiveness by Application, 2023 to 2033

Figure 119: South Asia and Pacific Market Attractiveness by End-Use, 2023 to 2033

Figure 120: South Asia and Pacific Market Attractiveness by Country, 2023 to 2033

Figure 121: East Asia Market Value (US$ Million) by Product Type, 2023 to 2033

Figure 122: East Asia Market Value (US$ Million) by Application, 2023 to 2033

Figure 123: East Asia Market Value (US$ Million) by End-Use, 2023 to 2033

Figure 124: East Asia Market Value (US$ Million) by Country, 2023 to 2033

Figure 125: East Asia Market Value (US$ Million) Analysis by Country, 2018 to 2033

Figure 126: East Asia Market Value Share (%) and BPS Analysis by Country, 2023 to 2033

Figure 127: East Asia Market Y-o-Y Growth (%) Projections by Country, 2023 to 2033

Figure 128: East Asia Market Value (US$ Million) Analysis by Product Type, 2018 to 2033

Figure 129: East Asia Market Value Share (%) and BPS Analysis by Product Type, 2023 to 2033

Figure 130: East Asia Market Y-o-Y Growth (%) Projections by Product Type, 2023 to 2033

Figure 131: East Asia Market Value (US$ Million) Analysis by Application, 2018 to 2033

Figure 132: East Asia Market Value Share (%) and BPS Analysis by Application, 2023 to 2033

Figure 133: East Asia Market Y-o-Y Growth (%) Projections by Application, 2023 to 2033

Figure 134: East Asia Market Value (US$ Million) Analysis by End-Use, 2018 to 2033

Figure 135: East Asia Market Value Share (%) and BPS Analysis by End-Use, 2023 to 2033

Figure 136: East Asia Market Y-o-Y Growth (%) Projections by End-Use, 2023 to 2033

Figure 137: East Asia Market Attractiveness by Product Type, 2023 to 2033

Figure 138: East Asia Market Attractiveness by Application, 2023 to 2033

Figure 139: East Asia Market Attractiveness by End-Use, 2023 to 2033

Figure 140: East Asia Market Attractiveness by Country, 2023 to 2033

Figure 141: Middle East and Africa Market Value (US$ Million) by Product Type, 2023 to 2033

Figure 142: Middle East and Africa Market Value (US$ Million) by Application, 2023 to 2033

Figure 143: Middle East and Africa Market Value (US$ Million) by End-Use, 2023 to 2033

Figure 144: Middle East and Africa Market Value (US$ Million) by Country, 2023 to 2033

Figure 145: Middle East and Africa Market Value (US$ Million) Analysis by Country, 2018 to 2033

Figure 146: Middle East and Africa Market Value Share (%) and BPS Analysis by Country, 2023 to 2033

Figure 147: Middle East and Africa Market Y-o-Y Growth (%) Projections by Country, 2023 to 2033

Figure 148: Middle East and Africa Market Value (US$ Million) Analysis by Product Type, 2018 to 2033

Figure 149: Middle East and Africa Market Value Share (%) and BPS Analysis by Product Type, 2023 to 2033

Figure 150: Middle East and Africa Market Y-o-Y Growth (%) Projections by Product Type, 2023 to 2033

Figure 151: Middle East and Africa Market Value (US$ Million) Analysis by Application, 2018 to 2033

Figure 152: Middle East and Africa Market Value Share (%) and BPS Analysis by Application, 2023 to 2033

Figure 153: Middle East and Africa Market Y-o-Y Growth (%) Projections by Application, 2023 to 2033

Figure 154: Middle East and Africa Market Value (US$ Million) Analysis by End-Use, 2018 to 2033

Figure 155: Middle East and Africa Market Value Share (%) and BPS Analysis by End-Use, 2023 to 2033

Figure 156: Middle East and Africa Market Y-o-Y Growth (%) Projections by End-Use, 2023 to 2033

Figure 157: Middle East and Africa Market Attractiveness by Product Type, 2023 to 2033

Figure 158: Middle East and Africa Market Attractiveness by Application, 2023 to 2033

Figure 159: Middle East and Africa Market Attractiveness by End-Use, 2023 to 2033

Figure 160: Middle East and Africa Market Attractiveness by Country, 2023 to 2033

Recommendations

Healthcare

Cell-free Fetal DNA Testing Market

Published : August 2023

Healthcare

DNA/RNA Extraction Market

Published : June 2023

Explore Healthcare Insights

View Reports

DNA Sequencing Services Market