DNA Methylation Market
Market Insights on DNA Methylation covering sales outlook, demand forecast & up-to-date key trends
DNA Methylation Market by Technology, Product, Application, End-Use & Region - Forecast 2022 - 2032
DNA Methylation Market Snapshot (2023-2033)
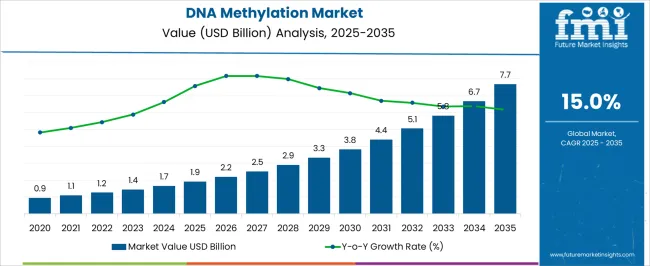
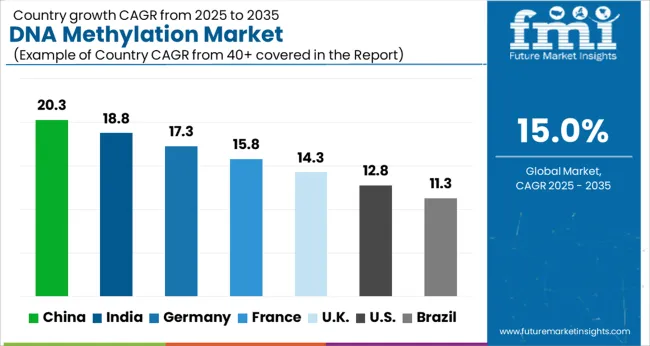
The global DNA methylation market is expected to garnered a market value of US$ 1437.5 Million in 2023 and is expected to accumulate a market value of US$ 5815.49 Million by registering a CAGR of 15% in the forecast period 2023-2033. Growth of the DNA methylation market can be attributed to increasing cases of cancer globally remains the primary driver of its anticipated growth. The market for DNA methylation registered a CAGR of 11% in the historical period 2016-2021.
Furthermore, the declining cost of treatment with streamlining of product approvals also remains a steady driver of growth. Significant government support for research and development activities with direct funding continues to open new opportunities for growth.
Report Attribute |
Details |
Expected Market Value (2023) |
US$ 1437.5 Million |
Anticipated Forecast Value (2033) |
US$ 5815.49 Million |
Projected Growth Rate (2023-2033) |
15% CAGR |
Let us know your requirement to get
100% FREE customization
2018-2022 DNA Methylation Market Demand Analysis vs. Forecast 2023-2033
According to market research and competitive intelligence provider Future Market Insights- the market for DNA methylation reflected a value of 9% during the historical period, 2017- 2021.
DNA methylation remains a promising technique to advance research in core areas of chronic disease treatment. In September 2022, researchers from the University of California published a journal in Nature Communications stating the potential application of cell-free DNA methylation as a promising biomarker for cancer detection at an early stage.
Thus, the market for DNA methylation is expected to register a CAGR of 16.30% in the forecast period 2023-2033.
Which are Some Prominent Drivers of DNA Methylation Market?
Accessibility to test kits increasing use of DNA methylation
The COVID-19 outbreak impacted the market negatively due to movement restrictions, which hindered research and testing at research centers and laboratories. However, post-pandemic, reopening of research institutions resulted in increased usage of DNA methylation. Moreover, the accessibility of a broad range of test kits has further created significant opportunities for market players.
The DNA methylation analysis technique helps scientists gain valuable insights into gene regulation and potential biomarkers identification. Abnormal DNA methylation has been associated with several disease processes, such as obesity, cancer, and others. It also promises potential application in agronomic research to study responses to temperature extremes, drought, and other environmental changes. In June 2022, a research article published in MDPI stated that DNA methylation is mostly studied in epigenetic marks in plants and other. It is considered as a sustainable source of variation contributing to crop production and health.
Advanced technology and next-generation technology favoring growth of DNA methylation market
Furthermore, various high-throughput technologies such as microarrays and next-generation sequencing (NGS) have facilitated studies related to genome-wide methylation profiling. These technologies offer ways to understand DNA methylation significance, providing insights into the functional effects of variation. For instance, in February 2021, Twist Bioscience launched NGS Methylation Detection System, which is to be used for the analysis of liquid biopsy cancer and epigenetic studies. This would further provide insight into disease pathology.
Find your sweet spots for generating winning opportunities in this market.
Talk to AnalystWhat are the Challenges Faced by the DNA Methylation Market?
Lack of expertise and unskilled professionals creating obstacles for market growth
A lack of expertise to perform DNA methylation experiments could restrict the growth. DNA methylation holds significant potential in various biotechnology applications, while the relatively low number of skilled professionals remains an obstacle to growth. All these factors may restrict the growth of the DNA methylation market in the forecast period 2023-2033.
Regional Insights
Large Network of Manufacturing and R&D Facilities Spurring Growth of DNA Methylation in North America?
Investments in research accelerating DNA methylation market growth
North America is expected to account for the largest market share in 2023. This can be attributed to the large network of manufacturing and R&D facilities, the increase in product launches and approvals. Moreover, the growing demand for protein expression systems has also contributed significantly to the regional growth.
In May 2022, Twist Bioscience introduced a human methylome panel to allow methylation fractions to be detected in a wide range of applications. This supports the identification of epigenetic targets and the discovery of differentially methylated areas for human development and cancer metastasis research. North America’s contribution through research and development is creating lucrative opportunities for DNA methylation. Thus, North America is expected to possess 40% market share for DNA methylation market in 2023.
Government Initiatives Bolstering Growth of DNA Methylation in Asia Pacific?
Global players penetrating Asia Pacific market region for wider reach
Asia Pacific is estimated to be the fastest-growing segment over the forecast period due to growing support from the government with several initiatives. Furthermore, the growing focus of global players on emerging markets of Asia Pacific also remains a promising driver of growth.
In September 2020, AnchorDxentered announced the development of liquid biopsy diagnostic model for breast cancer detection at an early stage. This diagnostic model is focused on circulating cell-free DNA-based methylation patterns. Similarly, in August 2022, Oncgnostics GmbH received authorization from the Chinese government to market its GynTect test to doctors and patients. This is the first methylation test to be authorized in China for the triage cervical cancer cases. Thus, Asia Pacific is expected to possess 38% market share for DNA methylation market in 2023.

A unified Market Research Subscription Platform, built for today's disparate research needs.
Category-Wise Insights
Rapid Advancements in Technology Favoring Growth of Sequencing in DNA Methylation?
Cost-effective and accurate results favoring the use of sequencing for DNA methylation
Sequencing segment captured the highest market share in 2021 due to the rapid advancement in technologies that offer cost-effective, accurate, and quick results. Bisulfite genomic sequencing is considered a gold-standard technology. Researchers have employed whole-genome bisulfite sequencing to understand the epigenetic landscape of immune-related disorders caused by tobacco use.
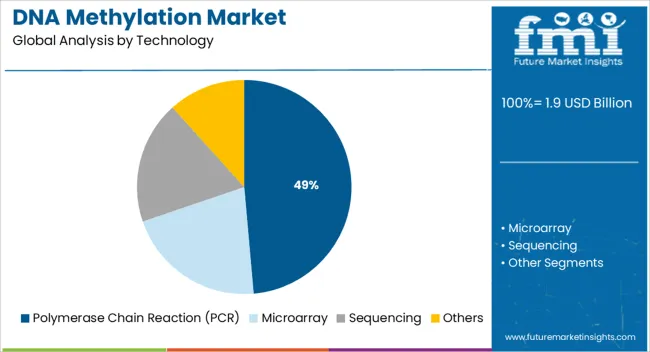
Growth of this technology in research studies to understand the adverse effects of smoking and how it relates to diseases promises further growth opportunities in the segment. Thus, sequencing is expected to possess 35% market share for DNA methylation market in 2023.
Demand for analyzing DNA making PCR essential for screening in DNA methylation
PCR is anticipated to witness significant growth in the coming years owing to an increase in its use in diagnostics and DNA sequencing procedures. During Covid-19, the demand for PCR technology significantly increased in relevance as a diagnostic procedure. PCR-based methods are primarily used to analyze DNA methylation on a gene-by-gene basis.
In May 2022, Pentabase A/S announced the launch of a qPCR-based assay, EpiDirect, for detecting DNA methylation without pre-treatment. This product aims to create a cancer screening technique that can detect cancers in cell-free DNA environment.
Quick Turnaround Times Accelerating Growth of Consumables for DNA Methylation Market?
Wide application in end user industries making consumables a viable option
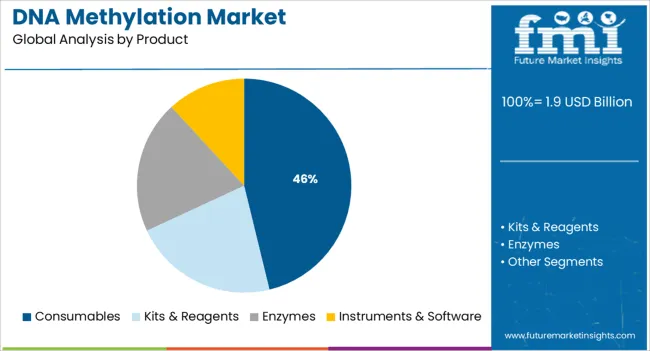
The consumables segment is expected to dominate the DNA methylation market in 2023, as it is majorly used in the DNA sequencing procedures and diagnosis process. Growing demand for quick turnaround times and high throughput results are also strong contributors to the growth. A wide range of consumables are used in the research industry, which includes tubes, vials, microarray panels, dispensers, and pipette tips.
High volume requirements of these consumables continue to boost the overall demand in the market. In April 2022, PacBio announced of expansion of its product offering by adding new DNA methylation consumables. These are made directly available to all its customers using Sequel II and Sequel IIe systems. Thus, consumables are expected to possess 35% market share for DNA methylation market in 2023.
Protein-modifying enzymes experiencing lucrative growth for DNA methylation
The enzyme segment is anticipated to witness lucrative growth in the coming years due to the increasing demand for protein-modifying and enzymes in the DNA methylation technique. These are widely used in agrigenomic research, genomic research, and genome-wide analysis. The usage of enzymes in DNA methylation reactions during sequencing analysis, such as Illumina sequencing and pyrosequencing remains prominent. Moreover, the utilization of next-generation sequencing technology has bolstered the demand for enzymes in the biotechnology industry.
Growth of Clinical Trials Accelerating Growth of Trials of DNA Methylation?
Demand for potential biomarkers increasing growth of clinical trials
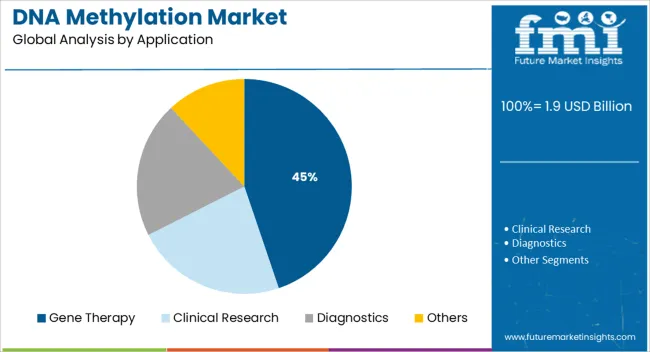
Clinical research segment is expected to capture the highest market share in 2023, thanks to the increasing number of clinical trials for several diseases globally. Furthermore, increased R&D expenditure, and increasing demand for potential biomarkers promises more growth opportunities.
In July 2020, an article published in Springer stated that disease-linked methylation changes could be used as biomarkers at all clinical disease management stages. These various stages include predisposition and risk assessment screening through early diagnostics to the personalized patient care of chronic and relapse disease. Therefore, disease-related discovery is a promising biomarkers and a potential gamechanger for precision medicine. Thus, clinical research is expected to possess 40% market share for DNA methylation market in 2023.
Accuracy of pathological diagnosis increasing dependency on diagnostic systems
Diagnostic segment is anticipated to witness the fastest growth in the coming years with a CAGR of 16%. DNA methylation profiling is an emerging tool that promises to increase the accuracy of pathological diagnosis.
In January 2022, an article published in PubMed stated that DNA methylation patterns in circulating tumor DNA (ctDNA) offer considerable promisefor the categorization and detection of cancer with the least invasive approach. Methylation profiling can be widely used as a cancer diagnostic tool for all tumor types, despite its recent arrival to the scene
Molecular Biology and Genomics Driving Growth of DNA Methylation Market?
High throughput technologies boosting use of DNA methylation in molecular biology and genomics
Pharmaceutical and biotechnology end-use segment are expected to capture the highest market share in 2023. The increased adoption of DNA methylation in the field of molecular biology and genomics& remains the primary driver of this growth. Moreover, increasing usage of high throughput technologies such as NGS by key market players also continues to open new opportunities for growth.
In June 2020, Base Genomics announced of leveraging TET-assisted pyridine borane sequencing (TAPS) technology developed by the University of Oxford to find epigenetic signs of cancer in the blood. Thus, pharmaceutical and biotechnology end-use segment are expected to possess 42% market share for DNA methylation in 2023.
Research & development activities along with funding from government contributing to research and academia segment
Research and Academia is anticipated to witness significant growth in the coming years owing to increased R&D in the epigenetics sector. This along with increasing government support in terms of funding remains promising drivers of growth.
In July 2022, according to a study published in Genome Biology, DNA methylation in bacteria controls reproduction, gene expression, and pathogenicity. The tissue-specific gene expression that regulates a cell's identity, such as if it’s a brain cell or a skin cell, is regulated by DNA methylation Quality research remains the backbone of growth in the market.
Start-Ups for DNA Methylation Market
Key players in the DNA methylation market are Base Genomics, EpiQMAx, genknowme, Epify and EpigenCare
- Epigenetics company Base Genomics has received a seed funding of US$ 11 Million to progress development of its DNA methylation technology. The company is focusing on sequencing large information from simple blood tests.
- Epify, a Dutch startup is focusing on developing epigenetic biomarkers for cancer diagnosis. The startup’s solutions detect different kinds of epigenetic modifications, including DNA methylations, histone modifications, and RNA transcript modifications.
Market Competition
Key players operating in the DNA methylation industry are taking several initiatives such as strategic collaborations, partnerships, and geographical expansion in emerging regions.
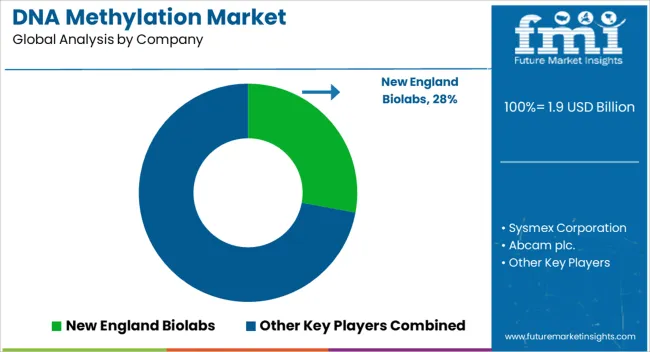
Some prominent players in the global DNA methylation market include New England Biolabs, Sysmex Corporation, Abcam plc., F. Hoffmann-La Roche Ltd., Diagenode Diagnostics S.A., Thermo-Fisher Scientific Inc., Agilent Technologies Inc., BioRad Laboratories Inc., Exact Sciences Corporation, QIAGEN N.V., Active Motif, Inc., Illumina Inc.,EpiGentek Group Inc., Pacific Biosciences Inc., New England Biolabs Inc., Merck KGaA, Zymo Research Corporation, PerkinElmer Inc.
- In June 2022, Boca ScientificInc. announced expansion of its product portfolio by adding MethylDetect DNA Methylation Assay Kits. These factors continue its robust adoption at research institutes and various pharmaceutical and biotechnology companies.
- In June 2020, Foundation Medicine, Inc acquired Lexent Bio, Inc. to expand the company’s liquid biopsy platforms to improve patient cancer care. This novel technique can be used to chronicle the progression of cancer in a diverse population of patients.
Report Scope
Report Attribute |
Details |
Market Value in 2023 |
US$ 1437.5 Million |
Market Value in 2033 |
US$ 5815.49 Million |
Growth Rate |
CAGR of 15% from 2023 to 2033 |
Base Year for Estimation |
2022 |
Historical Data |
2018-2022 |
Forecast Period |
2023-2033 |
Quantitative Units |
Revenue in USD Million and CAGR from 2023-2033 |
Report Coverage |
Revenue Forecast, Volume Forecast, Company Ranking, Competitive Landscape, Growth Factors, Trends and Pricing Analysis |
Segments Covered |
|
Regions Covered |
|
Key Countries Profiled |
|
Key Companies Profiled |
|
Customization |
Available Upon Request |
Key Segments Profiled in the DNA Methylation Industry Survey
Technology:
- Polymerase Chain Reaction (PCR)
- Microarray
- Sequencing
- Others
Product:
- Consumables
- Kits & Reagents
- Enzymes
- Instruments & Software
Application:
- Gene Therapy
- Clinical Research
- Diagnostics
- Others
End-use:
- Hospital & Diagnostic Laboratories
- Pharmaceutical & Biotechnology Companies
- Research & Academia
Region:
- North America
- Latin America
- Europe
- South Asia
- East Asia
- Oceania
- Middle East & Africa
Frequently Asked Questions
From 2017-2021, the DNA methylation market grew at a CAGR of 11%
The global DNA methylation market is expected to grow with a 15% CAGR during 2023-2033.
As of 2033, the DNA methylation market is expected to reach US$ 5815.49 Million
Sequencing is expected to possess 35% market share for DNA methylation market in 2023.
Pharmaceutical and biotechnology end-use segment are expected to possess 42% market share for DNA methylation in 2023.
Clinical research is expected to possess 40% market share for DNA methylation market in 2023.
North America is expected to possess 40% market share for DNA methylation market in 2023.
Asia Pacific is expected to possess 38% market share for DNA methylation market in 2023.
Table of Content
1. Executive Summary
1.1. Global Market Outlook
1.2. Demand-side Trends
1.3. Supply-side Trends
1.4. Technology Roadmap Analysis
1.5. Analysis and Recommendations
2. Market Overview
2.1. Market Coverage / Taxonomy
2.2. Market Definition / Scope / Limitations
3. Market Background
3.1. Market Dynamics
3.1.1. Drivers
3.1.2. Restraints
3.1.3. Opportunity
3.1.4. Trends
3.2. Scenario Forecast
3.2.1. Demand in Optimistic Scenario
3.2.2. Demand in Likely Scenario
3.2.3. Demand in Conservative Scenario
3.3. Opportunity Map Analysis
3.4. Investment Feasibility Matrix
3.5. PESTLE and Porter’s Analysis
3.6. Regulatory Landscape
3.6.1. By Key Regions
3.6.2. By Key Countries
3.7. Regional Parent Market Outlook
4. Global Market Analysis 2017-2021 and Forecast, 2022-2032
4.1. Historical Market Size Value (US$ Mn) Analysis, 2017-2021
4.2. Current and Future Market Size Value (US$ Mn) Projections, 2022-2032
4.2.1. Y-o-Y Growth Trend Analysis
4.2.2. Absolute $ Opportunity Analysis
5. Global Market Analysis 2017-2021 and Forecast 2022-2032, By Technology
5.1. Introduction / Key Findings
5.2. Historical Market Size Value (US$ Mn) Analysis By Technology, 2017-2021
5.3. Current and Future Market Size Value (US$ Mn) Analysis and Forecast By Technology, 2022-2032
5.3.1. Polymerase Chain Reaction (PCR)
5.3.2. Microarray
5.3.3. Sequencing
5.3.4. Others
5.4. Y-o-Y Growth Trend Analysis By Technology, 2017-2021
5.5. Absolute $ Opportunity Analysis By Technology, 2022-2032
6. Global Market Analysis 2017-2021 and Forecast 2022-2032, By Product
6.1. Introduction / Key Findings
6.2. Historical Market Size Value (US$ Mn) Analysis By Product , 2017-2021
6.3. Current and Future Market Size Value (US$ Mn) Analysis and Forecast By Product , 2022-2032
6.3.1. Consumables
6.3.2. Kits & Reagents
6.3.3. Enzymes
6.3.4. Instruments & Software
6.4. Y-o-Y Growth Trend Analysis By Product , 2017-2021
6.5. Absolute $ Opportunity Analysis By Product , 2022-2032
7. Global Market Analysis 2017-2021 and Forecast 2022-2032, By Application
7.1. Introduction / Key Findings
7.2. Historical Market Size Value (US$ Mn) Analysis By Application, 2017-2021
7.3. Current and Future Market Size Value (US$ Mn) Analysis and Forecast By Application, 2022-2032
7.3.1. Gene Therapy
7.3.2. Clinical Research
7.3.3. Diagnostics
7.3.4. Others
7.4. Y-o-Y Growth Trend Analysis By Application, 2017-2021
7.5. Absolute $ Opportunity Analysis By Application, 2022-2032
8. Global Market Analysis 2017-2021 and Forecast 2022-2032, By End-use
8.1. Introduction / Key Findings
8.2. Historical Market Size Value (US$ Mn) Analysis By End-use, 2017-2021
8.3. Current and Future Market Size Value (US$ Mn) Analysis and Forecast By End-use, 2022-2032
8.3.1. Hospital & Diagnostic Laboratories
8.3.2. Pharmaceutical & Biotechnology Companies
8.3.3. Research & Academia
8.4. Y-o-Y Growth Trend Analysis By End-use, 2017-2021
8.5. Absolute $ Opportunity Analysis By End-use, 2022-2032
9. Global Market Analysis 2017-2021 and Forecast 2022-2032, By Region
9.1. Introduction
9.2. Historical Market Size Value (US$ Mn) Analysis By Region, 2017-2021
9.3. Current Market Size Value (US$ Mn) Analysis and Forecast By Region, 2022-2032
9.3.1. North America
9.3.2. Latin America
9.3.3. Europe
9.3.4. South Asia
9.3.5. East Asia
9.3.6. Oceania
9.3.7. MEA
9.4. Market Attractiveness Analysis By Region
10. North America Market Analysis 2017-2021 and Forecast 2022-2032, By Country
10.1. Historical Market Size Value (US$ Mn) Trend Analysis By Market Taxonomy, 2017-2021
10.2. Market Size Value (US$ Mn) Forecast By Market Taxonomy, 2022-2032
10.2.1. By Country
10.2.1.1. U.S.
10.2.1.2. Canada
10.2.2. By Technology
10.2.3. By Product
10.2.4. By Application
10.2.5. By End-use
10.3. Market Attractiveness Analysis
10.3.1. By Country
10.3.2. By Technology
10.3.3. By Product
10.3.4. By Application
10.3.5. By End-use
10.4. Key Takeaways
11. Latin America Market Analysis 2017-2021 and Forecast 2022-2032, By Country
11.1. Historical Market Size Value (US$ Mn) Trend Analysis By Market Taxonomy, 2017-2021
11.2. Market Size Value (US$ Mn) Forecast By Market Taxonomy, 2022-2032
11.2.1. By Country
11.2.1.1. Brazil
11.2.1.2. Mexico
11.2.1.3. Rest of Latin America
11.2.2. By Technology
11.2.3. By Product
11.2.4. By Application
11.2.5. By End-use
11.3. Market Attractiveness Analysis
11.3.1. By Country
11.3.2. By Technology
11.3.3. By Product
11.3.4. By Application
11.3.5. By End-use
11.4. Key Takeaways
12. Europe Market Analysis 2017-2021 and Forecast 2022-2032, By Country
12.1. Historical Market Size Value (US$ Mn) Trend Analysis By Market Taxonomy, 2017-2021
12.2. Market Size Value (US$ Mn) Forecast By Market Taxonomy, 2022-2032
12.2.1. By Country
12.2.1.1. Germany
12.2.1.2. U.K.
12.2.1.3. France
12.2.1.4. Spain
12.2.1.5. Italy
12.2.1.6. Rest of Europe
12.2.2. By Technology
12.2.3. By Product
12.2.4. By Application
12.2.5. By End-use
12.3. Market Attractiveness Analysis
12.3.1. By Country
12.3.2. By Technology
12.3.3. By Product
12.3.4. By Application
12.3.5. By End-use
12.4. Key Takeaways
13. South Asia Market Analysis 2017-2021 and Forecast 2022-2032, By Country
13.1. Historical Market Size Value (US$ Mn) Trend Analysis By Market Taxonomy, 2017-2021
13.2. Market Size Value (US$ Mn) Forecast By Market Taxonomy, 2022-2032
13.2.1. By Country
13.2.1.1. India
13.2.1.2. Malaysia
13.2.1.3. Singapore
13.2.1.4. Thailand
13.2.1.5. Rest of South Asia
13.2.2. By Technology
13.2.3. By Product
13.2.4. By Application
13.2.5. By End-use
13.3. Market Attractiveness Analysis
13.3.1. By Country
13.3.2. By Technology
13.3.3. By Product
13.3.4. By Application
13.3.5. By End-use
13.4. Key Takeaways
14. East Asia Market Analysis 2017-2021 and Forecast 2022-2032, By Country
14.1. Historical Market Size Value (US$ Mn) Trend Analysis By Market Taxonomy, 2017-2021
14.2. Market Size Value (US$ Mn) Forecast By Market Taxonomy, 2022-2032
14.2.1. By Country
14.2.1.1. China
14.2.1.2. Japan
14.2.1.3. South Korea
14.2.2. By Technology
14.2.3. By Product
14.2.4. By Application
14.2.5. By End-use
14.3. Market Attractiveness Analysis
14.3.1. By Country
14.3.2. By Technology
14.3.3. By Product
14.3.4. By Application
14.3.5. By End-use
14.4. Key Takeaways
15. Oceania Market Analysis 2017-2021 and Forecast 2022-2032, By Country
15.1. Historical Market Size Value (US$ Mn) Trend Analysis By Market Taxonomy, 2017-2021
15.2. Market Size Value (US$ Mn) Forecast By Market Taxonomy, 2022-2032
15.2.1. By Country
15.2.1.1. Australia
15.2.1.2. New Zealand
15.2.2. By Technology
15.2.3. By Product
15.2.4. By Application
15.2.5. By End-use
15.3. Market Attractiveness Analysis
15.3.1. By Country
15.3.2. By Technology
15.3.3. By Product
15.3.4. By Application
15.3.5. By End-use
15.4. Key Takeaways
16. MEA Market Analysis 2017-2021 and Forecast 2022-2032, By Country
16.1. Historical Market Size Value (US$ Mn) Trend Analysis By Market Taxonomy, 2017-2021
16.2. Market Size Value (US$ Mn) Forecast By Market Taxonomy, 2022-2032
16.2.1. By Country
16.2.1.1. GCC Countries
16.2.1.2. South Africa
16.2.1.3. Israel
16.2.1.4. Rest of MEA
16.2.2. By Technology
16.2.3. By Product
16.2.4. By Application
16.2.5. By End-use
16.3. Market Attractiveness Analysis
16.3.1. By Country
16.3.2. By Technology
16.3.3. By Product
16.3.4. By Application
16.3.5. By End-use
16.4. Key Takeaways
17. Key Countries Market Analysis
17.1. U.S.
17.1.1. Pricing Analysis
17.1.2. Market Share Analysis, 2021
17.1.2.1. By Technology
17.1.2.2. By Product
17.1.2.3. By Application
17.1.2.4. By End-use
17.2. Canada
17.2.1. Pricing Analysis
17.2.2. Market Share Analysis, 2021
17.2.2.1. By Technology
17.2.2.2. By Product
17.2.2.3. By Application
17.2.2.4. By End-use
17.3. Brazil
17.3.1. Pricing Analysis
17.3.2. Market Share Analysis, 2021
17.3.2.1. By Technology
17.3.2.2. By Product
17.3.2.3. By Application
17.3.2.4. By End-use
17.4. Mexico
17.4.1. Pricing Analysis
17.4.2. Market Share Analysis, 2021
17.4.2.1. By Technology
17.4.2.2. By Product
17.4.2.3. By Application
17.4.2.4. By End-use
17.5. Germany
17.5.1. Pricing Analysis
17.5.2. Market Share Analysis, 2021
17.5.2.1. By Technology
17.5.2.2. By Product
17.5.2.3. By Application
17.5.2.4. By End-use
17.6. U.K.
17.6.1. Pricing Analysis
17.6.2. Market Share Analysis, 2021
17.6.2.1. By Technology
17.6.2.2. By Product
17.6.2.3. By Application
17.6.2.4. By End-use
17.7. France
17.7.1. Pricing Analysis
17.7.2. Market Share Analysis, 2021
17.7.2.1. By Technology
17.7.2.2. By Product
17.7.2.3. By Application
17.7.2.4. By End-use
17.8. Spain
17.8.1. Pricing Analysis
17.8.2. Market Share Analysis, 2021
17.8.2.1. By Technology
17.8.2.2. By Product
17.8.2.3. By Application
17.8.2.4. By End-use
17.9. Italy
17.9.1. Pricing Analysis
17.9.2. Market Share Analysis, 2021
17.9.2.1. By Technology
17.9.2.2. By Product
17.9.2.3. By Application
17.9.2.4. By End-use
17.10. India
17.10.1. Pricing Analysis
17.10.2. Market Share Analysis, 2021
17.10.2.1. By Technology
17.10.2.2. By Product
17.10.2.3. By Application
17.10.2.4. By End-use
17.11. Malaysia
17.11.1. Pricing Analysis
17.11.2. Market Share Analysis, 2021
17.11.2.1. By Technology
17.11.2.2. By Product
17.11.2.3. By Application
17.11.2.4. By End-use
17.12. Singapore
17.12.1. Pricing Analysis
17.12.2. Market Share Analysis, 2021
17.12.2.1. By Technology
17.12.2.2. By Produc
17.12.2.3. By Application
17.12.2.4. By End-use
17.13. Thailand
17.13.1. Pricing Analysis
17.13.2. Market Share Analysis, 2021
17.13.2.1. By Technology
17.13.2.2. By Product
17.13.2.3. By Application
17.13.2.4. By End-use
17.14. China
17.14.1. Pricing Analysis
17.14.2. Market Share Analysis, 2021
17.14.2.1. By Technology
17.14.2.2. By Product
17.14.2.3. By Application
17.14.2.4. By End-use
17.15. Japan
17.15.1. Pricing Analysis
17.15.2. Market Share Analysis, 2021
17.15.2.1. By Technology
17.15.2.2. By Product
17.15.2.3. By Application
17.15.2.4. By End-use
17.16. South Korea
17.16.1. Pricing Analysis
17.16.2. Market Share Analysis, 2021
17.16.2.1. By Technology
17.16.2.2. By Product
17.16.2.3. By Application
17.16.2.4. By End-use
17.17. Australia
17.17.1. Pricing Analysis
17.17.2. Market Share Analysis, 2021
17.17.2.1. By Technology
17.17.2.2. By Product
17.17.2.3. By Application
17.17.2.4. By End-use
17.18. New Zealand
17.18.1. Pricing Analysis
17.18.2. Market Share Analysis, 2021
17.18.2.1. By Technology
17.18.2.2. By Product
17.18.2.3. By Application
17.18.2.4. By End-use
17.19. GCC Countries
17.19.1. Pricing Analysis
17.19.2. Market Share Analysis, 2021
17.19.2.1. By Technology
17.19.2.2. By Product
17.19.2.3. By Application
17.19.2.4. By End-use
17.20. South Africa
17.20.1. Pricing Analysis
17.20.2. Market Share Analysis, 2021
17.20.2.1. By Technology
17.20.2.2. By Product
17.20.2.3. By Application
17.20.2.4. By End-use
17.21. Israel
17.21.1. Pricing Analysis
17.21.2. Market Share Analysis, 2021
17.21.2.1. By Technology
17.21.2.2. By Product
17.21.2.3. By Application
17.21.2.4. By End-use
18. Market Structure Analysis
18.1. Competition Dashboard
18.2. Competition Benchmarking
18.3. Market Share Analysis of Top Players
18.3.1. By Regional
18.3.2. By Technology
18.3.3. By Product
18.3.4. By Application
18.3.5. By End-use
19. Competition Analysis
19.1. Competition Deep Dive
19.1.1. New England Biolabs
19.1.1.1. Overview
19.1.1.2. Product Portfolio
19.1.1.3. Profitability by Market Segments
19.1.1.4. Sales Footprint
19.1.1.5. Strategy Overview
19.1.1.5.1. Marketing Strategy
19.1.2. Sysmex Corporation
19.1.2.1. Overview
19.1.2.2. Product Portfolio
19.1.2.3. Profitability by Market Segments
19.1.2.4. Sales Footprint
19.1.2.5. Strategy Overview
19.1.2.5.1. Marketing Strategy
19.1.3. Abcam plc.
19.1.3.1. Overview
19.1.3.2. Product Portfolio
19.1.3.3. Profitability by Market Segments
19.1.3.4. Sales Footprint
19.1.3.5. Strategy Overview
19.1.3.5.1. Marketing Strategy
19.1.4. F. Hoffmann-La Roche Ltd.
19.1.4.1. Overview
19.1.4.2. Product Portfolio
19.1.4.3. Profitability by Market Segments
19.1.4.4. Sales Footprint
19.1.4.5. Strategy Overview
19.1.4.5.1. Marketing Strategy
19.1.5. Diagenode Diagnostics S.A.
19.1.5.1. Overview
19.1.5.2. Product Portfolio
19.1.5.3. Profitability by Market Segments
19.1.5.4. Sales Footprint
19.1.5.5. Strategy Overview
19.1.5.5.1. Marketing Strategy
19.1.6. Thermo-Fisher Scientific Inc.
19.1.6.1. Overview
19.1.6.2. Product Portfolio
19.1.6.3. Profitability by Market Segments
19.1.6.4. Sales Footprint
19.1.6.5. Strategy Overview
19.1.6.5.1. Marketing Strategy
19.1.7. Agilent Technologies Inc.
19.1.7.1. Overview
19.1.7.2. Product Portfolio
19.1.7.3. Profitability by Market Segments
19.1.7.4. Sales Footprint
19.1.7.5. Strategy Overview
19.1.7.5.1. Marketing Strategy
19.1.8. BioRad Laboratories Inc.
19.1.8.1. Overview
19.1.8.2. Product Portfolio
19.1.8.3. Profitability by Market Segments
19.1.8.4. Sales Footprint
19.1.8.5. Strategy Overview
19.1.8.5.1. Marketing Strategy
19.1.9. Exact Sciences Corporation
19.1.9.1. Overview
19.1.9.2. Product Portfolio
19.1.9.3. Profitability by Market Segments
19.1.9.4. Sales Footprint
19.1.9.5. Strategy Overview
19.1.9.5.1. Marketing Strategy
19.1.10. QIAGEN N.V.
19.1.10.1. Overview
19.1.10.2. Product Portfolio
19.1.10.3. Profitability by Market Segments
19.1.10.4. Sales Footprint
19.1.10.5. Strategy Overview
19.1.10.5.1. Marketing Strategy
19.1.11. Active Motif, Inc.
19.1.11.1. Overview
19.1.11.2. Product Portfolio
19.1.11.3. Profitability by Market Segments
19.1.11.4. Sales Footprint
19.1.11.5. Strategy Overview
19.1.11.5.1. Marketing Strategy
19.1.12. Illumina Inc.
19.1.12.1. Overview
19.1.12.2. Product Portfolio
19.1.12.3. Profitability by Market Segments
19.1.12.4. Sales Footprint
19.1.12.5. Strategy Overview
19.1.12.5.1. Marketing Strategy
19.1.13. EpiGentek Group Inc.
19.1.13.1. Overview
19.1.13.2. Product Portfolio
19.1.13.3. Profitability by Market Segments
19.1.13.4. Sales Footprint
19.1.13.5. Strategy Overview
19.1.13.5.1. Marketing Strategy
19.1.14. Pacific Biosciences Inc.
19.1.14.1. Overview
19.1.14.2. Product Portfolio
19.1.14.3. Profitability by Market Segments
19.1.14.4. Sales Footprint
19.1.14.5. Strategy Overview
19.1.14.5.1. Marketing Strategy
19.1.15. New England Biolabs Inc.
19.1.15.1. Overview
19.1.15.2. Product Portfolio
19.1.15.3. Profitability by Market Segments
19.1.15.4. Sales Footprint
19.1.15.5. Strategy Overview
19.1.15.5.1. Marketing Strategy
19.1.16. Merck KGaA
19.1.16.1. Overview
19.1.16.2. Product Portfolio
19.1.16.3. Profitability by Market Segments
19.1.16.4. Sales Footprint
19.1.16.5. Strategy Overview
19.1.16.5.1. Marketing Strategy
19.1.17. Zymo Research Corporation
19.1.17.1. Overview
19.1.17.2. Product Portfolio
19.1.17.3. Profitability by Market Segments
19.1.17.4. Sales Footprint
19.1.17.5. Strategy Overview
19.1.17.5.1. Marketing Strategy
19.1.18. PerkinElmer Inc.
19.1.18.1. Overview
19.1.18.2. Product Portfolio
19.1.18.3. Profitability by Market Segments
19.1.18.4. Sales Footprint
19.1.18.5. Strategy Overview
19.1.18.5.1. Marketing Strategy
20. Assumptions & Acronyms Used
21. Research Methodology
Let us know your requirement to get
100% FREE customization
List of Tables
Table 1: Global Market Value (US$ Mn) Forecast by Region, 2017-2032
Table 2: Global Market Value (US$ Mn) Forecast by Technology, 2017-2032
Table 3: Global Market Value (US$ Mn) Forecast by Product , 2017-2032
Table 4: Global Market Value (US$ Mn) Forecast by Application , 2017-2032
Table 5: Global Market Value (US$ Mn) Forecast by End-use, 2017-2032
Table 6: North America Market Value (US$ Mn) Forecast by Country, 2017-2032
Table 7: North America Market Value (US$ Mn) Forecast by Technology, 2017-2032
Table 8: North America Market Value (US$ Mn) Forecast by Product , 2017-2032
Table 9: North America Market Value (US$ Mn) Forecast by Application , 2017-2032
Table 10: North America Market Value (US$ Mn) Forecast by End-use, 2017-2032
Table 11: Latin America Market Value (US$ Mn) Forecast by Country, 2017-2032
Table 12: Latin America Market Value (US$ Mn) Forecast by Technology, 2017-2032
Table 13: Latin America Market Value (US$ Mn) Forecast by Product , 2017-2032
Table 14: Latin America Market Value (US$ Mn) Forecast by Application , 2017-2032
Table 15: Latin America Market Value (US$ Mn) Forecast by End-use, 2017-2032
Table 16: Europe Market Value (US$ Mn) Forecast by Country, 2017-2032
Table 17: Europe Market Value (US$ Mn) Forecast by Technology, 2017-2032
Table 18: Europe Market Value (US$ Mn) Forecast by Product , 2017-2032
Table 19: Europe Market Value (US$ Mn) Forecast by Application , 2017-2032
Table 20: Europe Market Value (US$ Mn) Forecast by End-use, 2017-2032
Table 21: South Asia Market Value (US$ Mn) Forecast by Country, 2017-2032
Table 22: South Asia Market Value (US$ Mn) Forecast by Technology, 2017-2032
Table 23: South Asia Market Value (US$ Mn) Forecast by Product , 2017-2032
Table 24: South Asia Market Value (US$ Mn) Forecast by Application , 2017-2032
Table 25: South Asia Market Value (US$ Mn) Forecast by End-use, 2017-2032
Table 26: East Asia Market Value (US$ Mn) Forecast by Country, 2017-2032
Table 27: East Asia Market Value (US$ Mn) Forecast by Technology, 2017-2032
Table 28: East Asia Market Value (US$ Mn) Forecast by Product , 2017-2032
Table 29: East Asia Market Value (US$ Mn) Forecast by Application , 2017-2032
Table 30: East Asia Market Value (US$ Mn) Forecast by End-use, 2017-2032
Table 31: Oceania Market Value (US$ Mn) Forecast by Country, 2017-2032
Table 32: Oceania Market Value (US$ Mn) Forecast by Technology, 2017-2032
Table 33: Oceania Market Value (US$ Mn) Forecast by Product , 2017-2032
Table 34: Oceania Market Value (US$ Mn) Forecast by Application , 2017-2032
Table 35: Oceania Market Value (US$ Mn) Forecast by End-use, 2017-2032
Table 36: MEA Market Value (US$ Mn) Forecast by Country, 2017-2032
Table 37: MEA Market Value (US$ Mn) Forecast by Technology, 2017-2032
Table 38: MEA Market Value (US$ Mn) Forecast by Product , 2017-2032
Table 39: MEA Market Value (US$ Mn) Forecast by Application , 2017-2032
Table 40: MEA Market Value (US$ Mn) Forecast by End-use, 2017-2032
Find your sweet spots for generating winning opportunities in this market.
Talk to AnalystList of Charts
Figure 1: Global Market Value (US$ Mn) by Technology, 2022-2032
Figure 2: Global Market Value (US$ Mn) by Product , 2022-2032
Figure 3: Global Market Value (US$ Mn) by Application , 2022-2032
Figure 4: Global Market Value (US$ Mn) by End-use, 2022-2032
Figure 5: Global Market Value (US$ Mn) by Region, 2022-2032
Figure 6: Global Market Value (US$ Mn) Analysis by Region, 2017-2032
Figure 7: Global Market Value Share (%) and BPS Analysis by Region, 2022-2032
Figure 8: Global Market Y-o-Y Growth (%) Projections by Region, 2022-2032
Figure 9: Global Market Value (US$ Mn) Analysis by Technology, 2017-2032
Figure 10: Global Market Value Share (%) and BPS Analysis by Technology, 2022-2032
Figure 11: Global Market Y-o-Y Growth (%) Projections by Technology, 2022-2032
Figure 12: Global Market Value (US$ Mn) Analysis by Product , 2017-2032
Figure 13: Global Market Value Share (%) and BPS Analysis by Product , 2022-2032
Figure 14: Global Market Y-o-Y Growth (%) Projections by Product , 2022-2032
Figure 15: Global Market Value (US$ Mn) Analysis by Application , 2017-2032
Figure 16: Global Market Value Share (%) and BPS Analysis by Application , 2022-2032
Figure 17: Global Market Y-o-Y Growth (%) Projections by Application , 2022-2032
Figure 18: Global Market Value (US$ Mn) Analysis by End-use, 2017-2032
Figure 19: Global Market Value Share (%) and BPS Analysis by End-use, 2022-2032
Figure 20: Global Market Y-o-Y Growth (%) Projections by End-use, 2022-2032
Figure 21: Global Market Attractiveness by Technology, 2022-2032
Figure 22: Global Market Attractiveness by Product , 2022-2032
Figure 23: Global Market Attractiveness by Application , 2022-2032
Figure 24: Global Market Attractiveness by End-use, 2022-2032
Figure 25: Global Market Attractiveness by Region, 2022-2032
Figure 26: North America Market Value (US$ Mn) by Technology, 2022-2032
Figure 27: North America Market Value (US$ Mn) by Product , 2022-2032
Figure 28: North America Market Value (US$ Mn) by Application , 2022-2032
Figure 29: North America Market Value (US$ Mn) by End-use, 2022-2032
Figure 30: North America Market Value (US$ Mn) by Country, 2022-2032
Figure 31: North America Market Value (US$ Mn) Analysis by Country, 2017-2032
Figure 32: North America Market Value Share (%) and BPS Analysis by Country, 2022-2032
Figure 33: North America Market Y-o-Y Growth (%) Projections by Country, 2022-2032
Figure 34: North America Market Value (US$ Mn) Analysis by Technology, 2017-2032
Figure 35: North America Market Value Share (%) and BPS Analysis by Technology, 2022-2032
Figure 36: North America Market Y-o-Y Growth (%) Projections by Technology, 2022-2032
Figure 37: North America Market Value (US$ Mn) Analysis by Product , 2017-2032
Figure 38: North America Market Value Share (%) and BPS Analysis by Product , 2022-2032
Figure 39: North America Market Y-o-Y Growth (%) Projections by Product , 2022-2032
Figure 40: North America Market Value (US$ Mn) Analysis by Application , 2017-2032
Figure 41: North America Market Value Share (%) and BPS Analysis by Application , 2022-2032
Figure 42: North America Market Y-o-Y Growth (%) Projections by Application , 2022-2032
Figure 43: North America Market Value (US$ Mn) Analysis by End-use, 2017-2032
Figure 44: North America Market Value Share (%) and BPS Analysis by End-use, 2022-2032
Figure 45: North America Market Y-o-Y Growth (%) Projections by End-use, 2022-2032
Figure 46: North America Market Attractiveness by Technology, 2022-2032
Figure 47: North America Market Attractiveness by Product , 2022-2032
Figure 48: North America Market Attractiveness by Application , 2022-2032
Figure 49: North America Market Attractiveness by End-use, 2022-2032
Figure 50: North America Market Attractiveness by Country, 2022-2032
Figure 51: Latin America Market Value (US$ Mn) by Technology, 2022-2032
Figure 52: Latin America Market Value (US$ Mn) by Product , 2022-2032
Figure 53: Latin America Market Value (US$ Mn) by Application , 2022-2032
Figure 54: Latin America Market Value (US$ Mn) by End-use, 2022-2032
Figure 55: Latin America Market Value (US$ Mn) by Country, 2022-2032
Figure 56: Latin America Market Value (US$ Mn) Analysis by Country, 2017-2032
Figure 57: Latin America Market Value Share (%) and BPS Analysis by Country, 2022-2032
Figure 58: Latin America Market Y-o-Y Growth (%) Projections by Country, 2022-2032
Figure 59: Latin America Market Value (US$ Mn) Analysis by Technology, 2017-2032
Figure 60: Latin America Market Value Share (%) and BPS Analysis by Technology, 2022-2032
Figure 61: Latin America Market Y-o-Y Growth (%) Projections by Technology, 2022-2032
Figure 62: Latin America Market Value (US$ Mn) Analysis by Product , 2017-2032
Figure 63: Latin America Market Value Share (%) and BPS Analysis by Product , 2022-2032
Figure 64: Latin America Market Y-o-Y Growth (%) Projections by Product , 2022-2032
Figure 65: Latin America Market Value (US$ Mn) Analysis by Application , 2017-2032
Figure 66: Latin America Market Value Share (%) and BPS Analysis by Application , 2022-2032
Figure 67: Latin America Market Y-o-Y Growth (%) Projections by Application , 2022-2032
Figure 68: Latin America Market Value (US$ Mn) Analysis by End-use, 2017-2032
Figure 69: Latin America Market Value Share (%) and BPS Analysis by End-use, 2022-2032
Figure 70: Latin America Market Y-o-Y Growth (%) Projections by End-use, 2022-2032
Figure 71: Latin America Market Attractiveness by Technology, 2022-2032
Figure 72: Latin America Market Attractiveness by Product , 2022-2032
Figure 73: Latin America Market Attractiveness by Application , 2022-2032
Figure 74: Latin America Market Attractiveness by End-use, 2022-2032
Figure 75: Latin America Market Attractiveness by Country, 2022-2032
Figure 76: Europe Market Value (US$ Mn) by Technology, 2022-2032
Figure 77: Europe Market Value (US$ Mn) by Product , 2022-2032
Figure 78: Europe Market Value (US$ Mn) by Application , 2022-2032
Figure 79: Europe Market Value (US$ Mn) by End-use, 2022-2032
Figure 80: Europe Market Value (US$ Mn) by Country, 2022-2032
Figure 81: Europe Market Value (US$ Mn) Analysis by Country, 2017-2032
Figure 82: Europe Market Value Share (%) and BPS Analysis by Country, 2022-2032
Figure 83: Europe Market Y-o-Y Growth (%) Projections by Country, 2022-2032
Figure 84: Europe Market Value (US$ Mn) Analysis by Technology, 2017-2032
Figure 85: Europe Market Value Share (%) and BPS Analysis by Technology, 2022-2032
Figure 86: Europe Market Y-o-Y Growth (%) Projections by Technology, 2022-2032
Figure 87: Europe Market Value (US$ Mn) Analysis by Product , 2017-2032
Figure 88: Europe Market Value Share (%) and BPS Analysis by Product , 2022-2032
Figure 89: Europe Market Y-o-Y Growth (%) Projections by Product , 2022-2032
Figure 90: Europe Market Value (US$ Mn) Analysis by Application , 2017-2032
Figure 91: Europe Market Value Share (%) and BPS Analysis by Application , 2022-2032
Figure 92: Europe Market Y-o-Y Growth (%) Projections by Application , 2022-2032
Figure 93: Europe Market Value (US$ Mn) Analysis by End-use, 2017-2032
Figure 94: Europe Market Value Share (%) and BPS Analysis by End-use, 2022-2032
Figure 95: Europe Market Y-o-Y Growth (%) Projections by End-use, 2022-2032
Figure 96: Europe Market Attractiveness by Technology, 2022-2032
Figure 97: Europe Market Attractiveness by Product , 2022-2032
Figure 98: Europe Market Attractiveness by Application , 2022-2032
Figure 99: Europe Market Attractiveness by End-use, 2022-2032
Figure 100: Europe Market Attractiveness by Country, 2022-2032
Figure 101: South Asia Market Value (US$ Mn) by Technology, 2022-2032
Figure 102: South Asia Market Value (US$ Mn) by Product , 2022-2032
Figure 103: South Asia Market Value (US$ Mn) by Application , 2022-2032
Figure 104: South Asia Market Value (US$ Mn) by End-use, 2022-2032
Figure 105: South Asia Market Value (US$ Mn) by Country, 2022-2032
Figure 106: South Asia Market Value (US$ Mn) Analysis by Country, 2017-2032
Figure 107: South Asia Market Value Share (%) and BPS Analysis by Country, 2022-2032
Figure 108: South Asia Market Y-o-Y Growth (%) Projections by Country, 2022-2032
Figure 109: South Asia Market Value (US$ Mn) Analysis by Technology, 2017-2032
Figure 110: South Asia Market Value Share (%) and BPS Analysis by Technology, 2022-2032
Figure 111: South Asia Market Y-o-Y Growth (%) Projections by Technology, 2022-2032
Figure 112: South Asia Market Value (US$ Mn) Analysis by Product , 2017-2032
Figure 113: South Asia Market Value Share (%) and BPS Analysis by Product , 2022-2032
Figure 114: South Asia Market Y-o-Y Growth (%) Projections by Product , 2022-2032
Figure 115: South Asia Market Value (US$ Mn) Analysis by Application , 2017-2032
Figure 116: South Asia Market Value Share (%) and BPS Analysis by Application , 2022-2032
Figure 117: South Asia Market Y-o-Y Growth (%) Projections by Application , 2022-2032
Figure 118: South Asia Market Value (US$ Mn) Analysis by End-use, 2017-2032
Figure 119: South Asia Market Value Share (%) and BPS Analysis by End-use, 2022-2032
Figure 120: South Asia Market Y-o-Y Growth (%) Projections by End-use, 2022-2032
Figure 121: South Asia Market Attractiveness by Technology, 2022-2032
Figure 122: South Asia Market Attractiveness by Product , 2022-2032
Figure 123: South Asia Market Attractiveness by Application , 2022-2032
Figure 124: South Asia Market Attractiveness by End-use, 2022-2032
Figure 125: South Asia Market Attractiveness by Country, 2022-2032
Figure 126: East Asia Market Value (US$ Mn) by Technology, 2022-2032
Figure 127: East Asia Market Value (US$ Mn) by Product , 2022-2032
Figure 128: East Asia Market Value (US$ Mn) by Application , 2022-2032
Figure 129: East Asia Market Value (US$ Mn) by End-use, 2022-2032
Figure 130: East Asia Market Value (US$ Mn) by Country, 2022-2032
Figure 131: East Asia Market Value (US$ Mn) Analysis by Country, 2017-2032
Figure 132: East Asia Market Value Share (%) and BPS Analysis by Country, 2022-2032
Figure 133: East Asia Market Y-o-Y Growth (%) Projections by Country, 2022-2032
Figure 134: East Asia Market Value (US$ Mn) Analysis by Technology, 2017-2032
Figure 135: East Asia Market Value Share (%) and BPS Analysis by Technology, 2022-2032
Figure 136: East Asia Market Y-o-Y Growth (%) Projections by Technology, 2022-2032
Figure 137: East Asia Market Value (US$ Mn) Analysis by Product , 2017-2032
Figure 138: East Asia Market Value Share (%) and BPS Analysis by Product , 2022-2032
Figure 139: East Asia Market Y-o-Y Growth (%) Projections by Product , 2022-2032
Figure 140: East Asia Market Value (US$ Mn) Analysis by Application , 2017-2032
Figure 141: East Asia Market Value Share (%) and BPS Analysis by Application , 2022-2032
Figure 142: East Asia Market Y-o-Y Growth (%) Projections by Application , 2022-2032
Figure 143: East Asia Market Value (US$ Mn) Analysis by End-use, 2017-2032
Figure 144: East Asia Market Value Share (%) and BPS Analysis by End-use, 2022-2032
Figure 145: East Asia Market Y-o-Y Growth (%) Projections by End-use, 2022-2032
Figure 146: East Asia Market Attractiveness by Technology, 2022-2032
Figure 147: East Asia Market Attractiveness by Product , 2022-2032
Figure 148: East Asia Market Attractiveness by Application , 2022-2032
Figure 149: East Asia Market Attractiveness by End-use, 2022-2032
Figure 150: East Asia Market Attractiveness by Country, 2022-2032
Figure 151: Oceania Market Value (US$ Mn) by Technology, 2022-2032
Figure 152: Oceania Market Value (US$ Mn) by Product , 2022-2032
Figure 153: Oceania Market Value (US$ Mn) by Application , 2022-2032
Figure 154: Oceania Market Value (US$ Mn) by End-use, 2022-2032
Figure 155: Oceania Market Value (US$ Mn) by Country, 2022-2032
Figure 156: Oceania Market Value (US$ Mn) Analysis by Country, 2017-2032
Figure 157: Oceania Market Value Share (%) and BPS Analysis by Country, 2022-2032
Figure 158: Oceania Market Y-o-Y Growth (%) Projections by Country, 2022-2032
Figure 159: Oceania Market Value (US$ Mn) Analysis by Technology, 2017-2032
Figure 160: Oceania Market Value Share (%) and BPS Analysis by Technology, 2022-2032
Figure 161: Oceania Market Y-o-Y Growth (%) Projections by Technology, 2022-2032
Figure 162: Oceania Market Value (US$ Mn) Analysis by Product , 2017-2032
Figure 163: Oceania Market Value Share (%) and BPS Analysis by Product , 2022-2032
Figure 164: Oceania Market Y-o-Y Growth (%) Projections by Product , 2022-2032
Figure 165: Oceania Market Value (US$ Mn) Analysis by Application , 2017-2032
Figure 166: Oceania Market Value Share (%) and BPS Analysis by Application , 2022-2032
Figure 167: Oceania Market Y-o-Y Growth (%) Projections by Application , 2022-2032
Figure 168: Oceania Market Value (US$ Mn) Analysis by End-use, 2017-2032
Figure 169: Oceania Market Value Share (%) and BPS Analysis by End-use, 2022-2032
Figure 170: Oceania Market Y-o-Y Growth (%) Projections by End-use, 2022-2032
Figure 171: Oceania Market Attractiveness by Technology, 2022-2032
Figure 172: Oceania Market Attractiveness by Product , 2022-2032
Figure 173: Oceania Market Attractiveness by Application , 2022-2032
Figure 174: Oceania Market Attractiveness by End-use, 2022-2032
Figure 175: Oceania Market Attractiveness by Country, 2022-2032
Figure 176: MEA Market Value (US$ Mn) by Technology, 2022-2032
Figure 177: MEA Market Value (US$ Mn) by Product , 2022-2032
Figure 178: MEA Market Value (US$ Mn) by Application , 2022-2032
Figure 179: MEA Market Value (US$ Mn) by End-use, 2022-2032
Figure 180: MEA Market Value (US$ Mn) by Country, 2022-2032
Figure 181: MEA Market Value (US$ Mn) Analysis by Country, 2017-2032
Figure 182: MEA Market Value Share (%) and BPS Analysis by Country, 2022-2032
Figure 183: MEA Market Y-o-Y Growth (%) Projections by Country, 2022-2032
Figure 184: MEA Market Value (US$ Mn) Analysis by Technology, 2017-2032
Figure 185: MEA Market Value Share (%) and BPS Analysis by Technology, 2022-2032
Figure 186: MEA Market Y-o-Y Growth (%) Projections by Technology, 2022-2032
Figure 187: MEA Market Value (US$ Mn) Analysis by Product , 2017-2032
Figure 188: MEA Market Value Share (%) and BPS Analysis by Product , 2022-2032
Figure 189: MEA Market Y-o-Y Growth (%) Projections by Product , 2022-2032
Figure 190: MEA Market Value (US$ Mn) Analysis by Application , 2017-2032
Figure 191: MEA Market Value Share (%) and BPS Analysis by Application , 2022-2032
Figure 192: MEA Market Y-o-Y Growth (%) Projections by Application , 2022-2032
Figure 193: MEA Market Value (US$ Mn) Analysis by End-use, 2017-2032
Figure 194: MEA Market Value Share (%) and BPS Analysis by End-use, 2022-2032
Figure 195: MEA Market Y-o-Y Growth (%) Projections by End-use, 2022-2032
Figure 196: MEA Market Attractiveness by Technology, 2022-2032
Figure 197: MEA Market Attractiveness by Product , 2022-2032
Figure 198: MEA Market Attractiveness by Application , 2022-2032
Figure 199: MEA Market Attractiveness by End-use, 2022-2032
Figure 200: MEA Market Attractiveness by Country, 2022-2032
Need specific information?
Request CustomizationExplore Healthcare Insights
View Reports