DNA-Modified Plant Extracts Market Size and Share Forecast Outlook 2025 to 2035

In 2025, the DNA-Modified Plant Extracts Market has been valued at USD 950.7 Million and is anticipated to reach USD 3,702.3 Million by 2035.The rise of USD 2,751.6 Million over the decade reflects an overall expansion of nearly 290%, translating into a strong CAGR of 14.6%.This rapid progression is expected to be underpinned by scientific advances in genetic engineering and increasing consumer demand for high-performance natural actives.
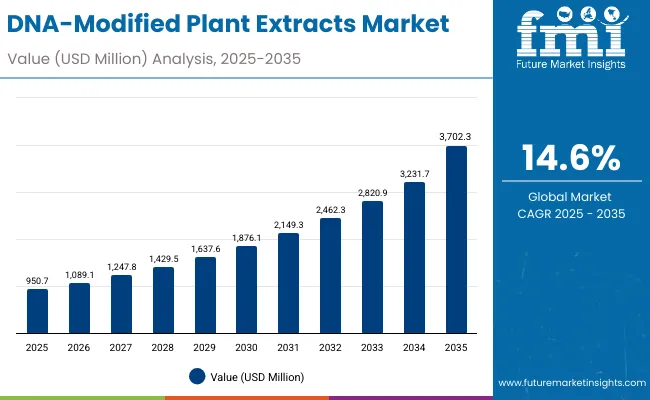
Quick Stats for DNA-Modified Plant Extracts Market

  • DNA-Modified Plant Extracts Market Value (2025): USD 950.7 Million
  • DNA-Modified Plant Extracts Market Forecast Value (2035): USD 3,702.3 Million
  • DNA-Modified Plant Extracts Market Forecast CAGR (2025 to 2035): 14.6%
  • Leading Segment in 2025: Bioengineered Claims (55.6%)
  • Key Growth Regions: Asia Pacific (China CAGR 19.8%, India CAGR 22.7%), North America, Europe
  • Top Key Players: Amyris, Givaudan, Evonik, DSM-Firmenich, BASF, Croda, Codexis, Ashland, Arcaea, Provital

Dna Modified Plant Extracts Market

DNA-Modified Plant Extracts Market Key Takeaways

Metric Value
DNA-Modified Plant Extracts Market Estimated Value in (2025E) USD 950.7 million
DNA-Modified Plant Extracts Market Forecast Value in (2035F) USD 3,702.3 million
Forecast CAGR (2025 to 2035) 14.60%

During the first five years, from 2025 to 2030, revenues are forecast to advance from USD 950.7 Million to USD 1,876.1 Million, adding USD 925.4 Million and accounting for 34% of the entire decade’s growth. This stage is expected to represent the formative period of adoption, when bioengineered claims command a 55.6% market share and "repair & regeneration" emerges as the most influential functional category with 52.5% share. Strong uptake is projected in North America and Europe, where robust regulatory frameworks are likely to encourage early adoption.

From 2030 to 2035, the market is expected to accelerate further, adding USD 1,826.2 Million and contributing 66% of the total decade expansion. As the market climbs from USD 1,876.1 Million to USD 3,702.3 Million, Asia Pacific particularly China and India is projected to lead the growth trajectory with CAGRs of 19.8% and 22.7% respectively. Consumer acceptance of bioengineered formulations is expected to rise steadily, with transparent labeling and clinically validated outcomes playing critical roles in sustaining long-term momentum.

This outlook reflects a shift from niche scientific innovation toward mainstream adoption, signaling a decade of strong and sustained market expansion.

From 2025 to 2030, the market is expected to nearly double, rising from USD 950.7 Million to USD 1,876.1 Million, powered by increasing adoption of bioengineered solutions and strong demand for repair & regeneration functions. By 2035, the market is projected to quadruple, reaching USD 3,702.3 Million, with Asia Pacific driving acceleration. Competitive strength is expected to shift from broad natural actives to engineered, traceable, and clinically validated formulations, enabling higher differentiation and sustained pricing power.

Why the DNA-Modified Plant Extracts Market is growing?

The growth of the DNA-Modified Plant Extracts Market is being propelled by the convergence of biotechnology innovation and rising consumer expectations for effective, sustainable, and traceable ingredients. Advances in genetic engineering have enabled precise modifications that enhance bioavailability and potency, creating new benchmarks for efficacy within personal care and therapeutic formulations. The preference for bioengineered claims, holding 55.6% share in 2025, highlights the importance of scientifically validated solutions that deliver measurable outcomes.

Increasing focus on repair and regeneration functions, which command 52.5% market share, reflects consumer demand for visible and long-lasting skin benefits. Asia Pacific, led by China and India, is anticipated to accelerate adoption through supportive regulatory clarity and strong digital penetration, positioning the region as a global growth hub. Moreover, partnerships between ingredient innovators and premium skincare brands are expected to expand product pipelines and accelerate commercialization, ensuring the market sustains its double-digit growth trajectory through 2035.

Segmental Analysis

The DNA-Modified Plant Extracts Market has been segmented by Claim, Function, and Product Type, reflecting the diversity of innovation and consumer demand within the sector. Each category highlights how engineered approaches are reshaping value capture across applications. Claims demonstrate the rising significance of bioengineered solutions supported by data-driven efficacy. Functions illustrate the alignment of product benefits with consumer expectations for repair and regenerative outcomes.

Product type segmentation reveals how specific formats such as serums are emerging as delivery leaders, catering to premium positioning and targeted applications. This structured segmentation provides a comprehensive understanding of the evolving landscape and reveals where the strongest value creation is expected across the forecast horizon, enabling stakeholders to prioritize strategies effectively.
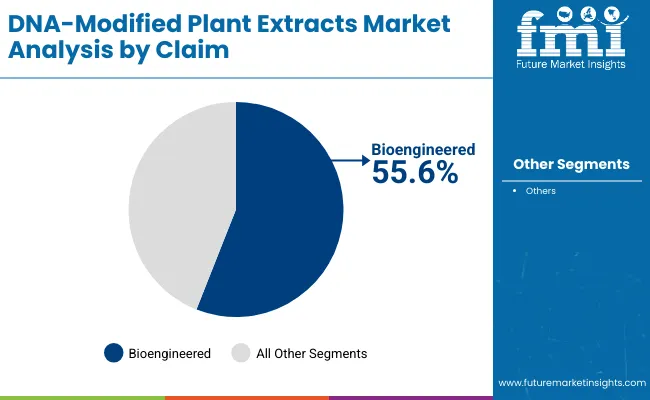
Insights into the Claim Segment with Bioengineered Leading in Market Share

Dna Modified Plant Extracts Market By Claim

Segment Market Value Share, 2025
Bioengineered 55.6%
Others 44.4%

Bioengineered claims are projected to lead the DNA-Modified Plant Extracts Market in 2025 with a 55.6% share valued at USD 528.3 Million. This dominance is expected to be driven by growing preference for traceable, scientifically validated ingredients that ensure consistent efficacy and safety. Regulatory frameworks are anticipated to further encourage transparency, which will amplify trust in engineered solutions. While "Others" still contribute 44.4% of the market, their positioning is expected to be challenged by the stronger performance of bioengineered offerings as clinical-grade results become a primary differentiator. With increasing consumer awareness, the share of bioengineered claims is likely to expand further, reinforcing their role as the backbone of the category.
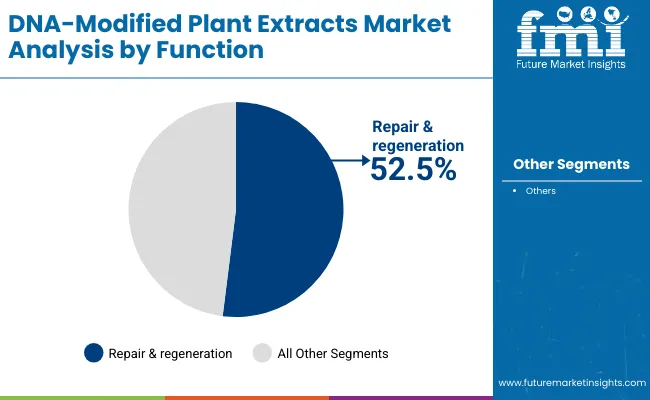
Insights into the Function Segment with Repair & Regeneration Dominating

Dna Modified Plant Extracts Market By Function

Segment Market Value Share, 2025
Repair & regeneration 52.5%
Others 47.5%

Repair and regeneration is expected to hold a dominant 52.5% share in 2025, valued at USD 498.9 Million. This segment’s leadership is being shaped by rising consumer demand for products that deliver visible improvements in skin recovery, barrier strength, and overall resilience. As wellness-focused consumers prioritize regenerative benefits, innovation in biomimetic pathways and clinical validation is projected to accelerate growth. While "Others" account for 47.5% share, their presence reflects broader market diversity, yet the regenerative focus is anticipated to remain superior due to clear differentiation in outcomes. As regulatory and clinical data availability increases, repair and regeneration is likely to retain its dominance, positioning itself as the most valuable function category for the coming decade.
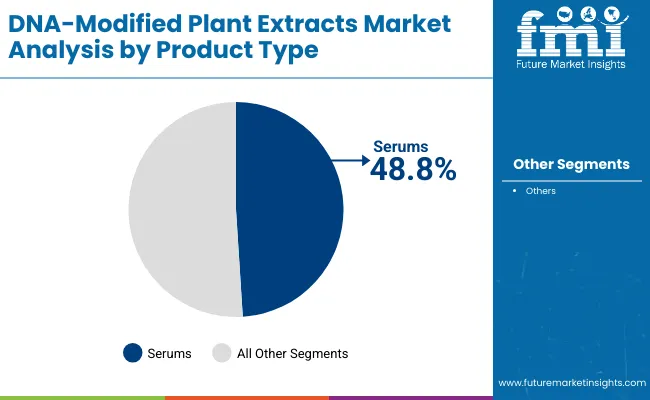
Insights into the Product Type Segment with Serums Advancing Strongly

Dna Modified Plant Extracts Market By Product

Segment Market Value Share, 2025
Serums 48.8%
Others 51.2%

Serums are projected to secure a 48.8% share in 2025, translating into USD 460.6 Million in value. This segment’s strength is expected to stem from its compatibility with high-potency, precision-targeted formulations, making it the preferred choice for DNA-modified extracts. As consumers seek premium solutions offering quick absorption and visible results, serums are anticipated to serve as a strategic delivery format. Although "Others" collectively hold 51.2% share, their broader composition dilutes focus, enabling serums to capture higher value per unit. Innovation in texture, stability, and encapsulation technologies is projected to further elevate serum performance, supporting their trajectory as a core growth driver within the product type category by 2035.

What are the Drivers, Restraints, and Key Trends of the DNA-Modified Plant Extracts Market?

The DNA-Modified Plant Extracts Market is shaped by evolving consumer expectations and rapid advances in biotechnology, yet the trajectory is tempered by regulatory intricacies, infrastructure gaps, and shifting definitions of natural authenticity across global regions, creating a complex growth landscape.

Integration of Precision Genomics into Ingredient Pipelines

Market expansion is expected to be accelerated by the integration of precision genomics, where CRISPR-edited botanicals and engineered actives are designed to mimic cellular pathways with unprecedented accuracy. Unlike conventional extracts, these innovations allow for scalable replication of bioactive properties without agricultural volatility. This dynamic is anticipated to transform supply reliability, enabling brands to demonstrate consistent efficacy backed by genomic traceability. As competitive positioning becomes increasingly dependent on data-backed differentiation, adoption of DNA-modified inputs is projected to deliver both functional superiority and reputational resilience, creating a powerful driver of long-term growth.

Fragmented Standards for Claim Validation

Growth prospects are likely to face challenges from fragmented global standards governing bioengineered labeling and efficacy claims. Inconsistent definitions of "bioengineered" or "clean-label" across jurisdictions complicate cross-border launches and elevate compliance costs. This ambiguity not only limits scalability but also increases the risk of consumer mistrust when marketing language diverges from regulatory expectations. Companies are projected to navigate these pressures by investing in harmonized certification frameworks and multi-market validation studies, yet near-term friction is expected to persist. As a result, expansion potential could be partially constrained until global consensus or widely accepted third-party benchmarks emerge.
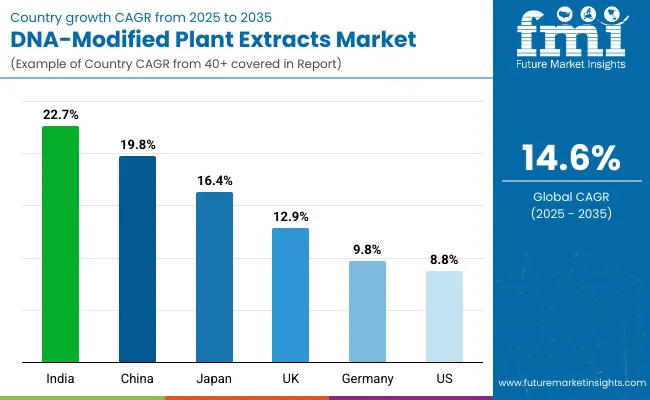
Analysis of DNA-Modified Plant Extracts Market By Key Countries

Dna Modified Plant Extracts Market By Country

Countries CAGR
China 19.8%
USA 8.8%
India 22.7%
UK 12.9%
Germany 9.8%
Japan 16.4%

The global DNA-Modified Plant Extracts Market is expected to expand unevenly across countries, shaped by regulatory readiness, consumer openness to bioengineered products, and the scale of domestic biotech ecosystems. India is projected to lead with a CAGR of 22.7% from 2025 to 2035, supported by rapid adoption of advanced agricultural biotechnology, favorable policies promoting innovation, and rising demand for functional skincare within its expanding middle class. China follows closely with 19.8% CAGR, where strong government-backed investments in biotech R&D and rising consumer acceptance of engineered actives are anticipated to transform the market into a high-value growth hub.

Japan, with 16.4% CAGR, is expected to sustain momentum through premium positioning and integration of DNA-modified actives into advanced cosmeceutical formulations. The UK, at 12.9%, and Germany, at 9.8%, are forecast to remain central to Europe’s trajectory, driven by stringent safety standards and increasing demand for clinically validated, sustainable actives. Meanwhile, the USA shows a comparatively moderate CAGR of 8.8%, reflecting its market maturity but also highlighting opportunities in clinical-grade product positioning and collaborations between biotech firms and established cosmetic brands.

This country-level outlook underscores how Asia-Pacific is expected to outperform, while Europe and North America maintain steady but differentiated adoption pathways.
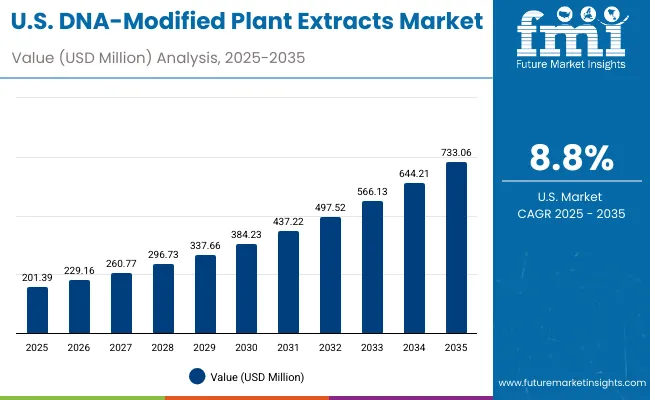
Sales Outlook for DNA-Modified Plant Extracts in the United States

Dna Modified Plant Extracts Market Usa

Year USA DNA-Modified Plant Extracts Market (USD Million)
2025 201.39
2026 229.16
2027 260.77
2028 296.73
2029 337.66
2030 384.23
2031 437.22
2032 497.52
2033 566.13
2034 644.21
2035 733.06

The DNA-Modified Plant Extracts Market in the United States is projected to expand at a CAGR of 13.8% from 2025 to 2035, supported by advanced biotech research, regulatory clarity, and consumer inclination toward validated natural actives. Market size is anticipated to grow from USD 201.39 Million in 2025 to USD 733.06 Million by 2035.

Premium skincare and therapeutic categories are expected to anchor growth, with bioengineered claims gaining dominance due to stronger efficacy validation and transparent labeling requirements. Further expansion is anticipated in healthcare applications, where DNA-modified extracts will increasingly be integrated into clinical-grade formulations.

  • Bioengineered claims are expected to sustain dominance through scientific validation and consumer confidence.
  • Collaborations between biotech developers and leading cosmetic brands are projected to accelerate commercialization.
  • Premium and clinical-grade formulations are anticipated to drive long-term value creation.

Growth and Expansion Outlook for DNA-Modified Plant Extracts Market in the United Kingdom

The DNA-Modified Plant Extracts Market in the UK is forecast to expand at a CAGR of 12.9% between 2025 and 2035, supported by a regulatory environment that prioritizes product safety and sustainability. Market adoption is expected to be fueled by demand for bioengineered claims as consumers increasingly seek clinically validated and environmentally responsible products. Transparent labeling practices and traceability standards are projected to shape consumer trust, ensuring stronger uptake of DNA-modified formulations. The UK’s advanced skincare and pharmaceutical sectors are likely to serve as early adopters, integrating next-generation actives into premium offerings.

  • Regulatory emphasis on sustainability and safety is expected to accelerate market penetration.
  • Premium skincare and pharma-grade applications are anticipated to be primary growth drivers.
  • Bioengineered claims are projected to outperform due to trust in clinical validation.
  • High consumer preference for traceability is expected to reinforce adoption.

Growth and Expansion Outlook for DNA-Modified Plant Extracts Market in India

The DNA-Modified Plant Extracts Market in India is projected to grow at a CAGR of 22.7% from 2025 to 2035, making it the fastest-growing country market globally. This acceleration is anticipated to be driven by rising demand for functional skincare in a rapidly expanding middle-class population and supportive government initiatives promoting biotech innovation. The integration of DNA-modified extracts into herbal and ayurvedic-inspired formulations is expected to create a unique hybrid positioning, resonating strongly with local preferences. Expanding R&D investment and a growing ecosystem of biotech startups are likely to further enhance the pace of adoption.

  • Strong CAGR of 22.7% reflects rapid adoption and consumer openness to innovation.
  • Hybridization with traditional herbal formulations is expected to accelerate market penetration.
  • Government-backed biotech programs are projected to expand commercialization opportunities.
  • Rising middle-class purchasing power is anticipated to fuel premium skincare demand.

Sales Outlook for DNA-Modified Plant Extracts in China

The DNA-Modified Plant Extracts Market in China is expected to grow at a CAGR of 19.8% between 2025 and 2035, driven by government-backed biotech investments and strong digital-first adoption in skincare and wellness markets. Consumer confidence in engineered actives is projected to rise due to transparent labeling regulations and high awareness of clinical efficacy. The country’s large manufacturing base is expected to enable cost-efficient scaling of DNA-modified actives, positioning China as both a key consumer and global supplier. Domestic brands are likely to leverage DNA-modified inputs to differentiate portfolios and capture premium urban segments.
  • Government investment in biotech R&D is expected to reinforce innovation pipelines.
  • Transparent regulations are projected to boost consumer trust and adoption.
  • Manufacturing scale is anticipated to position China as a key exporter.
  • Urban premium skincare demand is expected to drive early adoption.

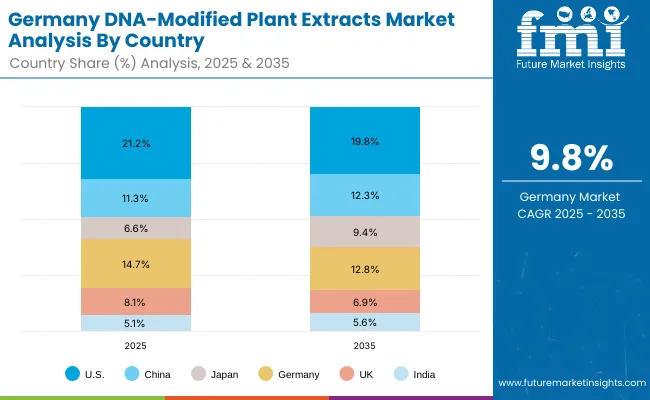
In-depth Analysis of DNA-Modified Plant Extracts in Germany

Dna Modified Plant Extracts Market Germany

Countries 2025
USA 21.2%
China 11.3%
Japan 6.6%
Germany 14.7%
UK 8.1%
India 5.1%
Countries 2035
USA 19.8%
China 12.3%
Japan 9.4%
Germany 12.8%
UK 6.9%
India 5.6%

The DNA-Modified Plant Extracts Market in Germany is projected to record a CAGR of 9.8% from 2025 to 2035, supported by Europe’s strict compliance standards and consumer focus on clinically validated sustainability solutions. The German market is expected to favor DNA-modified extracts with proven efficacy and reduced environmental impact, aligning with the country’s strong sustainability culture. Pharmaceutical and cosmeceutical players are projected to integrate engineered actives into clinical-grade products, enhancing credibility and adoption. Partnerships between biotech innovators and established European brands are anticipated to accelerate market entry and expand product pipelines.
  • Regulatory-driven focus on safety and sustainability is expected to guide adoption.
  • Clinical-grade cosmeceuticals are projected to lead demand in Germany.
  • Partnerships with European brand leaders are anticipated to enhance commercialization.
  • Sustainability narratives are expected to resonate strongly with German consumers.

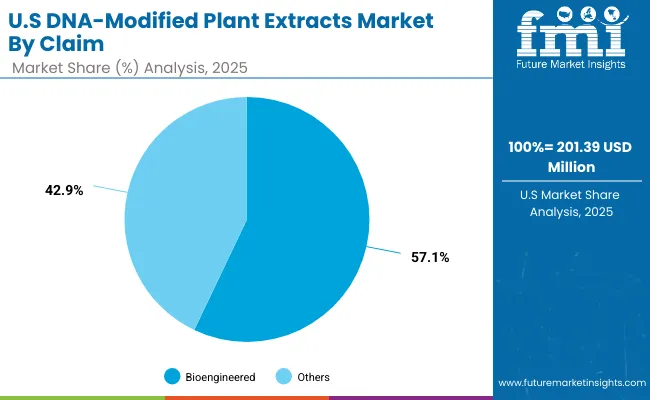
Growth Outlook for DNA-Modified Plant Extracts Market in USA

Dna Modified Plant Extracts Market Usa 2

Segment Market Value Share, 2025
Bioengineered 57.1%
Others 42.9%

The DNA-Modified Plant Extracts Market in the United States is projected at USD 201.39 Million in 2025. Bioengineered claims contribute 57.1%, while others account for 42.9%, highlighting the country’s preference for scientifically validated and clinically substantiated formulations. This dominance of bioengineered inputs reflects the importance of data-driven efficacy in an advanced regulatory environment where transparency and traceability are prioritized. The segment’s strength is expected to be reinforced by consumer demand for premium, high-performance skincare and therapeutic solutions that demonstrate measurable outcomes.

The competitive dynamic is anticipated to be reshaped by collaborations between biotech developers and established cosmetic brands, ensuring robust commercialization pipelines. Growing integration of DNA-modified actives into clinical-grade formulations is likely to strengthen long-term value creation.
  • USA market size projected at USD 201.39 Million in 2025.
  • Bioengineered claims dominate at 57.1% vs 42.9% for others.
  • Consumer trust in efficacy validation drives segment leadership.
  • Partnerships with premium brands expected to accelerate adoption.

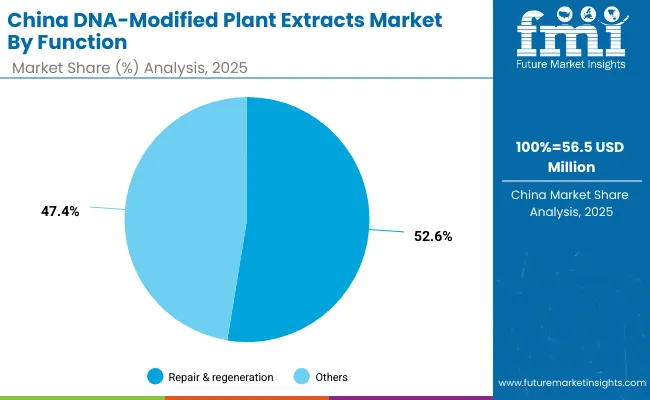
Opportunity Analysis of China DNA-Modified Plant Extracts Market

Dna Modified Plant Extracts Market China

Segment Market Value Share, 2025
Repair & regeneration 52.6%
Others 47.4%

The DNA-Modified Plant Extracts Market in China is projected to record significant momentum, with repair & regeneration functions leading at 52.6% share in 2025, equal to USD 56.5 Million. This functional dominance highlights the market’s alignment with consumer demand for visible improvements in skin repair, resilience, and barrier strength. The emphasis on repair-driven benefits is expected to be reinforced by the country’s fast-expanding premium skincare sector, where performance validation and clinical outcomes are prioritized.

The adoption of DNA-modified extracts in China is likely to accelerate under supportive government policies, increased biotech funding, and rising consumer openness to scientifically engineered actives. Domestic players are projected to integrate repair-centric DNA-modified actives into new formulations, expanding differentiation across mid-tier and premium categories.
  • China’s function segment led by repair & regeneration at 52.6% in 2025.
  • Growing demand for skin resilience and recovery supports category expansion.
  • Government-backed biotech investment is expected to accelerate adoption.
  • Domestic brands projected to leverage engineered actives for premium positioning.

Competitive Landscape of DNA-Modified Plant Extracts Market

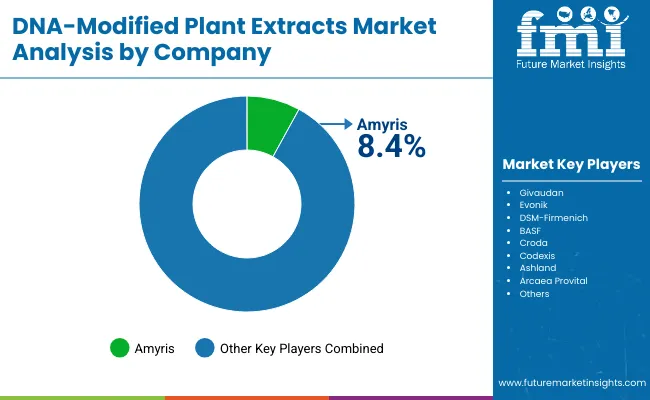
Dna Modified Plant Extracts Market By Company

The DNA-Modified Plant Extracts Market is moderately fragmented, with a mix of global biotechnology pioneers, established ingredient suppliers, and emerging innovators competing across personal care, nutraceuticals, and pharmaceutical applications. Amyris holds the largest identified share in 2025 at 8.4%, positioning it as a leading player globally. The remainder of the market, representing 91.6%, is distributed among other players such as Givaudan, Evonik, DSM-Firmenich, BASF, Croda, Codexis, Ashland, Arcaea, and Provital. This fragmentation indicates a high degree of competition where differentiation is expected to depend less on scale and more on proprietary biotechnology, clinical validation, and sustainability positioning.

Amyris’ leadership is attributed to its deep expertise in synthetic biology and fermentation platforms, enabling consistent production of DNA-modified actives at scale. Other companies are expected to strengthen their positions by integrating genomics-driven pipelines with advanced delivery systems and clean-label branding. Mid-sized and emerging players are likely to focus on niche opportunities such as vegan claims, clinical-grade positioning, and functional specialization like repair and regeneration.

Competitive differentiation is projected to shift toward ecosystem building, where partnerships with premium skincare and wellness brands, coupled with data-driven efficacy validation, become decisive. Subscription models for ingredient access, digital twins for product testing, and transparent sourcing frameworks are anticipated to shape the next wave of leadership.

Key Developments in DNA-Modified Plant Extracts Market

  • May 29, 2025Amyris announced that full ownership of its Precision Fermentation Plant in Barra Bonita, Brazil was assumed after its "RealSweet" joint venture with Ingredion was wound down. This move was expected to increase capacity and control over fermentation-based actives, helping scale DNA-modified ingredient production
  • February 14, 2025China’s Ministry of Agriculture issued guidelines under the 2024-2028 biotech initiative to promote gene-editing tools and develop high-yield, multi-resistant varieties of wheat, corn, and soybeans. This regulatory step was expected to strengthen R&D investment and domestically produce engineered plant inputs.

Scope of the Report

Item Value
Quantitative Units USD 950.7 Million (2025E) → USD 3,702.3 Million (2035F)
Claim Bioengineered (55.6%, USD 528.3 Million in 2025), Others (44.4%, USD 422.53 Million in 2025)
Function Repair & Regeneration (52.5%, USD 498.9 Million in 2025), Others (47.5%, USD 451.34 Million in 2025)
Product Type Serums (48.8%, USD 460.6 Million in 2025), Others (51.2%, USD 486.3 Million in 2025)
Distribution Channel E-commerce, Premium Retail, Pharmacies, Dermatology Clinics
End-use Applications Skincare & Cosmetics, Dermatology Clinics, Nutraceuticals, Clinical-grade Therapeutics, Personal Wellness Products
Regions Covered North America, Europe, Asia-Pacific, Latin America, Middle East & Africa
Countries Covered United States, Canada, Germany, United Kingdom, France, China, Japan, India, Brazil, South Africa
Key Companies Profiled Amyris, Givaudan, Evonik, DSM-Firmenich, BASF, Croda, Codexis, Ashland, Arcaea, Provital
Additional Attributes Dollar sales by claim, function, and product type; adoption trends in bioengineered and clinical-grade claims; rising consumer preference for repair & regeneration; expansion in APAC markets with high CAGR (India 22.7%, China 19.8%); ecosystem strategies through biotech-brand partnerships; increasing role of clinical validation, transparent labeling, and sustainability narratives.

Key Segments

By Source:

  • CRISPR-edited botanicals
  • Genetically enhanced algae
  • Modified herbal actives
  • Engineered peptides

By Function:

  • Anti-aging
  • Repair & regeneration
  • Skin brightening
  • Hydration

By Product Type:

  • Serums
  • Creams/lotions
  • Ampoules
  • Masks

By Channel:

  • E-commerce
  • Premium retail
  • Pharmacies
  • Dermatology clinics

By Claim:

  • Bioengineered
  • Clinical-grade
  • Vegan
  • Clean-label

By Region:

  • North America
  • Latin America
  • Europe
  • East Asia
  • South Asia & Pacific
  • Middle East and Africa

Table of Content

  1. Executive Summary
    • Global Market Outlook
    • Demand-side Trends
    • Supply-side Trends
    • Technology Roadmap Analysis
    • Analysis and Recommendations
  2. Market Overview
    • Market Coverage / Taxonomy
    • Market Definition / Scope / Limitations
  3. Market Background
    • Market Dynamics
      • Drivers
      • Restraints
      • Opportunity
      • Trends
    • Scenario Forecast
      • Demand in Optimistic Scenario
      • Demand in Likely Scenario
      • Demand in Conservative Scenario
    • Opportunity Map Analysis
    • Product Life Cycle Analysis
    • Supply Chain Analysis
    • Investment Feasibility Matrix
    • Value Chain Analysis
    • PESTLE and Porter’s Analysis
    • Regulatory Landscape
    • Regional Parent Market Outlook
    • Production and Consumption Statistics
    • Import and Export Statistics
  4. Global Market Analysis 2020 to 2024 and Forecast, 2025 to 2035
    • Historical Market Size Value (USD Million) Analysis, 2020 to 2024
    • Current and Future Market Size Value (USD Million) Projections, 2025 to 2035
      • Y-o-Y Growth Trend Analysis
      • Absolute $ Opportunity Analysis
  5. Global Market Pricing Analysis 2020 to 2024 and Forecast 2025 to 2035
  6. Global Market Analysis 2020 to 2024 and Forecast 2025 to 2035, By Source
    • Introduction / Key Findings
    • Historical Market Size Value (USD Million) Analysis By Source, 2020 to 2024
    • Current and Future Market Size Value (USD Million) Analysis and Forecast By Source, 2025 to 2035
      • CRISPR-edited botanicals
      • Genetically enhanced algae
      • Modified herbal actives
      • Engineered peptides
    • Y-o-Y Growth Trend Analysis By Source, 2020 to 2024
    • Absolute $ Opportunity Analysis By Source, 2025 to 2035
  7. Global Market Analysis 2020 to 2024 and Forecast 2025 to 2035, By Function
    • Introduction / Key Findings
    • Historical Market Size Value (USD Million) Analysis By Function, 2020 to 2024
    • Current and Future Market Size Value (USD Million) Analysis and Forecast By Function, 2025 to 2035
      • Anti-aging
      • Repair & regeneration
      • Skin brightening
      • Hydration
    • Y-o-Y Growth Trend Analysis By Function, 2020 to 2024
    • Absolute $ Opportunity Analysis By Function, 2025 to 2035
  8. Global Market Analysis 2020 to 2024 and Forecast 2025 to 2035, By Product Type
    • Introduction / Key Findings
    • Historical Market Size Value (USD Million) Analysis By Product Type, 2020 to 2024
    • Current and Future Market Size Value (USD Million) Analysis and Forecast By Product Type, 2025 to 2035
      • Serums
      • Creams/lotions
      • Ampoules
      • Masks
    • Y-o-Y Growth Trend Analysis By Product Type, 2020 to 2024
    • Absolute $ Opportunity Analysis By Product Type, 2025 to 2035
  9. Global Market Analysis 2020 to 2024 and Forecast 2025 to 2035, By Channel
    • Introduction / Key Findings
    • Historical Market Size Value (USD Million) Analysis By Channel, 2020 to 2024
    • Current and Future Market Size Value (USD Million) Analysis and Forecast By Channel, 2025 to 2035
      • E-commerce
      • Premium retail
      • Pharmacies
      • Dermatology clinics
    • Y-o-Y Growth Trend Analysis By Channel, 2020 to 2024
    • Absolute $ Opportunity Analysis By Channel, 2025 to 2035
  10. Global Market Analysis 2020 to 2024 and Forecast 2025 to 2035, By Claim
    • Introduction / Key Findings
    • Historical Market Size Value (USD Million) Analysis By Claim, 2020 to 2024
    • Current and Future Market Size Value (USD Million) Analysis and Forecast By Claim, 2025 to 2035
      • Bioengineered
      • Clinical-grade
      • Vegan
      • Clean-label
    • Y-o-Y Growth Trend Analysis By Claim, 2020 to 2024
    • Absolute $ Opportunity Analysis By Claim, 2025 to 2035
  11. Global Market Analysis 2020 to 2024 and Forecast 2025 to 2035, By Region
    • Introduction
    • Historical Market Size Value (USD Million) Analysis By Region, 2020 to 2024
    • Current Market Size Value (USD Million) Analysis and Forecast By Region, 2025 to 2035
      • North America
      • Latin America
      • Europe
      • East Asia
      • South Asia & Pacific
      • Middle East and Africa
    • Market Attractiveness Analysis By Region
  12. North America Market Analysis 2020 to 2024 and Forecast 2025 to 2035, By Country
    • Historical Market Size Value (USD Million) Trend Analysis By Market Taxonomy, 2020 to 2024
    • Market Size Value (USD Million) Forecast By Market Taxonomy, 2025 to 2035
      • By Country
        • USA
        • Canada
      • By Source
      • By Function
      • By Product Type
      • By Channel
      • By Claim
    • Market Attractiveness Analysis
      • By Country
      • By Source
      • By Function
      • By Product Type
      • By Channel
      • By Claim
    • Key Takeaways
  13. Latin America Market Analysis 2020 to 2024 and Forecast 2025 to 2035, By Country
    • Historical Market Size Value (USD Million) Trend Analysis By Market Taxonomy, 2020 to 2024
    • Market Size Value (USD Million) Forecast By Market Taxonomy, 2025 to 2035
      • By Country
        • Brazil
        • Mexico
        • Colombia
        • Rest of Latin America
      • By Source
      • By Function
      • By Product Type
      • By Channel
      • By Claim
    • Market Attractiveness Analysis
      • By Country
      • By Source
      • By Function
      • By Product Type
      • By Channel
      • By Claim
    • Key Takeaways
  14. Europe Market Analysis 2020 to 2024 and Forecast 2025 to 2035, By Country
    • Historical Market Size Value (USD Million) Trend Analysis By Market Taxonomy, 2020 to 2024
    • Market Size Value (USD Million) Forecast By Market Taxonomy, 2025 to 2035
      • By Country
        • Germany
        • UK
        • France
        • Italy
        • Spain
        • Belgium
        • Netherlands
        • Nordic
        • Switzerland
        • Russia
        • Poland
        • Rest of Europe
      • By Source
      • By Function
      • By Product Type
      • By Channel
      • By Claim
    • Market Attractiveness Analysis
      • By Country
      • By Source
      • By Function
      • By Product Type
      • By Channel
      • By Claim
    • Key Takeaways
  15. East Asia Market Analysis 2020 to 2024 and Forecast 2025 to 2035, By Country
    • Historical Market Size Value (USD Million) Trend Analysis By Market Taxonomy, 2020 to 2024
    • Market Size Value (USD Million) Forecast By Market Taxonomy, 2025 to 2035
      • By Country
        • China
        • Japan
        • South Korea
      • By Source
      • By Function
      • By Product Type
      • By Channel
      • By Claim
    • Market Attractiveness Analysis
      • By Country
      • By Source
      • By Function
      • By Product Type
      • By Channel
      • By Claim
    • Key Takeaways
  16. South Asia & Pacific Market Analysis 2020 to 2024 and Forecast 2025 to 2035, By Country
    • Historical Market Size Value (USD Million) Trend Analysis By Market Taxonomy, 2020 to 2024
    • Market Size Value (USD Million) Forecast By Market Taxonomy, 2025 to 2035
      • By Country
        • India
        • Thailand
        • Malaysia
        • Indonesia
        • Singapore
        • Vietnam
        • Australia
        • New Zealand
        • Rest of South Asia
      • By Source
      • By Function
      • By Product Type
      • By Channel
      • By Claim
    • Market Attractiveness Analysis
      • By Country
      • By Source
      • By Function
      • By Product Type
      • By Channel
      • By Claim
    • Key Takeaways
  17. Middle East and Africa Market Analysis 2020 to 2024 and Forecast 2025 to 2035, By Country
    • Historical Market Size Value (USD Million) Trend Analysis By Market Taxonomy, 2020 to 2024
    • Market Size Value (USD Million) Forecast By Market Taxonomy, 2025 to 2035
      • By Country
        • Turkey
        • UAE
        • Saudi Arabia
        • Israel
        • Other GCC Countries
        • North Africa
        • South Africa
      • By Source
      • By Function
      • By Product Type
      • By Channel
      • By Claim
    • Market Attractiveness Analysis
      • By Country
      • By Source
      • By Function
      • By Product Type
      • By Channel
      • By Claim
    • Key Takeaways
  18. Key Countries Market Analysis
    • USA
      • Pricing Analysis
      • Market Share Analysis, 2024
        • By Source
        • By Function
        • By Product Type
        • By Channel
        • By Claim
    • Canada
      • Pricing Analysis
      • Market Share Analysis, 2024
        • By Source
        • By Function
        • By Product Type
        • By Channel
        • By Claim
    • Mexico
      • Pricing Analysis
      • Market Share Analysis, 2024
        • By Source
        • By Function
        • By Product Type
        • By Channel
        • By Claim
    • Brazil
      • Pricing Analysis
      • Market Share Analysis, 2024
        • By Source
        • By Function
        • By Product Type
        • By Channel
        • By Claim
    • Germany
      • Pricing Analysis
      • Market Share Analysis, 2024
        • By Source
        • By Function
        • By Product Type
        • By Channel
        • By Claim
    • UK
      • Pricing Analysis
      • Market Share Analysis, 2024
        • By Source
        • By Function
        • By Product Type
        • By Channel
        • By Claim
    • Italy
      • Pricing Analysis
      • Market Share Analysis, 2024
        • By Source
        • By Function
        • By Product Type
        • By Channel
        • By Claim
    • Spain
      • Pricing Analysis
      • Market Share Analysis, 2024
        • By Source
        • By Function
        • By Product Type
        • By Channel
        • By Claim
    • France
      • Pricing Analysis
      • Market Share Analysis, 2024
        • By Source
        • By Function
        • By Product Type
        • By Channel
        • By Claim
    • India
      • Pricing Analysis
      • Market Share Analysis, 2024
        • By Source
        • By Function
        • By Product Type
        • By Channel
        • By Claim
    • Australia & New Zealand
      • Pricing Analysis
      • Market Share Analysis, 2024
        • By Source
        • By Function
        • By Product Type
        • By Channel
        • By Claim
    • China
      • Pricing Analysis
      • Market Share Analysis, 2024
        • By Source
        • By Function
        • By Product Type
        • By Channel
        • By Claim
    • Japan
      • Pricing Analysis
      • Market Share Analysis, 2024
        • By Source
        • By Function
        • By Product Type
        • By Channel
        • By Claim
    • South Korea
      • Pricing Analysis
      • Market Share Analysis, 2024
        • By Source
        • By Function
        • By Product Type
        • By Channel
        • By Claim
    • Russia
      • Pricing Analysis
      • Market Share Analysis, 2024
        • By Source
        • By Function
        • By Product Type
        • By Channel
        • By Claim
    • Poland
      • Pricing Analysis
      • Market Share Analysis, 2024
        • By Source
        • By Function
        • By Product Type
        • By Channel
        • By Claim
    • Hungary
      • Pricing Analysis
      • Market Share Analysis, 2024
        • By Source
        • By Function
        • By Product Type
        • By Channel
        • By Claim
    • Kingdom of Saudi Arabia
      • Pricing Analysis
      • Market Share Analysis, 2024
        • By Source
        • By Function
        • By Product Type
        • By Channel
        • By Claim
    • South Africa
      • Pricing Analysis
      • Market Share Analysis, 2024
        • By Source
        • By Function
        • By Product Type
        • By Channel
        • By Claim
  19. Market Structure Analysis
    • Competition Dashboard
    • Competition Benchmarking
    • Market Share Analysis of Top Players
      • By Regional
      • By Source
      • By Function
      • By Product Type
      • By Channel
      • By Claim
  20. Competition Analysis
    • Competition Deep Dive
      • Amyris
        • Overview
        • Product Portfolio
        • Profitability by Market Segments (Product/Age /Sales Channel/Region)
        • Sales Footprint
        • Strategy Overview
        • Givaudan
        • Evonik
        • DSM-Firmenich
        • BASF
        • Croda
        • Codexis
        • Ashland
        • Arcaea
        • Provital
    • Assumptions & Acronyms Used
    • Research Methodology

List of Tables

  • Table 1: Global Market Value (USD Million) Forecast by Region, 2020-2035
  • Table 2: Global Market Value (USD Million) Forecast by Source, 2020-2035
  • Table 3: Global Market Value (USD Million) Forecast by Function, 2020-2035
  • Table 4: Global Market Value (USD Million) Forecast by Product Type, 2020-2035
  • Table 5: Global Market Value (USD Million) Forecast by Channel, 2020-2035
  • Table 6: Global Market Value (USD Million) Forecast by Claim, 2020-2035
  • Table 7: North America Market Value (USD Million) Forecast by Country, 2020-2035
  • Table 8: North America Market Value (USD Million) Forecast by Source, 2020-2035
  • Table 9: North America Market Value (USD Million) Forecast by Function, 2020-2035
  • Table 10: North America Market Value (USD Million) Forecast by Product Type, 2020-2035
  • Table 11: North America Market Value (USD Million) Forecast by Channel, 2020-2035
  • Table 12: North America Market Value (USD Million) Forecast by Claim, 2020-2035
  • Table 13: Latin America Market Value (USD Million) Forecast by Country, 2020-2035
  • Table 14: Latin America Market Value (USD Million) Forecast by Source, 2020-2035
  • Table 15: Latin America Market Value (USD Million) Forecast by Function, 2020-2035
  • Table 16: Latin America Market Value (USD Million) Forecast by Product Type, 2020-2035
  • Table 17: Latin America Market Value (USD Million) Forecast by Channel, 2020-2035
  • Table 18: Latin America Market Value (USD Million) Forecast by Claim, 2020-2035
  • Table 19: Europe Market Value (USD Million) Forecast by Country, 2020-2035
  • Table 20: Europe Market Value (USD Million) Forecast by Source, 2020-2035
  • Table 21: Europe Market Value (USD Million) Forecast by Function, 2020-2035
  • Table 22: Europe Market Value (USD Million) Forecast by Product Type, 2020-2035
  • Table 23: Europe Market Value (USD Million) Forecast by Channel, 2020-2035
  • Table 24: Europe Market Value (USD Million) Forecast by Claim, 2020-2035
  • Table 25: East Asia Market Value (USD Million) Forecast by Country, 2020-2035
  • Table 26: East Asia Market Value (USD Million) Forecast by Source, 2020-2035
  • Table 27: East Asia Market Value (USD Million) Forecast by Function, 2020-2035
  • Table 28: East Asia Market Value (USD Million) Forecast by Product Type, 2020-2035
  • Table 29: East Asia Market Value (USD Million) Forecast by Channel, 2020-2035
  • Table 30: East Asia Market Value (USD Million) Forecast by Claim, 2020-2035
  • Table 31: South Asia & Pacific Market Value (USD Million) Forecast by Country, 2020-2035
  • Table 32: South Asia & Pacific Market Value (USD Million) Forecast by Source, 2020-2035
  • Table 33: South Asia & Pacific Market Value (USD Million) Forecast by Function, 2020-2035
  • Table 34: South Asia & Pacific Market Value (USD Million) Forecast by Product Type, 2020-2035
  • Table 35: South Asia & Pacific Market Value (USD Million) Forecast by Channel, 2020-2035
  • Table 36: South Asia & Pacific Market Value (USD Million) Forecast by Claim, 2020-2035
  • Table 37: Middle East and Africa Market Value (USD Million) Forecast by Country, 2020-2035
  • Table 38: Middle East and Africa Market Value (USD Million) Forecast by Source, 2020-2035
  • Table 39: Middle East and Africa Market Value (USD Million) Forecast by Function, 2020-2035
  • Table 40: Middle East and Africa Market Value (USD Million) Forecast by Product Type, 2020-2035
  • Table 41: Middle East and Africa Market Value (USD Million) Forecast by Channel, 2020-2035
  • Table 42: Middle East and Africa Market Value (USD Million) Forecast by Claim, 2020-2035

List of Figures

  • Figure 1: Global Market Pricing Analysis
  • Figure 2: Global Market Value (USD Million) Forecast 2020-2035
  • Figure 3: Global Market Value Share and BPS Analysis by Source, 2025 and 2035
  • Figure 4: Global Market Y-o-Y Growth Comparison by Source, 2025-2035
  • Figure 5: Global Market Attractiveness Analysis by Source
  • Figure 6: Global Market Value Share and BPS Analysis by Function, 2025 and 2035
  • Figure 7: Global Market Y-o-Y Growth Comparison by Function, 2025-2035
  • Figure 8: Global Market Attractiveness Analysis by Function
  • Figure 9: Global Market Value Share and BPS Analysis by Product Type, 2025 and 2035
  • Figure 10: Global Market Y-o-Y Growth Comparison by Product Type, 2025-2035
  • Figure 11: Global Market Attractiveness Analysis by Product Type
  • Figure 12: Global Market Value Share and BPS Analysis by Channel, 2025 and 2035
  • Figure 13: Global Market Y-o-Y Growth Comparison by Channel, 2025-2035
  • Figure 14: Global Market Attractiveness Analysis by Channel
  • Figure 15: Global Market Value Share and BPS Analysis by Claim, 2025 and 2035
  • Figure 16: Global Market Y-o-Y Growth Comparison by Claim, 2025-2035
  • Figure 17: Global Market Attractiveness Analysis by Claim
  • Figure 18: Global Market Value (USD Million) Share and BPS Analysis by Region, 2025 and 2035
  • Figure 19: Global Market Y-o-Y Growth Comparison by Region, 2025-2035
  • Figure 20: Global Market Attractiveness Analysis by Region
  • Figure 21: North America Market Incremental $ Opportunity, 2025-2035
  • Figure 22: Latin America Market Incremental $ Opportunity, 2025-2035
  • Figure 23: Europe Market Incremental $ Opportunity, 2025-2035
  • Figure 24: East Asia Market Incremental $ Opportunity, 2025-2035
  • Figure 25: South Asia & Pacific Market Incremental $ Opportunity, 2025-2035
  • Figure 26: Middle East and Africa Market Incremental $ Opportunity, 2025-2035
  • Figure 27: North America Market Value Share and BPS Analysis by Country, 2025 and 2035
  • Figure 28: North America Market Value Share and BPS Analysis by Source, 2025 and 2035
  • Figure 29: North America Market Y-o-Y Growth Comparison by Source, 2025-2035
  • Figure 30: North America Market Attractiveness Analysis by Source
  • Figure 31: North America Market Value Share and BPS Analysis by Function, 2025 and 2035
  • Figure 32: North America Market Y-o-Y Growth Comparison by Function, 2025-2035
  • Figure 33: North America Market Attractiveness Analysis by Function
  • Figure 34: North America Market Value Share and BPS Analysis by Product Type, 2025 and 2035
  • Figure 35: North America Market Y-o-Y Growth Comparison by Product Type, 2025-2035
  • Figure 36: North America Market Attractiveness Analysis by Product Type
  • Figure 37: North America Market Value Share and BPS Analysis by Channel, 2025 and 2035
  • Figure 38: North America Market Y-o-Y Growth Comparison by Channel, 2025-2035
  • Figure 39: North America Market Attractiveness Analysis by Channel
  • Figure 40: North America Market Value Share and BPS Analysis by Claim, 2025 and 2035
  • Figure 41: North America Market Y-o-Y Growth Comparison by Claim, 2025-2035
  • Figure 42: North America Market Attractiveness Analysis by Claim
  • Figure 43: Latin America Market Value Share and BPS Analysis by Country, 2025 and 2035
  • Figure 44: Latin America Market Value Share and BPS Analysis by Source, 2025 and 2035
  • Figure 45: Latin America Market Y-o-Y Growth Comparison by Source, 2025-2035
  • Figure 46: Latin America Market Attractiveness Analysis by Source
  • Figure 47: Latin America Market Value Share and BPS Analysis by Function, 2025 and 2035
  • Figure 48: Latin America Market Y-o-Y Growth Comparison by Function, 2025-2035
  • Figure 49: Latin America Market Attractiveness Analysis by Function
  • Figure 50: Latin America Market Value Share and BPS Analysis by Product Type, 2025 and 2035
  • Figure 51: Latin America Market Y-o-Y Growth Comparison by Product Type, 2025-2035
  • Figure 52: Latin America Market Attractiveness Analysis by Product Type
  • Figure 53: Latin America Market Value Share and BPS Analysis by Channel, 2025 and 2035
  • Figure 54: Latin America Market Y-o-Y Growth Comparison by Channel, 2025-2035
  • Figure 55: Latin America Market Attractiveness Analysis by Channel
  • Figure 56: Latin America Market Value Share and BPS Analysis by Claim, 2025 and 2035
  • Figure 57: Latin America Market Y-o-Y Growth Comparison by Claim, 2025-2035
  • Figure 58: Latin America Market Attractiveness Analysis by Claim
  • Figure 59: Europe Market Value Share and BPS Analysis by Country, 2025 and 2035
  • Figure 60: Europe Market Value Share and BPS Analysis by Source, 2025 and 2035
  • Figure 61: Europe Market Y-o-Y Growth Comparison by Source, 2025-2035
  • Figure 62: Europe Market Attractiveness Analysis by Source
  • Figure 63: Europe Market Value Share and BPS Analysis by Function, 2025 and 2035
  • Figure 64: Europe Market Y-o-Y Growth Comparison by Function, 2025-2035
  • Figure 65: Europe Market Attractiveness Analysis by Function
  • Figure 66: Europe Market Value Share and BPS Analysis by Product Type, 2025 and 2035
  • Figure 67: Europe Market Y-o-Y Growth Comparison by Product Type, 2025-2035
  • Figure 68: Europe Market Attractiveness Analysis by Product Type
  • Figure 69: Europe Market Value Share and BPS Analysis by Channel, 2025 and 2035
  • Figure 70: Europe Market Y-o-Y Growth Comparison by Channel, 2025-2035
  • Figure 71: Europe Market Attractiveness Analysis by Channel
  • Figure 72: Europe Market Value Share and BPS Analysis by Claim, 2025 and 2035
  • Figure 73: Europe Market Y-o-Y Growth Comparison by Claim, 2025-2035
  • Figure 74: Europe Market Attractiveness Analysis by Claim
  • Figure 75: East Asia Market Value Share and BPS Analysis by Country, 2025 and 2035
  • Figure 76: East Asia Market Value Share and BPS Analysis by Source, 2025 and 2035
  • Figure 77: East Asia Market Y-o-Y Growth Comparison by Source, 2025-2035
  • Figure 78: East Asia Market Attractiveness Analysis by Source
  • Figure 79: East Asia Market Value Share and BPS Analysis by Function, 2025 and 2035
  • Figure 80: East Asia Market Y-o-Y Growth Comparison by Function, 2025-2035
  • Figure 81: East Asia Market Attractiveness Analysis by Function
  • Figure 82: East Asia Market Value Share and BPS Analysis by Product Type, 2025 and 2035
  • Figure 83: East Asia Market Y-o-Y Growth Comparison by Product Type, 2025-2035
  • Figure 84: East Asia Market Attractiveness Analysis by Product Type
  • Figure 85: East Asia Market Value Share and BPS Analysis by Channel, 2025 and 2035
  • Figure 86: East Asia Market Y-o-Y Growth Comparison by Channel, 2025-2035
  • Figure 87: East Asia Market Attractiveness Analysis by Channel
  • Figure 88: East Asia Market Value Share and BPS Analysis by Claim, 2025 and 2035
  • Figure 89: East Asia Market Y-o-Y Growth Comparison by Claim, 2025-2035
  • Figure 90: East Asia Market Attractiveness Analysis by Claim
  • Figure 91: South Asia & Pacific Market Value Share and BPS Analysis by Country, 2025 and 2035
  • Figure 92: South Asia & Pacific Market Value Share and BPS Analysis by Source, 2025 and 2035
  • Figure 93: South Asia & Pacific Market Y-o-Y Growth Comparison by Source, 2025-2035
  • Figure 94: South Asia & Pacific Market Attractiveness Analysis by Source
  • Figure 95: South Asia & Pacific Market Value Share and BPS Analysis by Function, 2025 and 2035
  • Figure 96: South Asia & Pacific Market Y-o-Y Growth Comparison by Function, 2025-2035
  • Figure 97: South Asia & Pacific Market Attractiveness Analysis by Function
  • Figure 98: South Asia & Pacific Market Value Share and BPS Analysis by Product Type, 2025 and 2035
  • Figure 99: South Asia & Pacific Market Y-o-Y Growth Comparison by Product Type, 2025-2035
  • Figure 100: South Asia & Pacific Market Attractiveness Analysis by Product Type
  • Figure 101: South Asia & Pacific Market Value Share and BPS Analysis by Channel, 2025 and 2035
  • Figure 102: South Asia & Pacific Market Y-o-Y Growth Comparison by Channel, 2025-2035
  • Figure 103: South Asia & Pacific Market Attractiveness Analysis by Channel
  • Figure 104: South Asia & Pacific Market Value Share and BPS Analysis by Claim, 2025 and 2035
  • Figure 105: South Asia & Pacific Market Y-o-Y Growth Comparison by Claim, 2025-2035
  • Figure 106: South Asia & Pacific Market Attractiveness Analysis by Claim
  • Figure 107: Middle East and Africa Market Value Share and BPS Analysis by Country, 2025 and 2035
  • Figure 108: Middle East and Africa Market Value Share and BPS Analysis by Source, 2025 and 2035
  • Figure 109: Middle East and Africa Market Y-o-Y Growth Comparison by Source, 2025-2035
  • Figure 110: Middle East and Africa Market Attractiveness Analysis by Source
  • Figure 111: Middle East and Africa Market Value Share and BPS Analysis by Function, 2025 and 2035
  • Figure 112: Middle East and Africa Market Y-o-Y Growth Comparison by Function, 2025-2035
  • Figure 113: Middle East and Africa Market Attractiveness Analysis by Function
  • Figure 114: Middle East and Africa Market Value Share and BPS Analysis by Product Type, 2025 and 2035
  • Figure 115: Middle East and Africa Market Y-o-Y Growth Comparison by Product Type, 2025-2035
  • Figure 116: Middle East and Africa Market Attractiveness Analysis by Product Type
  • Figure 117: Middle East and Africa Market Value Share and BPS Analysis by Channel, 2025 and 2035
  • Figure 118: Middle East and Africa Market Y-o-Y Growth Comparison by Channel, 2025-2035
  • Figure 119: Middle East and Africa Market Attractiveness Analysis by Channel
  • Figure 120: Middle East and Africa Market Value Share and BPS Analysis by Claim, 2025 and 2035
  • Figure 121: Middle East and Africa Market Y-o-Y Growth Comparison by Claim, 2025-2035
  • Figure 122: Middle East and Africa Market Attractiveness Analysis by Claim
  • Figure 123: Global Market - Tier Structure Analysis
  • Figure 124: Global Market - Company Share Analysis

Frequently Asked Questions

How big is the DNA-Modified Plant Extracts Market in 2025?

The global DNA-Modified Plant Extracts Market is estimated to be valued at USD 950.7 million in 2025.

What will be the size of the DNA-Modified Plant Extracts Market in 2035?

The market size for the DNA-Modified Plant Extracts Market is projected to reach USD 3,702.3 million by 2035.

How much will be the DNA-Modified Plant Extracts Market growth between 2025 and 2035?

The DNA-Modified Plant Extracts Market is expected to grow at a CAGR of 14.6% between 2025 and 2035.

What are the key product types in the DNA-Modified Plant Extracts Market?

The key product types in the DNA-Modified Plant Extracts Market are serums and others, with serums accounting for 48.8% share in 2025.

Which functional segment will contribute significant share in the DNA-Modified Plant Extracts Market in 2025?

In terms of function, the repair & regeneration segment is projected to command a 52.5% share of the DNA-Modified Plant Extracts Market in 2025.

Explore Similar Insights

Future Market Insights

DNA-Modified Plant Extracts Market

Chat With

MaRIA

Hi There, I am MaRIA, Your Market Research Intelligence Assistant. How may I help you?