Methodology

Square Pails Market Size and Share Forecast Outlook 2025 to 2035

The Square Pails Market is estimated to be valued at USD 23.8 billion in 2025 and is projected to reach USD 42.7 billion by 2035, registering a compound annual growth rate (CAGR) of 6.0% over the forecast period.
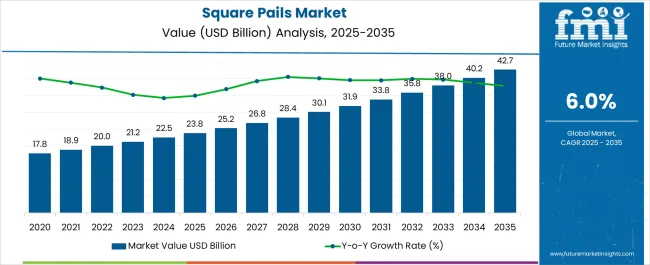
Quick Stats for Square Pails Market

  • Square Pails Market Value (2025): USD 23.8 billion
  • Square Pails Market Forecast Value (2035): USD 42.7 billion
  • Square Pails Market Forecast CAGR: 6.0%
  • Leading Segment in Square Pails Market in 2025: High Density Polyethylene (HDPE) Plastic (32.6%)
  • Key Growth Regions in Square Pails Market: North America, Asia-Pacific, Europe
  • Top Key Players in Square Pails Market: M&M Industries Inc., IPL Plastics, Inc., Jokey Plastik Wipperfürth GmbH., Pro-Western Plastics Ltd., Affordable Plastics LLC, Northern Container, Berry Global Inc., Involvement Packaging Ltd., Plast Service Pack Company, Corcoran Products, Viscount Plastics Ltd., United States Plastic Corp.

Square Pails Market Market Value Analysis

Square Pails Market Key Takeaways

Metric Value
Square Pails Market Estimated Value in (2025 E) USD 23.8 billion
Square Pails Market Forecast Value in (2035 F) USD 42.7 billion
Forecast CAGR (2025 to 2035) 6.0%

Why is the Square Pails Market Growing?

The Square Pails Market is experiencing notable growth as industries increasingly adopt efficient and durable packaging solutions tailored to diverse operational requirements. Rising demand is being supported by the growing need for storage and transportation of chemicals, food products, paints, lubricants, and other industrial goods. Square pails are favored over traditional cylindrical containers due to their space efficiency, stackability, and cost advantages in logistics.

With growing emphasis on safety and compliance, manufacturers are integrating advanced materials, leak-proof sealing technologies, and tamper-evident features to ensure product integrity during storage and transport. The increasing preference for reusable and recyclable packaging aligns with sustainability initiatives, further strengthening market adoption. Additionally, advancements in molding technology are enabling production of lightweight yet durable pails, improving cost efficiency and usability.

As industries expand their operations and global trade intensifies, the demand for square pails with specialized features such as chemical resistance and food-grade certification is projected to rise This market is positioned for steady long-term expansion driven by innovation and evolving customer needs.

Segmental Analysis

The square pails market is segmented by material type, capacity, end use, and geographic regions. By material type, square pails market is divided into High Density Polyethylene (HDPE) Plastic, Plastic, Galvanized Metals, Steel, Aluminium, and Iron. In terms of capacity, square pails market is classified into 10 To 25 Litres, 3 To 5 Litres, 5 To 10 Litres, and 25 Litres & More. Based on end use, square pails market is segmented into Chemical Industries (Hazardous), Non-Hazardous Chemicals, Packaging Of The Paints, Home Care, Pharmaceutical Industries, and Petrochemical Industries. Regionally, the square pails industry is classified into North America, Latin America, Western Europe, Eastern Europe, Balkan & Baltic Countries, Russia & Belarus, Central Asia, East Asia, South Asia & Pacific, and the Middle East & Africa.
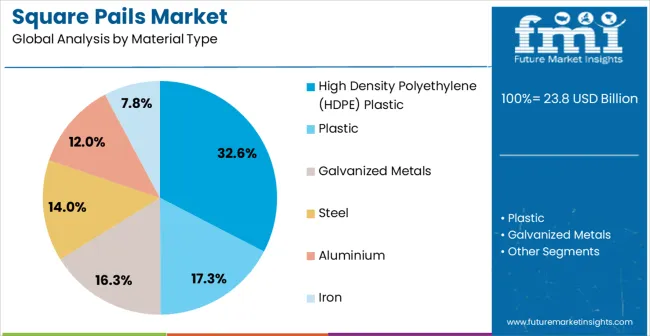
Insights into the High Density Polyethylene Plastic Material Segment

Square Pails Market Analysis By Material Type

The high density polyethylene plastic segment is expected to hold 32.6% of the Square Pails Market revenue in 2025, positioning it as the leading material type. This dominance is being driven by the superior durability, chemical resistance, and cost-effectiveness offered by HDPE plastic. The material’s lightweight structure ensures ease of handling while maintaining the strength required for transporting hazardous and non hazardous products.

Its compatibility with modern molding technologies allows manufacturers to create pails with consistent quality and innovative designs that meet diverse industry needs. Recyclability of HDPE plastic also aligns with sustainability goals, reinforcing its adoption across industries focused on reducing environmental footprints.

Additionally, HDPE pails are widely used in industries that require resistance to moisture, chemicals, and temperature fluctuations, making them suitable for applications ranging from chemicals and paints to food storage With regulations emphasizing packaging safety and the growing demand for durable yet eco friendly solutions, the HDPE plastic segment is projected to sustain its leading position in the market.
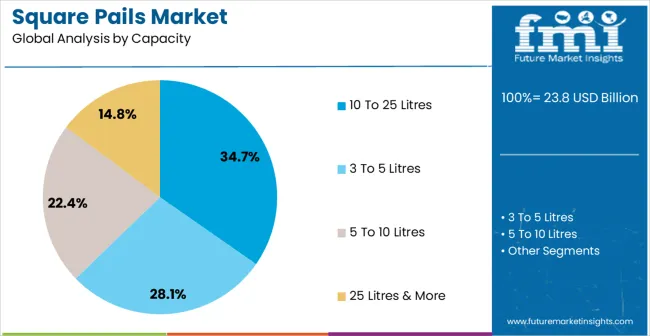
Insights into the 10 to 25 Litres Capacity Segment

Square Pails Market Analysis By Capacity

The 10 to 25 litres capacity segment is projected to account for 34.7% of the market revenue in 2025, making it the leading capacity range. This segment’s leadership is attributed to its versatility in serving diverse industrial and commercial applications. Pails within this capacity range are particularly suited for transporting and storing medium volumes of chemicals, paints, lubricants, and food items, where both manageability and volume efficiency are critical.

The size strikes a balance between portability and storage capacity, ensuring convenience in handling while reducing logistical costs for bulk distribution. These pails are widely adopted in chemical industries, food processing, and construction, as they meet regulatory and operational requirements effectively.

Their ability to integrate safety features such as tamper proof seals and secure lids further enhances their market acceptance With increasing demand for packaging that combines flexibility, durability, and cost efficiency, the 10 to 25 litres capacity segment is expected to remain dominant, supported by broad industrial applicability and consistent consumer preference.
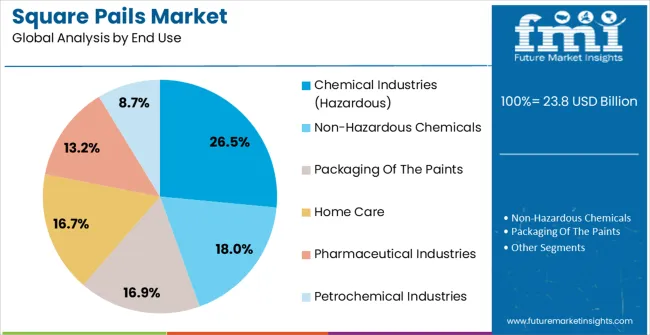
Insights into the Chemical Industries End Use Segment

Square Pails Market Analysis By End Use

The chemical industries segment is anticipated to hold 26.5% of the Square Pails Market revenue in 2025, emerging as the leading end use category. This prominence is largely driven by the sector’s stringent requirements for safe and reliable packaging solutions that can withstand exposure to hazardous substances. Square pails are extensively used for packaging chemicals such as solvents, adhesives, lubricants, and other hazardous materials where resistance to leakage, corrosion, and contamination is critical.

The robust structural design of square pails ensures durability and stability during handling, storage, and transport. Additionally, regulatory compliance regarding hazardous material packaging has strengthened the reliance on high quality pails within this sector. Manufacturers are increasingly offering specialized pails with enhanced safety features, such as child resistant closures and reinforced seals, catering to chemical industry standards.

The rising global trade in chemicals and the ongoing expansion of industrial production are expected to further boost demand As safety and sustainability become central to chemical supply chains, the industry’s dependence on square pails will remain strong.

Market Overview

Square Pails Market

The square pails market is expected to grow at a CAGR of 6% during the period 2025 to 2035. The market is valued at US$ 20 billion as of 2025, and by 2035, the market is anticipated to be valued at US$ 35.82 billion.

Attributes Value
Square Pails Market Valuation (2025) US$ 20 billion
Square Pails Market Projected Size (2035) US$ 35.82 billion
Square Pails Market Expected CAGR (2025 to 2035) 6%

The key players are making lots of innovations at a product level in order to ensure that the customers are able to easily handle the product. Some of the pails are being manufactured with built-in hand grips so that, even if the handle is broken, these pails can be easily carried.

Apart from that, even the tear tab lids are sold separately. This is provided to hold the contents safely. Of late, the square pails are being manufactured using Polyethylene owing to its robust characteristics.

One of the most important developments is the fact that the square pails are manufactured in a variety of sizes to cater to different customer needs. Thus, the square pails are being manufactured for all applications ranging from personal usage to commercial applications.

In order to maintain the Genuity of the product, the manufacturers are laying a lot of emphasis on the seal. In order to protect the seal, the placement is made in such a manner that the containers can open and close several times without altering the seal.

Moreover, even the design is being made in such a manner that the contamination risk is reduced to a great deal, and the box is kept clean for the next usage as well. Thus, the amalgamation of design and tamper-evident seal ensures that the customer purchases the product without questioning its quality.

Additionally, a unique integrity integrator is located on all four corners of the lid, thereby laying a huge emphasis on ergonomics.

The manufacturers ensure that the product is designed in such a manner that the manufacturing cost is reduced.

Furthermore, the key players are specifically targeting the chemical sector and the packaging sector. The manufacturers are seen collaborating with giants from the chemical industry so that they could serve the niche by providing solutions to carry highly corrosive agents.

If we further talk about the design aspect, the manufacturers are ensuring that the square pails are manufactured with spouts on both sides. This will make it easier to dispense the contents from both sides.
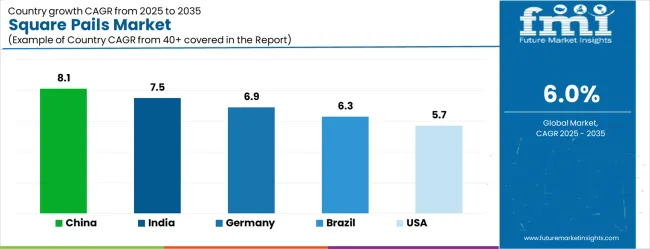
Analysis of Square Pails Market By Key Countries

Square Pails Market Cagr Analysis By Country

Country CAGR
China 8.1%
India 7.5%
Germany 6.9%
Brazil 6.3%
USA 5.7%
UK 5.1%
Japan 4.5%

Country-wise Analysis

The Square Pails Market is expected to register a CAGR of 6.0% during the forecast period, exhibiting varied country level momentum. China leads with the highest CAGR of 8.1%, followed by India at 7.5%. Developed markets such as Germany, France, and the UK continue to expand steadily, while the USA is likely to grow at consistent rates. Japan posts the lowest CAGR at 4.5%, yet still underscores a broadly positive trajectory for the global Square Pails Market. In 2024, Germany held a dominant revenue in the Western Europe market and is expected to grow with a CAGR of 6.9%. The USA Square Pails Market is estimated to be valued at USD 8.6 billion in 2025 and is anticipated to reach a valuation of USD 8.6 billion by 2035. Sales are projected to rise at a CAGR of 0.0% over the forecast period between 2025 and 2035. While Japan and South Korea markets are estimated to be valued at USD 1.3 billion and USD 774.4 million respectively in 2025.
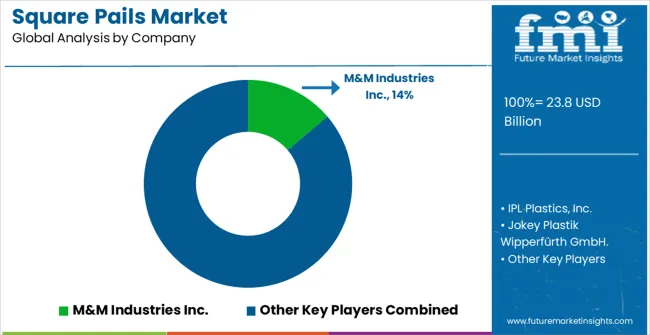
Key Players in the Square Pails Market

Square Pails Market Analysis By Company

  • M&M Industries Inc.
  • IPL Plastics, Inc.
  • Jokey Plastik Wipperfürth GmbH.
  • Pro-Western Plastics Ltd.
  • Affordable Plastics LLC
  • Northern Container
  • Berry Global Inc.
  • Involvement Packaging Ltd.
  • Plast Service Pack Company
  • Corcoran Products
  • Viscount Plastics Ltd.
  • United States Plastic Corp.

Scope of the Report

Item Value
Quantitative Units USD 23.8 Billion
Material Type High Density Polyethylene (HDPE) Plastic, Plastic, Galvanized Metals, Steel, Aluminium, and Iron
Capacity 10 To 25 Litres, 3 To 5 Litres, 5 To 10 Litres, and 25 Litres & More
End Use Chemical Industries (Hazardous), Non-Hazardous Chemicals, Packaging Of The Paints, Home Care, Pharmaceutical Industries, and Petrochemical Industries
Regions Covered North America, Europe, Asia-Pacific, Latin America, Middle East & Africa
Country Covered United States, Canada, Germany, France, United Kingdom, China, Japan, India, Brazil, South Africa
Key Companies Profiled M&M Industries Inc., IPL Plastics, Inc., Jokey Plastik Wipperfürth GmbH., Pro-Western Plastics Ltd., Affordable Plastics LLC, Northern Container, Berry Global Inc., Involvement Packaging Ltd., Plast Service Pack Company, Corcoran Products, Viscount Plastics Ltd., and United States Plastic Corp.

Square Pails Market by Segments

Material Type:

  • High Density Polyethylene (HDPE) Plastic
  • Plastic
  • Galvanized Metals
  • Steel
  • Aluminium
  • Iron

Capacity:

  • 10 To 25 Litres
  • 3 To 5 Litres
  • 5 To 10 Litres
  • 25 Litres & More

End Use:

  • Chemical Industries (Hazardous)
  • Non-Hazardous Chemicals
  • Packaging Of The Paints
  • Home Care
  • Pharmaceutical Industries
  • Petrochemical Industries

Region:

  • North America
    • USA
    • Canada
    • Mexico
  • Latin America
    • Brazil
    • Chile
    • Rest of Latin America
  • Western Europe
    • Germany
    • UK
    • Italy
    • Spain
    • France
    • Nordic
    • BENELUX
    • Rest of Western Europe
  • Eastern Europe
    • Russia
    • Poland
    • Hungary
    • Balkan & Baltic
    • Rest of Eastern Europe
  • East Asia
    • China
    • Japan
    • South Korea
  • South Asia and Pacific
    • India
    • ASEAN
    • Australia & New Zealand
    • Rest of South Asia and Pacific
  • Middle East & Africa
    • Kingdom of Saudi Arabia
    • Other GCC Countries
    • Turkiye
    • South Africa
    • Other African Union
    • Rest of Middle East & Africa

Frequently Asked Questions

How big is the square pails market in 2025?

The global square pails market is estimated to be valued at USD 23.8 billion in 2025.

What will be the size of square pails market in 2035?

The market size for the square pails market is projected to reach USD 42.7 billion by 2035.

How much will be the square pails market growth between 2025 and 2035?

The square pails market is expected to grow at a 6.0% CAGR between 2025 and 2035.

What are the key product types in the square pails market?

The key product types in square pails market are high density polyethylene (hdpe) plastic, plastic, galvanized metals, steel, aluminium and iron.

Which capacity segment to contribute significant share in the square pails market in 2025?

In terms of capacity, 10 to 25 litres segment to command 34.7% share in the square pails market in 2025.

Table of Content

  • Executive Summary
    • Global Market Outlook
    • Demand-side Trends
    • Supply-side Trends
    • Technology Roadmap Analysis
    • Analysis and Recommendations
  1. Market Overview
    • Market Coverage / Taxonomy
    • Market Definition / Scope / Limitations
  2. Market Background
    • Market Dynamics
      • Drivers
      • Restraints
      • Opportunity
      • Trends
    • Scenario Forecast
      • Demand in Optimistic Scenario
      • Demand in Likely Scenario
      • Demand in Conservative Scenario
    • Opportunity Map Analysis
    • Product Life Cycle Analysis
    • Supply Chain Analysis
    • Investment Feasibility Matrix
    • Value Chain Analysis
    • PESTLE and Porter’s Analysis
    • Regulatory Landscape
    • Regional Parent Market Outlook
    • Production and Consumption Statistics
    • Import and Export Statistics
  3. Global Market Analysis 2020 to 2024 and Forecast, 2025 to 2035
    • Historical Market Size Value (USD Million) Analysis, 2020 to 2024
    • Current and Future Market Size Value (USD Million) Projections, 2025 to 2035
      • Y-o-Y Growth Trend Analysis
      • Absolute $ Opportunity Analysis
  4. Global Market Pricing Analysis 2020 to 2024 and Forecast 2025 to 2035
  5. Global Market Analysis 2020 to 2024 and Forecast 2025 to 2035, By Material Type
    • Introduction / Key Findings
    • Historical Market Size Value (USD Million) Analysis By Material Type , 2020 to 2024
    • Current and Future Market Size Value (USD Million) Analysis and Forecast By Material Type , 2025 to 2035
      • High Density Polyethylene (HDPE) Plastic
      • Plastic
      • Galvanized Metals
      • Steel
      • Aluminium
      • Iron
    • Y-o-Y Growth Trend Analysis By Material Type , 2020 to 2024
    • Absolute $ Opportunity Analysis By Material Type , 2025 to 2035
  6. Global Market Analysis 2020 to 2024 and Forecast 2025 to 2035, By Capacity
    • Introduction / Key Findings
    • Historical Market Size Value (USD Million) Analysis By Capacity, 2020 to 2024
    • Current and Future Market Size Value (USD Million) Analysis and Forecast By Capacity, 2025 to 2035
      • 10 To 25 Litres
      • 3 To 5 Litres
      • 5 To 10 Litres
      • 25 Litres & More
    • Y-o-Y Growth Trend Analysis By Capacity, 2020 to 2024
    • Absolute $ Opportunity Analysis By Capacity, 2025 to 2035
  7. Global Market Analysis 2020 to 2024 and Forecast 2025 to 2035, By End Use
    • Introduction / Key Findings
    • Historical Market Size Value (USD Million) Analysis By End Use, 2020 to 2024
    • Current and Future Market Size Value (USD Million) Analysis and Forecast By End Use, 2025 to 2035
      • Chemical Industries (Hazardous)
      • Non-Hazardous Chemicals
      • Packaging Of The Paints
      • Home Care
      • Pharmaceutical Industries
      • Petrochemical Industries
    • Y-o-Y Growth Trend Analysis By End Use, 2020 to 2024
    • Absolute $ Opportunity Analysis By End Use, 2025 to 2035
  8. Global Market Analysis 2020 to 2024 and Forecast 2025 to 2035, By Region
    • Introduction
    • Historical Market Size Value (USD Million) Analysis By Region, 2020 to 2024
    • Current Market Size Value (USD Million) Analysis and Forecast By Region, 2025 to 2035
      • North America
      • Latin America
      • Western Europe
      • Eastern Europe
      • East Asia
      • South Asia and Pacific
      • Middle East & Africa
    • Market Attractiveness Analysis By Region
  9. North America Market Analysis 2020 to 2024 and Forecast 2025 to 2035, By Country
    • Historical Market Size Value (USD Million) Trend Analysis By Market Taxonomy, 2020 to 2024
    • Market Size Value (USD Million) Forecast By Market Taxonomy, 2025 to 2035
      • By Country
        • USA
        • Canada
        • Mexico
      • By Material Type
      • By Capacity
      • By End Use
    • Market Attractiveness Analysis
      • By Country
      • By Material Type
      • By Capacity
      • By End Use
    • Key Takeaways
  10. Latin America Market Analysis 2020 to 2024 and Forecast 2025 to 2035, By Country
    • Historical Market Size Value (USD Million) Trend Analysis By Market Taxonomy, 2020 to 2024
    • Market Size Value (USD Million) Forecast By Market Taxonomy, 2025 to 2035
      • By Country
        • Brazil
        • Chile
        • Rest of Latin America
      • By Material Type
      • By Capacity
      • By End Use
    • Market Attractiveness Analysis
      • By Country
      • By Material Type
      • By Capacity
      • By End Use
    • Key Takeaways
  11. Western Europe Market Analysis 2020 to 2024 and Forecast 2025 to 2035, By Country
    • Historical Market Size Value (USD Million) Trend Analysis By Market Taxonomy, 2020 to 2024
    • Market Size Value (USD Million) Forecast By Market Taxonomy, 2025 to 2035
      • By Country
        • Germany
        • UK
        • Italy
        • Spain
        • France
        • Nordic
        • BENELUX
        • Rest of Western Europe
      • By Material Type
      • By Capacity
      • By End Use
    • Market Attractiveness Analysis
      • By Country
      • By Material Type
      • By Capacity
      • By End Use
    • Key Takeaways
  12. Eastern Europe Market Analysis 2020 to 2024 and Forecast 2025 to 2035, By Country
    • Historical Market Size Value (USD Million) Trend Analysis By Market Taxonomy, 2020 to 2024
    • Market Size Value (USD Million) Forecast By Market Taxonomy, 2025 to 2035
      • By Country
        • Russia
        • Poland
        • Hungary
        • Balkan & Baltic
        • Rest of Eastern Europe
      • By Material Type
      • By Capacity
      • By End Use
    • Market Attractiveness Analysis
      • By Country
      • By Material Type
      • By Capacity
      • By End Use
    • Key Takeaways
  13. East Asia Market Analysis 2020 to 2024 and Forecast 2025 to 2035, By Country
    • Historical Market Size Value (USD Million) Trend Analysis By Market Taxonomy, 2020 to 2024
    • Market Size Value (USD Million) Forecast By Market Taxonomy, 2025 to 2035
      • By Country
        • China
        • Japan
        • South Korea
      • By Material Type
      • By Capacity
      • By End Use
    • Market Attractiveness Analysis
      • By Country
      • By Material Type
      • By Capacity
      • By End Use
    • Key Takeaways
  14. South Asia and Pacific Market Analysis 2020 to 2024 and Forecast 2025 to 2035, By Country
    • Historical Market Size Value (USD Million) Trend Analysis By Market Taxonomy, 2020 to 2024
    • Market Size Value (USD Million) Forecast By Market Taxonomy, 2025 to 2035
      • By Country
        • India
        • ASEAN
        • Australia & New Zealand
        • Rest of South Asia and Pacific
      • By Material Type
      • By Capacity
      • By End Use
    • Market Attractiveness Analysis
      • By Country
      • By Material Type
      • By Capacity
      • By End Use
    • Key Takeaways
  15. Middle East & Africa Market Analysis 2020 to 2024 and Forecast 2025 to 2035, By Country
    • Historical Market Size Value (USD Million) Trend Analysis By Market Taxonomy, 2020 to 2024
    • Market Size Value (USD Million) Forecast By Market Taxonomy, 2025 to 2035
      • By Country
        • Kingdom of Saudi Arabia
        • Other GCC Countries
        • Turkiye
        • South Africa
        • Other African Union
        • Rest of Middle East & Africa
      • By Material Type
      • By Capacity
      • By End Use
    • Market Attractiveness Analysis
      • By Country
      • By Material Type
      • By Capacity
      • By End Use
    • Key Takeaways
  16. Key Countries Market Analysis
    • USA
      • Pricing Analysis
      • Market Share Analysis, 2024
        • By Material Type
        • By Capacity
        • By End Use
    • Canada
      • Pricing Analysis
      • Market Share Analysis, 2024
        • By Material Type
        • By Capacity
        • By End Use
    • Mexico
      • Pricing Analysis
      • Market Share Analysis, 2024
        • By Material Type
        • By Capacity
        • By End Use
    • Brazil
      • Pricing Analysis
      • Market Share Analysis, 2024
        • By Material Type
        • By Capacity
        • By End Use
    • Chile
      • Pricing Analysis
      • Market Share Analysis, 2024
        • By Material Type
        • By Capacity
        • By End Use
    • Germany
      • Pricing Analysis
      • Market Share Analysis, 2024
        • By Material Type
        • By Capacity
        • By End Use
    • UK
      • Pricing Analysis
      • Market Share Analysis, 2024
        • By Material Type
        • By Capacity
        • By End Use
    • Italy
      • Pricing Analysis
      • Market Share Analysis, 2024
        • By Material Type
        • By Capacity
        • By End Use
    • Spain
      • Pricing Analysis
      • Market Share Analysis, 2024
        • By Material Type
        • By Capacity
        • By End Use
    • France
      • Pricing Analysis
      • Market Share Analysis, 2024
        • By Material Type
        • By Capacity
        • By End Use
    • India
      • Pricing Analysis
      • Market Share Analysis, 2024
        • By Material Type
        • By Capacity
        • By End Use
    • ASEAN
      • Pricing Analysis
      • Market Share Analysis, 2024
        • By Material Type
        • By Capacity
        • By End Use
    • Australia & New Zealand
      • Pricing Analysis
      • Market Share Analysis, 2024
        • By Material Type
        • By Capacity
        • By End Use
    • China
      • Pricing Analysis
      • Market Share Analysis, 2024
        • By Material Type
        • By Capacity
        • By End Use
    • Japan
      • Pricing Analysis
      • Market Share Analysis, 2024
        • By Material Type
        • By Capacity
        • By End Use
    • South Korea
      • Pricing Analysis
      • Market Share Analysis, 2024
        • By Material Type
        • By Capacity
        • By End Use
    • Russia
      • Pricing Analysis
      • Market Share Analysis, 2024
        • By Material Type
        • By Capacity
        • By End Use
    • Poland
      • Pricing Analysis
      • Market Share Analysis, 2024
        • By Material Type
        • By Capacity
        • By End Use
    • Hungary
      • Pricing Analysis
      • Market Share Analysis, 2024
        • By Material Type
        • By Capacity
        • By End Use
    • Kingdom of Saudi Arabia
      • Pricing Analysis
      • Market Share Analysis, 2024
        • By Material Type
        • By Capacity
        • By End Use
    • Turkiye
      • Pricing Analysis
      • Market Share Analysis, 2024
        • By Material Type
        • By Capacity
        • By End Use
    • South Africa
      • Pricing Analysis
      • Market Share Analysis, 2024
        • By Material Type
        • By Capacity
        • By End Use
  17. Market Structure Analysis
    • Competition Dashboard
    • Competition Benchmarking
    • Market Share Analysis of Top Players
      • By Regional
      • By Material Type
      • By Capacity
      • By End Use
  18. Competition Analysis
    • Competition Deep Dive
      • M&M Industries Inc.
        • Overview
        • Product Portfolio
        • Profitability by Market Segments (Product/Age /Sales Channel/Region)
        • Sales Footprint
        • Strategy Overview
          • Marketing Strategy
          • Product Strategy
          • Channel Strategy
      • IPL Plastics, Inc.
      • Jokey Plastik Wipperfürth GmbH.
      • Pro-Western Plastics Ltd.
      • Affordable Plastics LLC
      • Northern Container
      • Berry Global Inc.
      • Involvement Packaging Ltd.
      • Plast Service Pack Company
      • Corcoran Products
      • Viscount Plastics Ltd.
      • Value (USD Million)ed States Plastic Corp.
  19. Assumptions & Acronyms Used
  20. Research Methodology

List of Tables

  • Table 1: Global Market Value (USD Million) Forecast by Region, 2020 to 2035
  • Table 2: Global Market Value (USD Million) Forecast by Material Type , 2020 to 2035
  • Table 3: Global Market Value (USD Million) Forecast by Capacity, 2020 to 2035
  • Table 4: Global Market Value (USD Million) Forecast by End Use, 2020 to 2035
  • Table 5: North America Market Value (USD Million) Forecast by Country, 2020 to 2035
  • Table 6: North America Market Value (USD Million) Forecast by Material Type , 2020 to 2035
  • Table 7: North America Market Value (USD Million) Forecast by Capacity, 2020 to 2035
  • Table 8: North America Market Value (USD Million) Forecast by End Use, 2020 to 2035
  • Table 9: Latin America Market Value (USD Million) Forecast by Country, 2020 to 2035
  • Table 10: Latin America Market Value (USD Million) Forecast by Material Type , 2020 to 2035
  • Table 11: Latin America Market Value (USD Million) Forecast by Capacity, 2020 to 2035
  • Table 12: Latin America Market Value (USD Million) Forecast by End Use, 2020 to 2035
  • Table 13: Western Europe Market Value (USD Million) Forecast by Country, 2020 to 2035
  • Table 14: Western Europe Market Value (USD Million) Forecast by Material Type , 2020 to 2035
  • Table 15: Western Europe Market Value (USD Million) Forecast by Capacity, 2020 to 2035
  • Table 16: Western Europe Market Value (USD Million) Forecast by End Use, 2020 to 2035
  • Table 17: Eastern Europe Market Value (USD Million) Forecast by Country, 2020 to 2035
  • Table 18: Eastern Europe Market Value (USD Million) Forecast by Material Type , 2020 to 2035
  • Table 19: Eastern Europe Market Value (USD Million) Forecast by Capacity, 2020 to 2035
  • Table 20: Eastern Europe Market Value (USD Million) Forecast by End Use, 2020 to 2035
  • Table 21: East Asia Market Value (USD Million) Forecast by Country, 2020 to 2035
  • Table 22: East Asia Market Value (USD Million) Forecast by Material Type , 2020 to 2035
  • Table 23: East Asia Market Value (USD Million) Forecast by Capacity, 2020 to 2035
  • Table 24: East Asia Market Value (USD Million) Forecast by End Use, 2020 to 2035
  • Table 25: South Asia and Pacific Market Value (USD Million) Forecast by Country, 2020 to 2035
  • Table 26: South Asia and Pacific Market Value (USD Million) Forecast by Material Type , 2020 to 2035
  • Table 27: South Asia and Pacific Market Value (USD Million) Forecast by Capacity, 2020 to 2035
  • Table 28: South Asia and Pacific Market Value (USD Million) Forecast by End Use, 2020 to 2035
  • Table 29: Middle East & Africa Market Value (USD Million) Forecast by Country, 2020 to 2035
  • Table 30: Middle East & Africa Market Value (USD Million) Forecast by Material Type , 2020 to 2035
  • Table 31: Middle East & Africa Market Value (USD Million) Forecast by Capacity, 2020 to 2035
  • Table 32: Middle East & Africa Market Value (USD Million) Forecast by End Use, 2020 to 2035

List of Figures

  • Figure 1: Global Market Pricing Analysis
  • Figure 2: Global Market Value (USD Million) Forecast 2020-2035
  • Figure 3: Global Market Value Share and BPS Analysis by Material Type , 2025 and 2035
  • Figure 4: Global Market Y-o-Y Growth Comparison by Material Type , 2025-2035
  • Figure 5: Global Market Attractiveness Analysis by Material Type
  • Figure 6: Global Market Value Share and BPS Analysis by Capacity, 2025 and 2035
  • Figure 7: Global Market Y-o-Y Growth Comparison by Capacity, 2025-2035
  • Figure 8: Global Market Attractiveness Analysis by Capacity
  • Figure 9: Global Market Value Share and BPS Analysis by End Use, 2025 and 2035
  • Figure 10: Global Market Y-o-Y Growth Comparison by End Use, 2025-2035
  • Figure 11: Global Market Attractiveness Analysis by End Use
  • Figure 12: Global Market Value (USD Million) Share and BPS Analysis by Region, 2025 and 2035
  • Figure 13: Global Market Y-o-Y Growth Comparison by Region, 2025-2035
  • Figure 14: Global Market Attractiveness Analysis by Region
  • Figure 15: North America Market Incremental Dollar Opportunity, 2025-2035
  • Figure 16: Latin America Market Incremental Dollar Opportunity, 2025-2035
  • Figure 17: Western Europe Market Incremental Dollar Opportunity, 2025-2035
  • Figure 18: Eastern Europe Market Incremental Dollar Opportunity, 2025-2035
  • Figure 19: East Asia Market Incremental Dollar Opportunity, 2025-2035
  • Figure 20: South Asia and Pacific Market Incremental Dollar Opportunity, 2025-2035
  • Figure 21: Middle East & Africa Market Incremental Dollar Opportunity, 2025-2035
  • Figure 22: North America Market Value Share and BPS Analysis by Country, 2025 and 2035
  • Figure 23: North America Market Value Share and BPS Analysis by Material Type , 2025 and 2035
  • Figure 24: North America Market Y-o-Y Growth Comparison by Material Type , 2025-2035
  • Figure 25: North America Market Attractiveness Analysis by Material Type
  • Figure 26: North America Market Value Share and BPS Analysis by Capacity, 2025 and 2035
  • Figure 27: North America Market Y-o-Y Growth Comparison by Capacity, 2025-2035
  • Figure 28: North America Market Attractiveness Analysis by Capacity
  • Figure 29: North America Market Value Share and BPS Analysis by End Use, 2025 and 2035
  • Figure 30: North America Market Y-o-Y Growth Comparison by End Use, 2025-2035
  • Figure 31: North America Market Attractiveness Analysis by End Use
  • Figure 32: Latin America Market Value Share and BPS Analysis by Country, 2025 and 2035
  • Figure 33: Latin America Market Value Share and BPS Analysis by Material Type , 2025 and 2035
  • Figure 34: Latin America Market Y-o-Y Growth Comparison by Material Type , 2025-2035
  • Figure 35: Latin America Market Attractiveness Analysis by Material Type
  • Figure 36: Latin America Market Value Share and BPS Analysis by Capacity, 2025 and 2035
  • Figure 37: Latin America Market Y-o-Y Growth Comparison by Capacity, 2025-2035
  • Figure 38: Latin America Market Attractiveness Analysis by Capacity
  • Figure 39: Latin America Market Value Share and BPS Analysis by End Use, 2025 and 2035
  • Figure 40: Latin America Market Y-o-Y Growth Comparison by End Use, 2025-2035
  • Figure 41: Latin America Market Attractiveness Analysis by End Use
  • Figure 42: Western Europe Market Value Share and BPS Analysis by Country, 2025 and 2035
  • Figure 43: Western Europe Market Value Share and BPS Analysis by Material Type , 2025 and 2035
  • Figure 44: Western Europe Market Y-o-Y Growth Comparison by Material Type , 2025-2035
  • Figure 45: Western Europe Market Attractiveness Analysis by Material Type
  • Figure 46: Western Europe Market Value Share and BPS Analysis by Capacity, 2025 and 2035
  • Figure 47: Western Europe Market Y-o-Y Growth Comparison by Capacity, 2025-2035
  • Figure 48: Western Europe Market Attractiveness Analysis by Capacity
  • Figure 49: Western Europe Market Value Share and BPS Analysis by End Use, 2025 and 2035
  • Figure 50: Western Europe Market Y-o-Y Growth Comparison by End Use, 2025-2035
  • Figure 51: Western Europe Market Attractiveness Analysis by End Use
  • Figure 52: Eastern Europe Market Value Share and BPS Analysis by Country, 2025 and 2035
  • Figure 53: Eastern Europe Market Value Share and BPS Analysis by Material Type , 2025 and 2035
  • Figure 54: Eastern Europe Market Y-o-Y Growth Comparison by Material Type , 2025-2035
  • Figure 55: Eastern Europe Market Attractiveness Analysis by Material Type
  • Figure 56: Eastern Europe Market Value Share and BPS Analysis by Capacity, 2025 and 2035
  • Figure 57: Eastern Europe Market Y-o-Y Growth Comparison by Capacity, 2025-2035
  • Figure 58: Eastern Europe Market Attractiveness Analysis by Capacity
  • Figure 59: Eastern Europe Market Value Share and BPS Analysis by End Use, 2025 and 2035
  • Figure 60: Eastern Europe Market Y-o-Y Growth Comparison by End Use, 2025-2035
  • Figure 61: Eastern Europe Market Attractiveness Analysis by End Use
  • Figure 62: East Asia Market Value Share and BPS Analysis by Country, 2025 and 2035
  • Figure 63: East Asia Market Value Share and BPS Analysis by Material Type , 2025 and 2035
  • Figure 64: East Asia Market Y-o-Y Growth Comparison by Material Type , 2025-2035
  • Figure 65: East Asia Market Attractiveness Analysis by Material Type
  • Figure 66: East Asia Market Value Share and BPS Analysis by Capacity, 2025 and 2035
  • Figure 67: East Asia Market Y-o-Y Growth Comparison by Capacity, 2025-2035
  • Figure 68: East Asia Market Attractiveness Analysis by Capacity
  • Figure 69: East Asia Market Value Share and BPS Analysis by End Use, 2025 and 2035
  • Figure 70: East Asia Market Y-o-Y Growth Comparison by End Use, 2025-2035
  • Figure 71: East Asia Market Attractiveness Analysis by End Use
  • Figure 72: South Asia and Pacific Market Value Share and BPS Analysis by Country, 2025 and 2035
  • Figure 73: South Asia and Pacific Market Value Share and BPS Analysis by Material Type , 2025 and 2035
  • Figure 74: South Asia and Pacific Market Y-o-Y Growth Comparison by Material Type , 2025-2035
  • Figure 75: South Asia and Pacific Market Attractiveness Analysis by Material Type
  • Figure 76: South Asia and Pacific Market Value Share and BPS Analysis by Capacity, 2025 and 2035
  • Figure 77: South Asia and Pacific Market Y-o-Y Growth Comparison by Capacity, 2025-2035
  • Figure 78: South Asia and Pacific Market Attractiveness Analysis by Capacity
  • Figure 79: South Asia and Pacific Market Value Share and BPS Analysis by End Use, 2025 and 2035
  • Figure 80: South Asia and Pacific Market Y-o-Y Growth Comparison by End Use, 2025-2035
  • Figure 81: South Asia and Pacific Market Attractiveness Analysis by End Use
  • Figure 82: Middle East & Africa Market Value Share and BPS Analysis by Country, 2025 and 2035
  • Figure 83: Middle East & Africa Market Value Share and BPS Analysis by Material Type , 2025 and 2035
  • Figure 84: Middle East & Africa Market Y-o-Y Growth Comparison by Material Type , 2025-2035
  • Figure 85: Middle East & Africa Market Attractiveness Analysis by Material Type
  • Figure 86: Middle East & Africa Market Value Share and BPS Analysis by Capacity, 2025 and 2035
  • Figure 87: Middle East & Africa Market Y-o-Y Growth Comparison by Capacity, 2025-2035
  • Figure 88: Middle East & Africa Market Attractiveness Analysis by Capacity
  • Figure 89: Middle East & Africa Market Value Share and BPS Analysis by End Use, 2025 and 2035
  • Figure 90: Middle East & Africa Market Y-o-Y Growth Comparison by End Use, 2025-2035
  • Figure 91: Middle East & Africa Market Attractiveness Analysis by End Use
  • Figure 92: Global Market - Tier Structure Analysis
  • Figure 93: Global Market - Company Share Analysis
Dashboard
Dashboard
Dashboard
Dashboard
Dashboard
Dashboard

Our Research Products

Full Research Suite

The "Full Research Suite" delivers actionable market intel, deep dives on markets or technologies, so clients act faster, cut risk, and unlock growth.

Competitor Leaderboard Report

The Leaderboard benchmarks and ranks top vendors, classifying them as Established Leaders, Leading Challengers, or Disruptors & Challengers.

Future Leaders Index

Locates where complements amplify value and substitutes erode it, forecasting net impact by horizon

Market Data & Forecasts

We deliver granular, decision-grade intel: market sizing, 5-year forecasts, pricing, adoption, usage, revenue, and operational KPIs—plus competitor tracking, regulation, and value chains—across 60 countries broadly.

Market Focus Report

Spot the shifts before they hit your P&L. We track inflection points, adoption curves, pricing moves, and ecosystem plays to show where demand is heading, why it is changing, and what to do next across high-growth markets and disruptive tech

Survey Report

Real-time reads of user behavior. We track shifting priorities, perceptions of today’s and next-gen services, and provider experience, then pace how fast tech moves from trial to adoption, blending buyer, consumer, and channel inputs with social signals (#WhySwitch, #UX).

Bespoke Reports

Partner with our analyst team to build a custom report designed around your business priorities. From analysing market trends to assessing competitors or crafting bespoke datasets, we tailor insights to your needs.

Supplier Intelligence

Discovery & Profiling

Capacity & Footprint

Performance & Risk

Compliance & Governance

Commercial Readiness

Who Supplies Whom

Scorecards & Shortlists

Playbooks & Docs

Category Intelligence

Definition & Scope

Demand & Use Cases

Cost Drivers

Market Structure

Supply Chain Map

Trade & Policy

Operating Norms

Deliverables

Buyer Intelligence

Account Basics

Spend & Scope

Procurement Model

Vendor Requirements

Terms & Policies

Entry Strategy

Pain Points & Triggers

Outputs

Pricing Analysis

Benchmarks

Trends

Should-Cost

Indexation

Landed Cost

Commercial Terms

Deliverables

Brand Analysis

Positioning & Value Prop

Share & Presence

Customer Evidence

Go-to-Market

Digital & Reputation

Compliance & Trust

KPIs & Gaps

Outputs

Full Research Suite comprises of:

Market outlook & trends analysis

Market outlook & trends analysis

Interviews & case studies

Interviews & case studies

Strategic recommendations

Strategic recommendations

Vendor profiles & capabilities analysis

Vendor profiles & capabilities analysis

5-year forecasts

5-year forecasts

8 regions and 60+ country-level data splits

8 regions and 60+ country-level data splits

Market segment data splits

Market segment data splits

12 months of continuous data updates

12 months of continuous data updates

DELIVERED AS:

PDF EXCEL ONLINE

Full Research Suite


$5000

$7500

$10000

Buy Report Now
Similar Industry Reports

Similar Industry Reports

Square Cross Flow Side Outlet Cooling Tower Market

Square Cross Flow Side Outlet Cooling Tower Market Size and Share Forecast Outlook 2025 to 2035

Square Cross Flow All Steel Cooling Tower Market

Square Cross Flow All Steel Cooling Tower Market Size and Share Forecast Outlook 2025 to 2035

Square Mailing Tubes Market

Square Mailing Tubes Market Size and Share Forecast Outlook 2025 to 2035

Square Media Bottle Market

Square Media Bottle Market

French Square Bottle Market

French Square Bottle Market Size and Share Forecast Outlook 2025 to 2035

Firenze Square Jars Market

Firenze Square Jars Market Analysis – Growth & Forecast 2024-2034

Pails Market
Pails Market

Pails Market Analysis - Growth & Forecast 2025 to 2035

Plastic Pails Market

Plastic Pails Market Growth - Demand & Forecast 2025 to 2035

Conipack Pails Market

Conipack Pails Market Size and Share Forecast Outlook 2025 to 2035

Screw Top Pails Market

Screw Top Pails Market

Industrial Pails & Drums Market

Industrial Pails & Drums Market Size and Share Forecast Outlook 2025 to 2035

Future Market Insights

Square Pails Market

Chat With MaRIA

Chat With

MaRIA

Hi There, I am MaRIA, Your Market Research Intelligence Assistant. How may I help you?