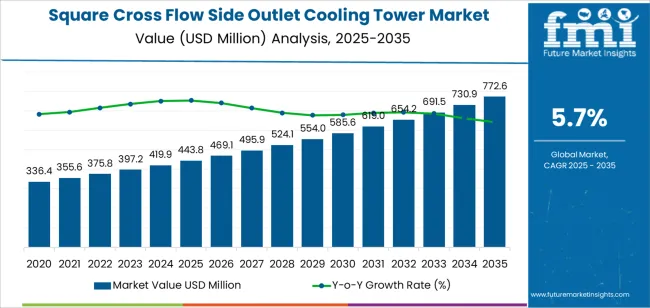
The square cross flow side outlet cooling tower market is forecast to reach USD 772.6 million by 2035 from USD 443.8 million in 2025, advancing at a 5.7% CAGR as industries increase adoption of compact and efficient cooling systems for heat rejection needs. Square cross flow side outlet cooling towers are selected for their ability to deliver high thermal performance within restricted footprints, making them suitable for power plants, chemical units, manufacturing facilities, and large commercial HVAC installations. Their structure supports uniform airflow, reduced pressure drop, and improved water distribution, thereby strengthening overall cooling efficiency while maintaining operational reliability in continuous-duty environments. Growth is supported by rising investment in industrial expansion, greater focus on reducing energy use in cooling operations, and the modernization of thermal management systems across key sectors.
Asia Pacific remains the strongest demand center due to rapid industrialization in China and India, while Europe and North America show stable adoption driven by infrastructure upgrades and replacement of aging cooling units. Advancements in fill media, corrosion-resistant materials, and automated control systems that enhance monitoring and airflow management contribute to wider acceptance across regions. Although high installation costs and complex integration in retrofit projects pose challenges, the long-term need for high-performance cooling equipment continues to drive global demand.
These towers are particularly beneficial in large-scale industrial applications where space is limited, and cooling capacity is a priority. As industries continue to prioritize energy efficiency and sustainability, the demand for square cross flow side outlet cooling towers is expected to grow. These cooling towers are widely used in power plants, petrochemical facilities, and HVAC systems, where efficient heat dissipation is essential to maintaining operational performance.
Between 2025 and 2030, the square cross flow side outlet cooling tower market is projected to grow from USD 443.8 million to approximately USD 561.1 million, adding USD 117.3 million, which accounts for about 35.7% of the total forecasted growth for the decade. This period will be characterized by rising demand for high-efficiency cooling systems in power generation, manufacturing, and industrial sectors, along with increasing investments in smart and sustainable cooling technologies.
From 2030 to 2035, the market is expected to expand from approximately USD 561.1 million to USD 772.6 million, adding USD 211.5 million, which constitutes about 64.3% of the overall growth. This phase will be marked by greater adoption in emerging markets, particularly in Asia Pacific, and an increasing focus on energy-efficient, environmentally friendly cooling systems across various industries. Technological advancements and the growing trend of industrial modernization will further drive the demand for square cross flow side outlet cooling towers during this period.
| Metric | Value |
|---|---|
| Market Value (2025) | USD 443.8 million |
| Market Forecast Value (2035) | USD 772.6 million |
| Forecast CAGR (2025 to 2035) | 5.7% |
The square cross flow side outlet cooling tower market is experiencing growth due to the increasing demand for effective and efficient heat dissipation solutions in industries such as power generation, manufacturing, and HVAC systems. These cooling towers are designed with a side outlet configuration, which improves air distribution, reduces pressure drop, and enhances cooling efficiency. Their square shape allows for a more compact design, making them suitable for installations in space-constrained environments while maintaining high performance.
The growing need for energy efficiency and environmental sustainability is a key driver of market growth. Industries are under pressure to reduce water and energy consumption, and square cross flow side outlet cooling towers help meet these demands by improving cooling efficiency, minimizing water wastage, and reducing energy losses. This trend is particularly significant in power plants, refineries, and chemical processing units, where cooling systems are integral to maintaining operational efficiency.
Technological advancements in cooling tower design, including better heat transfer materials and automation systems, are also contributing to market expansion. The rising demand for cooling systems in emerging markets, driven by industrialization and infrastructure development, is further supporting the growth of this market. Despite challenges such as high initial installation costs and the need for specialized maintenance, the overall market outlook remains positive as industries continue to prioritize reliable and energy-efficient cooling solutions.
The market is segmented by classification, application, and region. By classification, the market is divided into free-standing and combined types. Based on application, the market is categorized into industrial, commercial, and other applications. Regionally, the market is divided into Asia Pacific, Europe, North America, and other key regions.
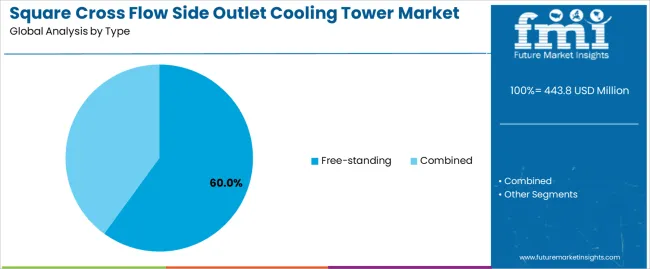
The free-standing classification dominates the square cross flow side outlet cooling tower market, accounting for 60.0% of the total market share. Free-standing cooling towers are widely used across various industrial sectors due to their simple design, ease of installation, and adaptability to different operational environments. These towers are preferred for large-scale operations where efficiency and space utilization are key considerations. Their cost-effectiveness, combined with reliable performance, makes them a popular choice for cooling applications in many industries.
The combined classification, while offering benefits such as compactness and integration with other system components, holds a smaller share of the market. Combined systems are used in specialized applications where space and integration with other infrastructure are critical, but they tend to be more expensive and require more complex installation processes. Despite the growth in combined systems, the free-standing towers remain the dominant choice due to their versatility and lower initial costs.
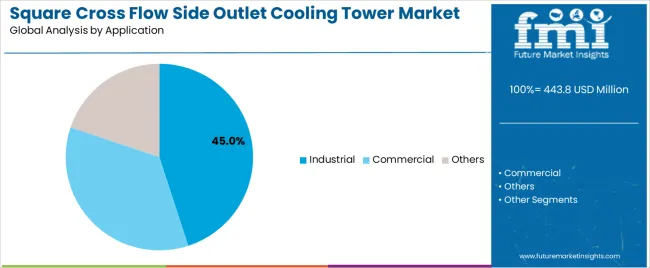
The industrial segment is the largest contributor to the square cross flow side outlet cooling tower market, accounting for approximately 45.0% of the market share. Industrial applications require cooling towers for large-scale manufacturing processes, power plants, and various sectors that generate substantial heat. The demand for efficient and reliable cooling systems in industries like manufacturing, power generation, and chemicals drives the growth of the industrial segment. These cooling towers help maintain operational efficiency by effectively regulating temperature in high-heat environments.
The commercial and other application segments also contribute significantly to the market. In commercial settings, cooling towers are used in large HVAC systems for office buildings, shopping centers, and other establishments that need consistent temperature regulation. The other applications include specialized industries that require customized cooling solutions. However, the industrial sector remains the dominant force in driving the overall demand for square cross flow side outlet cooling towers.
The market is expanding due to the increasing demand for efficient and compact cooling solutions in industrial, commercial and infrastructure applications. These systems offer features like square‑cell modular construction, side‑air‑outlet cross‑flow design and robust materials suited for tight‑space or retrofit sites. Key drivers include the growth of data centres, thermal‑management upgrades and stricter energy and water use regulations, while restraints stem from high upfront costs and integration challenges with existing infrastructures.
The segment is witnessing a move toward compact, modular square‑cell designs with side air‑outlet configurations, which support installations in restricted‑height or retrofit sites. These towers offer cross‑flow airflow (air enters from the side rather than top) which aids noise reduction and easier service access. Digital integration is gaining traction: remote monitoring, variable‑speed fans, and predictive maintenance analytics are being embedded. Manufacturers are also utilizing robust materials (all‑steel structures, corrosion‑resistant coatings) and advanced fill/drift eliminator systems to meet harsh‑environment demands in industrial and infrastructure applications. Finally, there is increasing preference for multi‑function units that combine cooling, de‑amination, and variable‑air‑volume control in one cabinet‑style footprint.
Growth is propelled by rising demand for efficient thermal‑management solutions in industries such as power generation, chemical processing, data‑centres, and large commercial HVAC systems where footprint, noise, and serviceability matter. The need for retrofits and upgrades of older cooling towers in which space or height is limited boosts adoption of side‑outlet designs. Increasing regulatory focus on energy efficiency, environmental compliance, and cooling‑water quality enhances demand for higher‑performance towers with improved heat‑transfer and drift‑control features. Growth of industrial and infrastructure projects in emerging regions, and the willingness to invest in longer‑life, lower‑maintenance cooling equipment, further drives market expansion.
Despite strong demand, several restraints hamper broader adoption. The initial capital cost of advanced side‑outlet, square‑cell towers especially those with heavy all‑steel construction and integrated digital controls can be significantly higher than traditional top‑air‑outlet models. Integration challenges arise when replacing or retrofitting older systems: aligning new tower geometry, ducting, and structural supports adds complexity and cost. Material and fabrication heterogeneity (e.g., corrosion protection, precision of fill media) leads to variable performance and reliability concerns. Supply‑chain issues (heavy steel fabrication, specialized drift eliminators) can extend lead times. In some regions, lower awareness of the benefits of side‑outlet designs means buyers remain with conventional configurations, limiting market penetration.
| Country | CAGR (%) |
|---|---|
| China | 7.7% |
| India | 7.1% |
| Germany | 6.6% |
| Brazil | 6.0% |
| USA | 5.4% |
| UK | 4.8% |
| Japan | 4.3% |
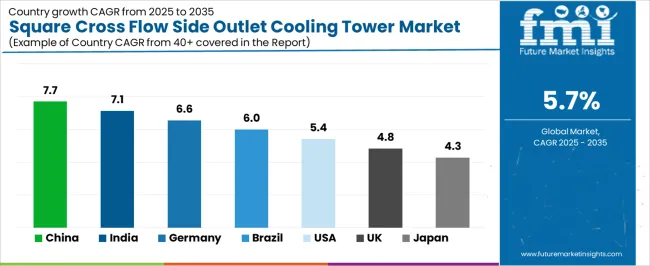
The global square cross flow side outlet cooling tower market is growing steadily, with China leading at a 7.7% CAGR, driven by industrial expansion, increasing energy demands, and the adoption of renewable energy sources. India follows with a 7.1% CAGR, supported by its growing manufacturing sector and focus on energy efficiency. Germany sees a 6.6% CAGR, driven by its strong industrial base and push for sustainability. Brazil grows at a 6.0% CAGR, supported by infrastructure development and the adoption of renewable energy technologies.
The USA experiences a 5.4% CAGR, driven by industrial needs and renewable energy integration. The UK and Japan grow at 4.8% and 4.3%, respectively, as they continue to focus on sustainability, industrial automation, and renewable energy adoption. The market is expected to continue expanding as industries globally prioritize energy-efficient, high-performance cooling solutions to meet increasing demand for reliable and sustainable power and cooling systems.
China is leading the square cross flow side outlet cooling tower sector with a 7.7% CAGR. The country’s industrial growth, particularly in power generation, manufacturing, and HVAC systems, is driving the demand for efficient cooling solutions. As China continues to expand its energy sector, including renewable energy projects like wind and solar power, the need for reliable cooling systems grows. Square cross flow cooling towers are crucial in maintaining temperature stability in large industrial facilities, ensuring optimal performance and minimizing operational downtime.
The country’s infrastructure projects, including new industrial developments and power plants, also contribute to the increased demand for these cooling towers. China’s ongoing investments in modernization, automation, and environmental goals further fuel the growth of the sector. With the rising focus on energy efficiency, the demand for advanced cooling technologies like square cross flow side outlet cooling towers is expected to remain strong. As the country works to balance industrial expansion with environmental goals, efficient cooling solutions will continue to play a key role in maintaining operational reliability across various sectors.
India is witnessing a steady 7.1% CAGR in the square cross flow side outlet cooling tower sector, driven by its expanding industrial base and increasing energy consumption. As India’s economy continues to grow, particularly in manufacturing, power generation, and infrastructure sectors, the demand for efficient cooling systems is rising. Square cross flow cooling towers are essential for regulating temperature in industrial processes, especially in sectors that require high-efficiency systems, such as power plants, chemicals, and textiles.
The country’s focus on renewable energy, particularly solar and wind power, has also increased the demand for efficient cooling technologies. These cooling towers play a crucial role in maintaining consistent power generation in renewable energy plants by stabilizing temperature and ensuring reliability. India’s expanding urban population and rising electricity demand from residential and commercial sectors further fuel the need for cooling systems. With government initiatives like "Make in India" and investments in infrastructure development, India’s sector for square cross flow side outlet cooling towers is expected to continue growing, driven by the need for modern, energy-efficient cooling technologies.
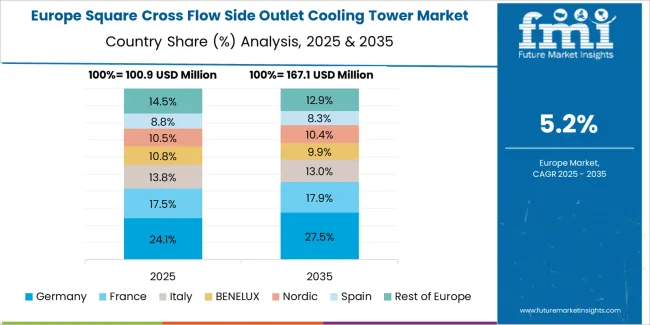
Germany is experiencing steady growth in the square cross flow side outlet cooling tower sector, with a 6.6% CAGR, supported by its strong industrial base and commitment to meeting energy needs. The country’s advanced manufacturing sector, including automotive, chemical, and energy industries, relies heavily on efficient cooling systems to maintain temperature stability and ensure operational efficiency. Square cross flow cooling towers are used in various industrial applications to manage heat loads, particularly in high-demand environments such as power plants and industrial complexes.
Germany’s push toward renewable energy and green technologies, especially in the power generation sector, is further driving the need for efficient cooling solutions. As the country integrates more renewable energy into its grid, cooling towers become crucial for maintaining the stability of these systems. Germany’s commitment to reducing its carbon footprint and increasing energy efficiency in industrial processes creates continued demand for advanced, energy-efficient cooling technologies. With the country's focus on precision engineering and meeting energy needs, the square cross flow side outlet cooling tower sector is expected to continue expanding as industries adopt more efficient and environmentally friendly cooling solutions.
Brazil is seeing moderate growth in the square cross flow side outlet cooling tower sector, with a 6.0% CAGR, driven by its expanding industrial and infrastructure sectors. As Brazil continues to industrialize, the demand for cooling towers in sectors like power generation, oil and gas, and chemical processing rises. Square cross flow cooling towers are essential in maintaining temperature stability and preventing equipment damage in these energy-intensive industries.
The country’s focus on renewable energy projects, particularly in hydropower and wind power, further contributes to the demand for efficient cooling technologies. Brazil’s industrial projects, including the development of new manufacturing plants and power plants, are driving growth in the cooling tower sector. Brazil's efforts to modernize its energy infrastructure and reduce energy consumption further fuel the need for energy-efficient cooling systems. As the country continues to expand its industrial base and embrace more sustainable energy solutions, the sector for square cross flow side outlet cooling towers is expected to continue growing, supporting the country’s development goals.
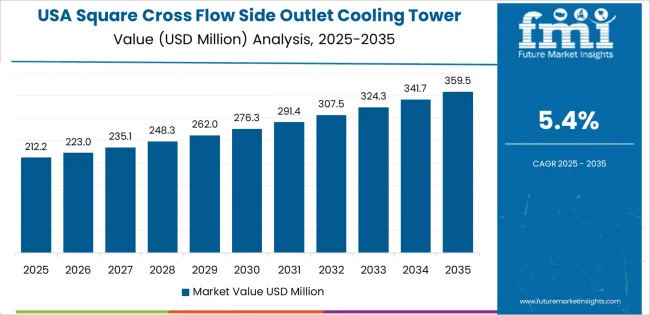
The USA is experiencing steady growth in the square cross flow side outlet cooling tower sector, with a 5.4% CAGR, largely driven by the need for efficient cooling systems in power generation, manufacturing, and industrial sectors. The country’s industrial base, particularly in sectors such as automotive, petrochemicals, and energy production, relies heavily on cooling systems to maintain stable operations. Square cross flow cooling towers are essential for regulating temperatures in these industries, ensuring optimal performance and preventing equipment failure.
The USA’s growing focus on renewable energy, particularly wind and solar power, is also contributing to the demand for advanced cooling solutions. As renewable energy sources are integrated into the national grid, the need for reliable and efficient cooling systems in power plants and renewable energy facilities grows. The USA’s continued investments in infrastructure, along with a focus on energy efficiency and sustainable development, support the ongoing need for high-performance cooling towers. With the growing emphasis on environmental sustainability and energy efficiency, the sector for square cross flow side outlet cooling towers in the USA is expected to continue its steady growth.
The UK is witnessing moderate growth in the square cross flow side outlet cooling tower sector, with a 4.8% CAGR, driven by the increasing demand for cooling systems in power generation, manufacturing, and renewable energy sectors. As the UK continues to invest in infrastructure and renewable energy projects, the need for efficient and reliable cooling technologies grows. Square cross flow cooling towers are essential for managing temperature fluctuations in industrial facilities, ensuring stability and efficiency.
The UK’s commitment to reducing carbon emissions drives the adoption of energy-efficient cooling solutions. The country's transition to renewable energy, particularly in offshore wind and solar power, is contributing to the demand for advanced cooling systems that can handle the fluctuations in energy generation. The focus on modernizing industrial infrastructure and improving energy resilience also supports the growth of the sector. With the UK's increasing adoption of smart grid technologies and energy-efficient systems, the demand for square cross flow side outlet cooling towers is expected to remain strong as industries prioritize sustainable and high-performance cooling solutions.
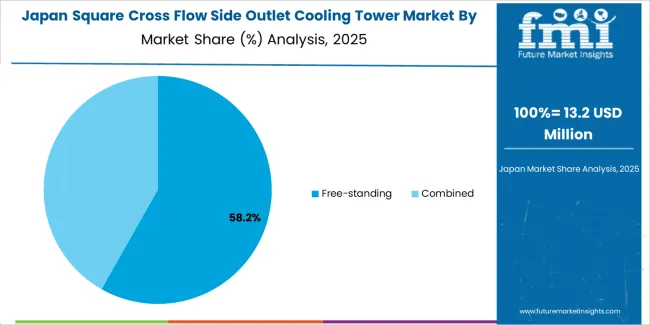
Japan is experiencing steady growth in the square cross flow side outlet cooling tower sector, with a 4.3% CAGR, driven by the country’s strong industrial base and focus on high-efficiency technologies. Japan’s manufacturing and energy sectors, including automotive, electronics, and power generation, require reliable cooling systems to manage temperature in their operations. Square cross flow cooling towers are widely used in these sectors for cooling applications that require precise temperature control.
The country's increasing focus on renewable energy, particularly in solar and wind power, is contributing to the demand for efficient cooling systems. As Japan integrates more renewable energy into its grid, the need for cooling towers that can maintain temperature stability and improve energy efficiency becomes crucial. Japan's commitment to innovation and environmental goals, combined with its focus on reducing carbon emissions, supports the demand for advanced, energy-efficient cooling technologies. As the country continues to modernize its industrial infrastructure and adopt more sustainable energy solutions, the sector for square cross flow side outlet cooling towers will continue to grow steadily, supporting Japan's environmental and industrial development goals.
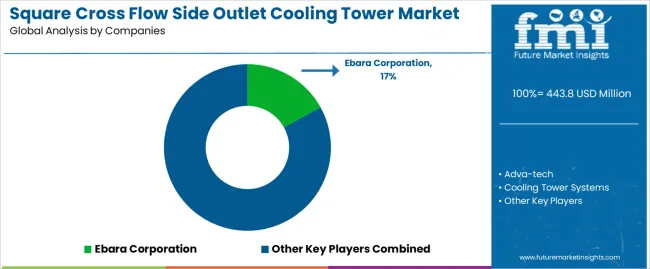
The square cross flow side outlet cooling tower market is competitive, with several global and regional players providing efficient and reliable solutions for industrial cooling. Ebara Corporation leads the market with a 17% share, known for its advanced cooling technologies and engineering expertise. Ebara’s strong market presence and reputation for delivering high-performance cooling towers make it a key player in the square cross flow side outlet cooling tower segment.
Other significant players include Adva-tech, Cooling Tower Systems, and Classik Cooling Towers, each offering specialized solutions tailored to industrial and commercial applications. Adva-tech focuses on providing energy-efficient and innovative cooling tower systems, while Cooling Tower Systems and Classik Cooling Towers emphasize product reliability, durability, and cost-effectiveness, making them strong contenders in the market.
Companies like EVAPCO, GS Cooling Towers, and KOBELCO ECO-SOLUTIONS contribute to the market with advanced technologies designed for high-performance and environmentally friendly cooling solutions. Kelvion Holding, Midwest Cooling Towers, and NSCTPL focus on providing tailored solutions for specific industry needs, such as high-temperature operations and compact designs. Regional players such as Paharpur Cooling Towers, WATCO, and Baltimore Aircoil also compete in the market by offering competitively priced products that cater to regional demand and applications.
The competition in the square cross flow side outlet cooling tower market is driven by technological advancements, energy efficiency, environmental compliance, and the ability to meet specific customer requirements. The growing demand for energy-efficient and customizable cooling solutions continues to shape the competitive landscape.
| Items | Values |
|---|---|
| Quantitative Units (2025) | USD million |
| Classification | Free-standing, Combined |
| Application | Industrial, Commercial, Others |
| Regions Covered | Asia Pacific, Europe, North America, Latin America, Middle East & Africa |
| Countries Covered | China, Japan, South Korea, India, Australia & New Zealand, ASEAN, Rest of Asia Pacific, Germany, United Kingdom, France, Italy, Spain, Nordic, BENELUX, Rest of Europe, United States, Canada, Mexico, Brazil, Chile, Rest of Latin America, Kingdom of Saudi Arabia, Other GCC Countries, Turkey, South Africa, Other African Union, Rest of Middle East & Africa |
| Key Companies Profiled | Ebara Corporation, Adva Tech, Cooling Tower Systems, Classik Cooling Towers, Composite Cooling Solutions, EVAPCO, GS Cooling Towers, KOBELCO ECO SOLUTIONS, Kelvion Holding, Midwest Cooling Towers, NSCTPL, PERFECT Cooling Towers, Paharpur Cooling Towers, WATCO, Baltimore Aircoil, BAHOP, SPX Cooling Tech, Yuanheng Technology, Teling Energy Saving Air Conditioning Equipment, Feixue Refrigeration Equipment, Liangchi Group, King Sun Industry, Liangyan Cooling and Heating Equipment |
| Additional Attributes | Dollar sales by classification and application categories, market growth trends, market adoption by classification and application segments, regional adoption trends, competitive landscape, technological advancements in square cross flow side outlet cooling tower design, integration with industrial cooling systems. |
The global square cross flow side outlet cooling tower market is estimated to be valued at USD 443.8 million in 2025.
The market size for the square cross flow side outlet cooling tower market is projected to reach USD 772.6 million by 2035.
The square cross flow side outlet cooling tower market is expected to grow at a 5.7% CAGR between 2025 and 2035.
The key product types in square cross flow side outlet cooling tower market are free-standing and combined.
In terms of application, industrial segment to command 45.0% share in the square cross flow side outlet cooling tower market in 2025.


Our Research Products

The "Full Research Suite" delivers actionable market intel, deep dives on markets or technologies, so clients act faster, cut risk, and unlock growth.

The Leaderboard benchmarks and ranks top vendors, classifying them as Established Leaders, Leading Challengers, or Disruptors & Challengers.

Locates where complements amplify value and substitutes erode it, forecasting net impact by horizon

We deliver granular, decision-grade intel: market sizing, 5-year forecasts, pricing, adoption, usage, revenue, and operational KPIs—plus competitor tracking, regulation, and value chains—across 60 countries broadly.

Spot the shifts before they hit your P&L. We track inflection points, adoption curves, pricing moves, and ecosystem plays to show where demand is heading, why it is changing, and what to do next across high-growth markets and disruptive tech

Real-time reads of user behavior. We track shifting priorities, perceptions of today’s and next-gen services, and provider experience, then pace how fast tech moves from trial to adoption, blending buyer, consumer, and channel inputs with social signals (#WhySwitch, #UX).

Partner with our analyst team to build a custom report designed around your business priorities. From analysing market trends to assessing competitors or crafting bespoke datasets, we tailor insights to your needs.
Supplier Intelligence
Discovery & Profiling
Capacity & Footprint
Performance & Risk
Compliance & Governance
Commercial Readiness
Who Supplies Whom
Scorecards & Shortlists
Playbooks & Docs
Category Intelligence
Definition & Scope
Demand & Use Cases
Cost Drivers
Market Structure
Supply Chain Map
Trade & Policy
Operating Norms
Deliverables
Buyer Intelligence
Account Basics
Spend & Scope
Procurement Model
Vendor Requirements
Terms & Policies
Entry Strategy
Pain Points & Triggers
Outputs
Pricing Analysis
Benchmarks
Trends
Should-Cost
Indexation
Landed Cost
Commercial Terms
Deliverables
Brand Analysis
Positioning & Value Prop
Share & Presence
Customer Evidence
Go-to-Market
Digital & Reputation
Compliance & Trust
KPIs & Gaps
Outputs
Full Research Suite comprises of:
Market outlook & trends analysis
Interviews & case studies
Strategic recommendations
Vendor profiles & capabilities analysis
5-year forecasts
8 regions and 60+ country-level data splits
Market segment data splits
12 months of continuous data updates
DELIVERED AS:
PDF EXCEL ONLINE
Square Pails Market Size and Share Forecast Outlook 2025 to 2035
Square Mailing Tubes Market Size and Share Forecast Outlook 2025 to 2035
Square Media Bottle Market
Square Cross Flow All Steel Cooling Tower Market Size and Share Forecast Outlook 2025 to 2035
French Square Bottle Market Size and Share Forecast Outlook 2025 to 2035
Firenze Square Jars Market Analysis – Growth & Forecast 2024-2034
Cross-chain NFT Market Size and Share Forecast Outlook 2025 to 2035
Cross-species Organ Transplantation Market Forecast and Outlook 2025 to 2035
Cross Interconnection Protection Box Market Size and Share Forecast Outlook 2025 to 2035
Cross Corner Industrial Bags Market Size and Share Forecast Outlook 2025 to 2035
Cross-Linked Polyethylene Market Size and Share Forecast Outlook 2025 to 2035
Cross-Border Road Transport Market Size and Share Forecast Outlook 2025 to 2035
Crossfit Apparel Market Size and Share Forecast Outlook 2025 to 2035
Cross Point Switch Market Size and Share Forecast Outlook 2025 to 2035
Cross Pein Hammer Market Size and Share Forecast Outlook 2025 to 2035
Cross Training Shoes Market Size and Share Forecast Outlook 2025 to 2035
Crossover Market Size and Share Forecast Outlook 2025 to 2035
Cross-Cloud Analytics Market Insights - Growth & Forecast 2025 to 2035
Cross-Belt Sorters Market
Cross-linked Shrink Films Market

Thank you!
You will receive an email from our Business Development Manager. Please be sure to check your SPAM/JUNK folder too.
Chat With
MaRIA