Tamper Evident Labeler Market Size and Share Forecast Outlook 2025 to 2035

The tamper evident labeler market is expected to grow from USD 2.6 billion in 2025 to USD 4.1 billion by 2035, resulting in a total increase of USD 1.5 billion over the forecast decade. This represents a 57.7% total expansion, with the market advancing at a compound annual growth rate (CAGR) of 4.7%. Over ten years, the market grows by a 1.6 multiple.
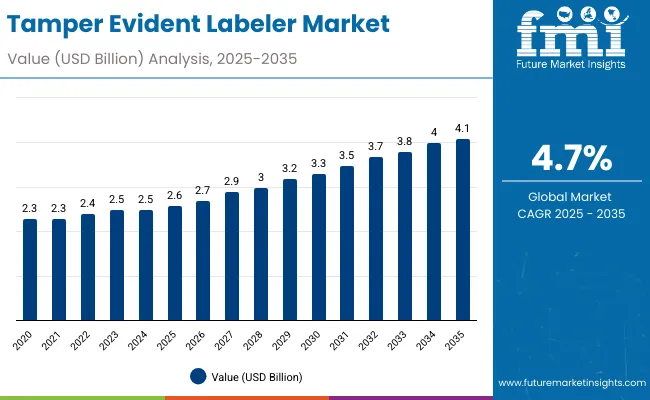
Quick Stats for Tamper Evident Labeler Market

  • Market Value (2025): USD 2.6 billion
  • Market Forecast Value (2035): USD 4.1 billion
  • Market Forecast CAGR: 4.7%
  • Leading Segment in 2025: Shrink sleeve labeling (33.4%)
  • Key Growth Regions: Asia-Pacific (China is the fastest-growing market with 5.2% CAGR)
  • Top Key Players: Siddhivinayak Engineering, b + b Automation and Control Technology GmbH, PDC International Corp., Maharshi, Jekson Vision, CLHSANYOU, Interpack Technologies LLP, Worldpack Automation Systems, Vial Labeller, Lodha International LLP.

Tamper Evident Labeler Market

Metric Value
Tamper Evident Labeler Market Estimated Value in (2025 E) USD 2.6 billion
Tamper Evident Labeler Market Forecast Value in (2035 F) USD 4.1 billion
Forecast CAGR (2025 to 2035) 4.7%

In the first five years (2025-2030), the market progresses from USD 2.6 billion to USD 3.2 billion, contributing USD 0.6 billion, or 40.0% of total decade growth. This phase is shaped by regulatory enforcement in pharmaceuticals and food packaging, where safety and authenticity verification are critical. Growth is reinforced by adoption in cosmetics and electronics for brand protection.

In the second half (2030-2035), the market grows from USD 3.2 billion to USD 4.1 billion, adding USD 0.9 billion, or 60.0% of the total growth. This acceleration is supported by innovations in digital printing, smart labeling with NFC/RFID, and sustainable adhesive technologies. Expanding e-commerce trade of sensitive goods further strengthens demand, positioning tamper evident labelers as indispensable to global packaging security.

From 2020 to 2024, the tamper evident labeler market expanded from USD 2.1 billion to USD 2.4 billion, supported by regulatory compliance in pharmaceuticals, food, and cosmetics where product security and authenticity are essential. Nearly 70% of revenue was led by OEMs providing high-speed labeling equipment integrated with serialization features.

Leaders such as HERMA, Videojet Technologies, and Marchesini Group emphasized durability, seal integrity, and compatibility with diverse packaging formats. Differentiation focused on traceability, print clarity, and anti-tampering efficiency, while smart QR authentication remained secondary. Service-driven models such as validation and calibration services accounted for under 18% of market value, with capital investments dominating procurement.

By 2035, the tamper evident labeler market will reach USD 4.1 billion, growing at a CAGR of 4.70%, with smart labeling solutions and SaaS-based traceability platforms contributing over 40% of revenues. Competitive pressure will rise as providers introduce blockchain-linked serialization, AI-based defect detection, and cloud-integrated compliance tracking.

Established players are transitioning toward hybrid offerings that combine physical labeling systems with digital verification platforms. Emerging companies such as WLS (WeilerLabeling Systems), Accutek Packaging, and Advanced Labelling Systems are gaining traction with recyclable label materials, modular machine designs, and customizable solutions addressing sustainability, efficiency, and strict regulatory mandates worldwide.

Why is the Tamper Evident Labeler Market growing?

The rising focus on product safety, authenticity, and regulatory compliance is driving growth in the tamper evident labeler market. These labelers play a critical role in preventing counterfeiting, ensuring traceability, and enhancing consumer trust, particularly in pharmaceuticals, food, and cosmetics. Expanding global trade and stricter packaging regulations are further accelerating adoption.

Labelers with advanced sealing technologies, serialization features, and compatibility with smart packaging are gaining popularity for their ability to provide visible proof of tampering. Integration with QR codes, RFID, and blockchain platforms enhances supply chain transparency. Eco-friendly label materials and efficient labeling systems also align with sustainability goals, boosting widespread market acceptance.

Segmental Analysis

The market is segmented by technology, label type, machine type, application, end-use industry, and region. Technology segmentation includes pressure-sensitive labeling, glue-applied labeling, shrink sleeve labeling, heat seal labeling, and RFID/NFC-integrated labeling, ensuring secure product marking. Label type covers void labels, destructible labels, holographic labels, shrink film labels, and seal tape labels, offering multiple levels of tamper resistance. Machine type segmentation includes automatic labeling machines, semi-automatic labeling machines, and manual labeling systems, enabling scalability across production volumes.

Applications span product authentication, tamper detection, track and trace, and brand protection, addressing regulatory compliance and consumer trust. End-use industries include pharmaceuticals and healthcare, food and beverages, cosmetics and personal care, consumer electronics, industrial goods, and retail. Regionally, the market is segmented into North America, Europe, Asia-Pacific, Latin America, and the Middle East & Africa.
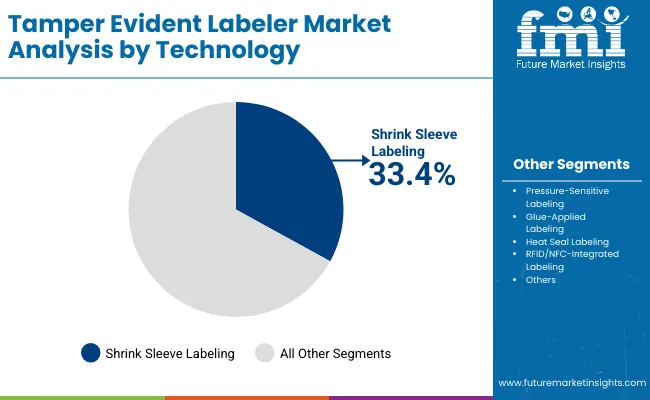
Shrink Sleeve Labeling Leads Technology with Full Coverage and High Security

Tamper Evident Labeler Market By Technology

Shrink sleeve labeling is projected to account for 33.4% of the market in 2025, driven by its ability to provide 360-degree coverage and high tamper resistance. These labels conform tightly to container shapes, ensuring visibility of any attempt at removal or replacement. Their versatility across bottles, cartons, and specialty packs supports broad adoption.

Industries value shrink sleeves for combining security with branding opportunities through vibrant graphics and holographic effects. Adoption is particularly strong in pharmaceuticals and beverages, where shelf appeal and product protection are equally critical. Their growing use reflects the rising need for both functional and aesthetic label solutions.
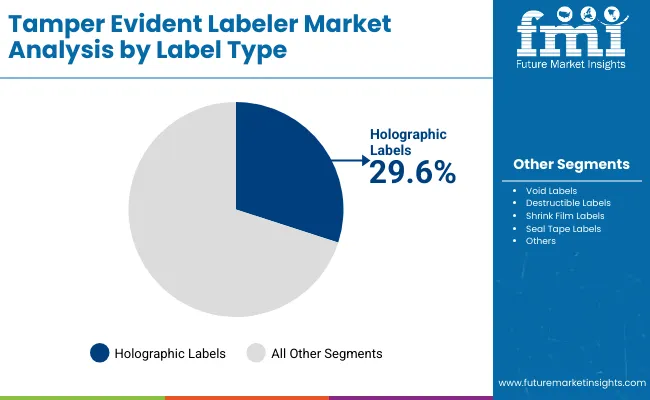
Holographic Labels Dominate Label Types with Strong Visual Authentication

Tamper Evident Labeler Market By Lable Type

Holographic labels are forecast to represent 29.6% of the market in 2025, as they provide strong deterrence against counterfeiting. Their 3D visual effects are difficult to replicate, giving consumers a quick and reliable means of authentication. These labels are used extensively in healthcare, electronics, and premium consumer goods.

Advances in micro-optic patterns and laser imaging enhance the security level of holographic labels. Their appeal is further strengthened by integration with QR codes or NFC features for multi-layered verification. The segment’s dual role in brand protection and consumer trust ensures its continued leadership.
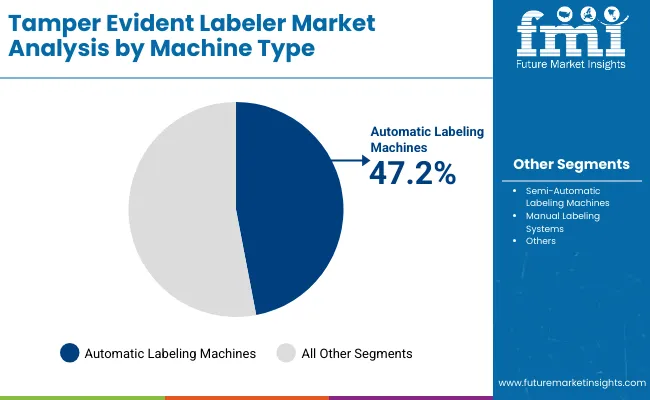
Automatic Labeling Machines Lead Equipment Type with High-Speed Capabilities

Tamper Evident Labeler Market By Machine Type

Automatic labeling machines are expected to hold 47.2% of the market in 2025, reflecting demand for high-speed, precision labeling in large-scale production. These machines integrate vision systems to ensure label placement accuracy and detect misalignments in real time. Their ability to handle multiple label types enhances operational flexibility.

Adoption is reinforced by labor cost pressures and rising demand for consistent product security. Automatic systems also allow integration with serialization and coding modules, aligning with regulatory compliance needs. Their role in scaling tamper-evident solutions makes them the backbone of modern labeling operations.
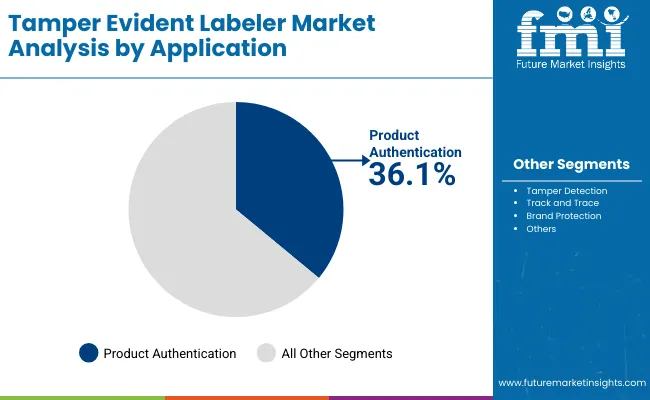
Product Authentication Applications Dominate with Consumer Safety Focus

Tamper Evident Labeler Market By Application

Product authentication is projected to account for 36.1% of the market in 2025, as tamper-evident labels play a central role in combating counterfeiting. By providing visible evidence of authenticity, these labels protect consumer trust and brand reputation across industries.

Pharmaceuticals and luxury goods lead adoption due to high counterfeiting risks. Labels incorporating serialization, barcodes, and holograms strengthen supply chain security. As regulatory demands for product verification increase, authentication-focused applications remain the top driver of market demand.
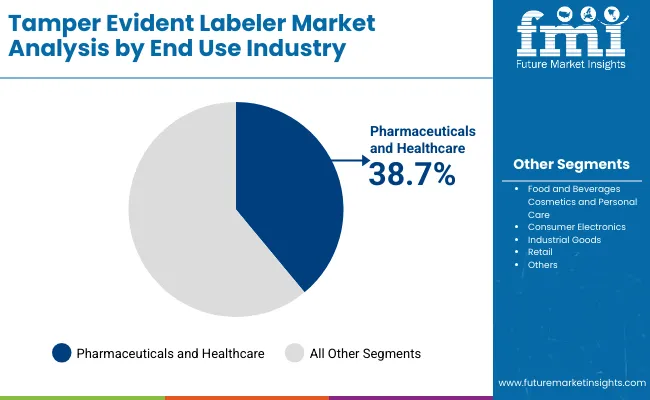
Pharmaceuticals and Healthcare Lead End-Use with Strict Regulatory Requirements

Tamper Evident Labeler Market By End Use Industry

The pharmaceuticals and healthcare sector is expected to hold 38.7% of the market in 2025, reflecting stringent regulations mandating tamper-evident packaging for patient safety. Labels ensure medicines remain uncompromised from manufacturing through distribution.

Adoption is driven by rising global focus on serialization and traceability to prevent counterfeit drugs. The sector’s emphasis on compliance, quality assurance, and consumer protection makes it the largest end-use market. Continuous innovation in secure label formats further reinforces its leadership.

What are the Drivers, Restraints, and Key Trends of the Tamper Evident Labeler Market?

The tamper evident labeler market is growing as industries prioritize product security, regulatory compliance, and consumer trust. Rising demand from pharmaceuticals, food, and cosmetics for anti-counterfeiting solutions is fueling adoption. However, high equipment costs and integration challenges limit penetration among small players. Technological advancements in smart labels, serialization, and eco-friendly adhesives are reshaping the market’s trajectory.

Product Security, Compliance, and Consumer Confidence Driving Adoption

Tamper evident labelers are widely used in pharmaceuticals to meet strict regulatory requirements for drug safety and authenticity. Food and cosmetic sectors also adopt these solutions to protect against tampering and contamination risks. Their ability to provide visible evidence of interference helps prevent counterfeiting and reassures consumers about product integrity. Growing awareness of supply chain transparency and global safety standards further supports market expansion, making labelers an essential investment for brand protection.

High Costs, Technical Complexity, and Limited Awareness Restraining Growth

Adoption is slowed by the high cost of advanced labeler equipment and integration with high-speed packaging lines. Smaller firms face difficulties justifying capital investments, especially in cost-sensitive markets. Technical complexity, including compatibility with varied packaging formats and substrates, adds further challenges. Limited awareness among SMEs about the benefits of tamper evident labeling also impacts adoption rates. Additionally, ongoing maintenance requirements and skilled workforce training create operational burdens that restrict market growth.

Smart Labels, Serialization, and Eco-friendly Adhesives Trends Emerging

Key trends include the integration of smart labels with QR codes, RFID, and NFC technologies for authentication and consumer engagement. Serialization is gaining momentum in pharmaceuticals, allowing end-to-end product traceability across supply chains. Sustainability is also shaping innovation, with manufacturers developing biodegradable adhesives and recyclable label materials. Compact, modular labelers with higher automation capabilities are emerging to reduce downtime and improve efficiency. These advancements are positioning tamper evident labelers as both compliance tools and brand value enhancers.
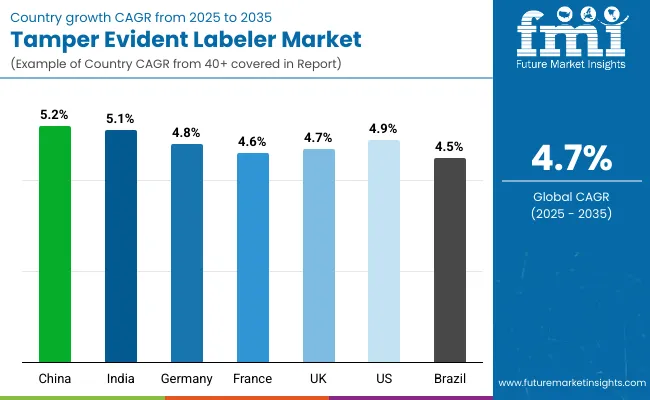
Analysis of Tamper Evident Labeler Market by Key Countries

Country Wise Analysis Of Tamper Evident Labeler Market

The global tamper evident labeler market is expanding steadily, driven by rising concerns over product authenticity, regulatory compliance, and consumer safety. Asia-Pacific is emerging as a high-growth region, with China and India fueling adoption through increased demand in pharmaceuticals, food, and personal care. Developed economies like the USA, Germany, and Japan are leading in advanced automation, smart labeling systems, and eco-friendly adhesives, ensuring packaging integrity while enhancing traceability and trust across multiple industries worldwide.
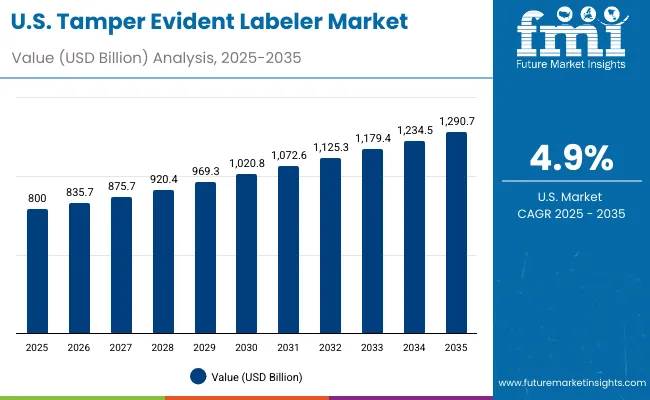
Sales Outlook for Tamper Evident Labeler Market United States

Usa Tamper Evident Labeler Market

The USA market is projected to grow at a CAGR of 4.9% from 2025 to 2035, supported by strict FDA packaging regulations and rising pharmaceutical and food demand. Labelers with serialization, track-and-trace, and digital authentication features are gaining traction. Growth is also driven by consumer awareness around tamper resistance in everyday products. Manufacturers are focusing on automation-ready machines with integrated vision systems to ensure compliance, efficiency, and safety across large-scale production facilities.
  • Pharma firms adopt tamper evident labelers for FDA-compliant serialization.
  • Food companies integrate smart labelers to reassure product integrity.
  • OEMs develop automation-ready systems with vision inspection tools.

Growth Outlook for Tamper Evident Labeler Market Germany

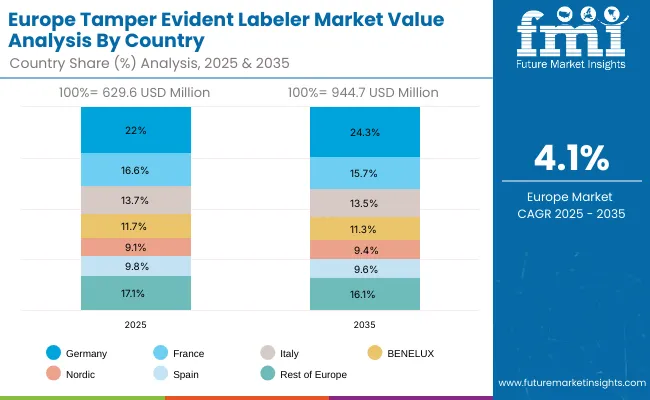
Europe Tamper Evident Labeler Market

Germany’s market is expected to grow at a CAGR of 4.8%, fueled by strong demand in pharmaceuticals, chemicals, and premium beverages. Strict EU safety and labeling directives are driving adoption of tamper evident systems. German OEMs are innovating with modular labelers that feature recyclable adhesive solutions and smart sensors. Increasing demand for export compliance and consumer trust is reinforcing demand for tamper evident labeling systems across German industries.

  • Pharma exporters use labelers for EU serialization requirements.
  • Premium beverage firms adopt tamper seals for consumer safety.
  • OEMs design modular, eco-friendly labeling technologies.

Expansion Outlook for Tamper Evident Labeler Market United Kingdom

The UK market is projected to grow at a CAGR of 4.7%, supported by increasing demand for secure labeling in healthcare, FMCG, and premium drinks. Adoption is being driven by compliance with FSMA standards and growing e-commerce demand for secure packaging. SMEs are adopting compact, cost-effective labeler solutions to meet safety and traceability needs. Rising emphasis on digital authentication is also fueling growth across the UK’s packaging sector.

  • Healthcare sector adopts labelers to protect medical supplies.
  • Beverage brands integrate tamper seals for authenticity.
  • SMEs implement compact systems to ensure compliance.

Sales Outlook for Tamper Evident Labeler Market China

China’s market is projected to grow at a CAGR of 5.2%, driven by rapid expansion in pharmaceuticals, food safety regulations, and cross-border e-commerce. Domestic manufacturers are producing affordable, scalable tamper evident labeling systems with smart tracking features. Government efforts to combat counterfeit goods are boosting demand. Adoption is also supported by export-oriented industries requiring compliance with global standards, making China a key hub for tamper evident packaging solutions.

  • Pharma companies adopt labelers to comply with safety regulations.
  • E-commerce exporters integrate tamper evident seals for global compliance.
  • Local OEMs scale affordable, automation-ready labeling technologies.

Growth Outlook for Tamper Evident Labeler Market India

India is forecast to grow at a CAGR of 5.1%, supported by rising demand in pharmaceuticals, FMCG, and food exports. Government initiatives to enhance drug traceability and food safety compliance are accelerating adoption. SMEs and mid-scale manufacturers are increasingly shifting to cost-effective, automated labelers. Export-driven sectors, including healthcare and beverages, are further driving investments in tamper evident packaging to align with international standards.
  • Pharma exporters adopt tamper evident labelers for global market compliance.
  • FMCG brands use seals to enhance customer trust and safety.
  • SMEs prefer affordable automation-enabled labeling systems.

Growth Outlook for Tamper Evident Labeler Market Japan

Japan Tamper Evident Labeler Market

Japan’s market is projected to grow at a CAGR of 4.6%, led by demand in healthcare, electronics, and premium food packaging. Companies are focusing on compact, high-precision labelers designed for limited-space facilities. Innovation in recyclable adhesives and smart labels with QR authentication is a key trend. Rising demand for tamper evident solutions in premium and export-focused segments is ensuring stable adoption across Japan’s packaging industry.
  • Electronics firms use labelers to protect sensitive devices.
  • Food brands adopt tamper seals to meet export safety norms.
  • OEMs design compact, precision labelers for space-constrained plants.

Expansion Outlook for Tamper Evident Labeler Market South Korea

South Korea Tamper Evident Labeler Market

South Korea’s market is expected to grow at a CAGR of 4.7%, supported by its strong pharmaceutical, cosmetics, and beverage industries. Tamper evident labelers are being widely used for authenticity, safety, and compliance in both domestic and export markets. Local manufacturers are innovating with automation-ready, smart labelers integrated with digital tracking. Rising demand for K-beauty and K-food products abroad is further driving adoption of tamper evident labeling systems.

  • Cosmetics brands deploy tamper evident seals for export compliance.
  • Beverage firms use labelers to strengthen product safety assurances.
  • OEMs integrate labelers with smart tracking for global trade.

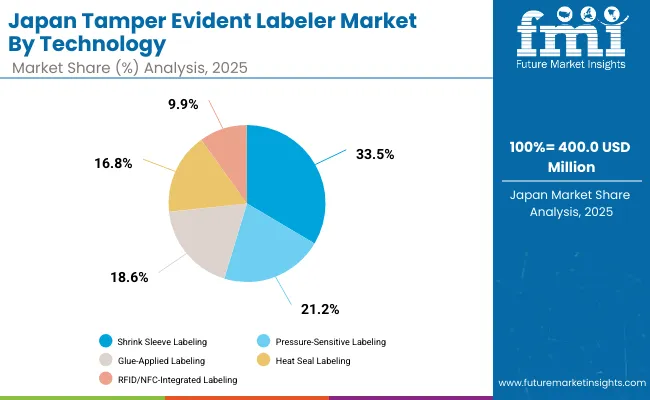
Analysis of Japan’sTamper Evident Labeler Market by Technology

Japan’s tamper evident labeler market, valued at USD 400 million in 2025, is dominated by shrink sleeve labeling with 31.9% share, reflecting its popularity for full-package coverage and strong visual appeal. Pressure-sensitive labeling follows at 20.9%, while glue-applied labeling holds 19.2%. Heat seal labeling captures 17.3%, and RFID/NFC-integrated solutions stand at 10.7%. Shrink sleeves lead due to their adaptability across beverages, pharmaceuticals, and consumer goods, ensuring product authenticity and tamper resistance. RFID/NFC-integrated labels, although smaller, are expanding quickly as smart packaging demand grows, highlighting Japan’s move toward digital traceability, anti-counterfeit protection, and enhanced consumer trust through secure labeling technologies.

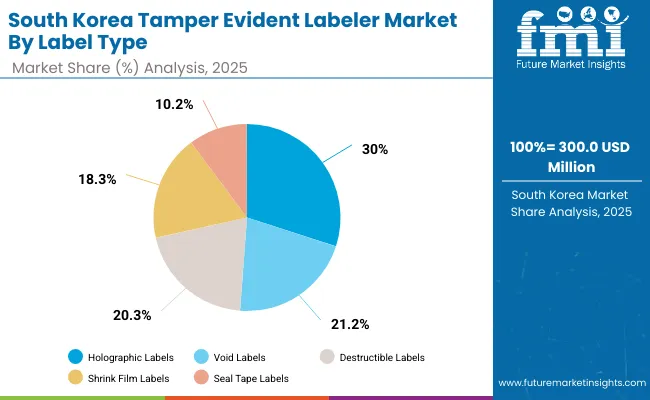
Analysis of South Korea’s Tamper Evident Labeler Market by Label Type

South Korea’s tamper evident labeler market in 2025, valued at USD 300 million, is led by holographic labels, capturing 28.7% share due to their visual security and difficulty to replicate. Void labels follow with 21.9%, while destructible labels account for 20.4%. Shrink film labels hold 17.9%, and seal tape labels represent 11.0%. Holographic labels dominate across food, beverage, and healthcare, providing reliable anti-counterfeit solutions. Void and destructible labels gain traction in electronics and high-value goods, offering immediate tamper evidence. Shrink film and seal tapes remain key in cost-sensitive applications. This distribution shows South Korea’s emphasis on layered, multi-technology packaging security.
Competitive Landscape of Tamper Evident Labeler Market

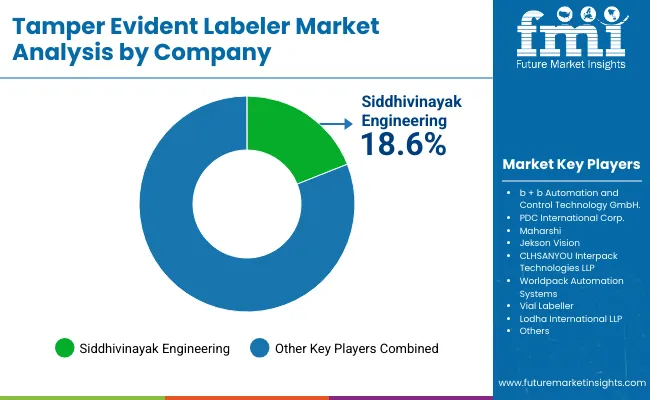
Tamper Evident Labeler Market By Company

The tamper evident labeler market is moderately fragmented, with labeling machinery manufacturers, automation specialists, and vision inspection providers competing across pharmaceutical, food, and personal care sectors. Global leaders such as Siddhivinayak Engineering, b + b Automation and Control Technology GmbH, and PDC International Corp. hold notable market share, driven by high-speed labeling precision, integration with serialization systems, and compliance with FDA and EU regulatory standards. Their strategies increasingly emphasize anti-counterfeiting, digital traceability, and modular machine design.

Established mid-sized players including Maharshi, Jekson Vision, and CLHSANYOU are supporting adoption of tamper evident labeling machines featuring 2D code verification, holographic label compatibility, and servo-driven application systems. These companies are especially active in pharmaceutical and nutraceutical industries, offering compact layouts, automated rejection mechanisms, and advanced camera-based systems that ensure compliance and reduce counterfeit risks.

Specialized regional providers such as Interpack Technologies LLP, Worldpack Automation Systems, Vial Labeller, and Lodha International LLP focus on cost-effective solutions for emerging markets and small to mid-scale manufacturers. Their strengths lie in customizable designs, quick changeovers, and integration with packaging lines, enabling scalable deployment of tamper evident labeling while ensuring affordability and regulatory compliance.

Key Development

  • In September 2025, PDC International served as an exhibitor at PACK EXPO Las Vegas 2025, showcasing its advanced tamper-evident banding machinery, shrink sleeve labelers, and related labeling solutions.
  • In 2023, Siddhivinayak Engineering markets automatic tamper-evident labeling machines (e.g., for BOPP labels that visibly break upon tampering) and has highlighted these in their blog and product-service pages.

Key Companies

  • Siddhivinayak Engineering
  • b + b Automation and Control Technology GmbH.
  • PDC International Corp.
  • Maharshi
  • Jekson Vision
  • CLHSANYOU
  • Interpack Technologies LLP
  • Worldpack Automation Systems
  • Vial Labeller
  • Lodha International LLP

Scope of the Report

Item Value
Quantitative Units USD 2.6 Billion
By Technology Pressure-Sensitive Labeling , Glue-Applied Labeling , Shrink Sleeve Labeling , Heat Seal Labeling , RFID/NFC-Integrated Labeling
By Label Type Void Labels, Destructible Labels, Holographic Labels, Shrink Film Labels, Seal Tape Labels
By Machine Type Automatic Labeling Machines, Semi-Automatic Labeling Machines, Manual Labeling Systems
By Application Product Authentication, Tamper Detection, Track and Trace, Brand Protection
By End-Use Industry Pharmaceuticals and Healthcare, Food and Beverages, Cosmetics and Personal Care, Consumer Electronics, Industrial Goods, Retail
Key Companies Profiled Siddhivinayak Engineering, b + b Automation and Control Technology GmbH, PDC International Corp., Maharshi , Jekson Vision, CLHSANYOU, Interpack Technologies LLP, Worldpack Automation Systems, Vial Labeller, Lodha International LLP
Additional Attributes Shrink sleeve labeling is expected to account for a 33.4% share in 2025, driven by its ability to provide full-body coverage and high-security sealing. Increasing demand from pharma and food industries for authentication, growing adoption of holographic and destructible labels for brand protection, and rising integration of RFID/NFC technologies for enhanced track and trace applications further propel market expansion.

Key Segmentation

By Technology:

  • Pressure-Sensitive Labeling
  • Glue-Applied Labeling
  • Shrink Sleeve Labeling
  • Heat Seal Labeling
  • RFID/NFC-Integrated Labeling

By Label Type:

  • Void Labels
  • Destructible Labels
  • Holographic Labels
  • Shrink Film Labels
  • Seal Tape Labels

By Machine Type:

  • Automatic Labeling Machines
  • Semi-Automatic Labeling Machines
  • Manual Labeling Systems

By Application:

  • Product Authentication
  • Tamper Detection
  • Track and Trace
  • Brand Protection

By End-Use Industry:

  • Pharmaceuticals and Healthcare
  • Food and Beverages
  • Cosmetics and Personal Care
  • Consumer Electronics
  • Industrial Goods
  • Retail

By Region:

  • North America
  • Europe
  • Asia-Pacific
  • Latin America
  • Middle East & Africa

Table of Content

  1. Executive Summary
    • Global Market Outlook
    • Demand-side Trends
    • Supply-side Trends
    • Technology Roadmap Analysis
    • Analysis and Recommendations
  2. Market Overview
    • Market Coverage / Taxonomy
    • Market Definition / Scope / Limitations
  3. Market Background
    • Market Dynamics
      • Drivers
      • Restraints
      • Opportunity
      • Trends
    • Scenario Forecast
      • Demand in Optimistic Scenario
      • Demand in Likely Scenario
      • Demand in Conservative Scenario
    • Opportunity Map Analysis
    • Product Life Cycle Analysis
    • Supply Chain Analysis
      • Supply Side Participants and their Roles
        • Producers
        • Mid-Level Participants (Traders/ Agents/ Brokers)
        • Wholesalers and Distributors
      • Value Added and Value Created at Node in the Supply Chain
      • List of Raw Material Suppliers
      • List of Existing and Potential Buyer’s
    • Investment Feasibility Matrix
    • Value Chain Analysis
      • Profit Margin Analysis
      • Wholesalers and Distributors
      • Retailers
    • PESTLE and Porter’s Analysis
    • Regulatory Landscape
      • By Key Regions
      • By Key Countries
    • Regional Parent Market Outlook
    • Production and Consumption Statistics
    • Import and Export Statistics
  4. Global Market Analysis 2020 to 2024 and Forecast, 2025 to 2035
    • Historical Market Size Value (USD Billion) & Volume (Units) Analysis, 2020 to 2024
    • Current and Future Market Size Value (USD Billion) & Volume (Units) Projections, 2025 to 2035
      • Y-o-Y Growth Trend Analysis
      • Absolute $ Opportunity Analysis
  5. Global Market Analysis 2020 to 2024 and Forecast 2025 to 2035, By Technology
    • Introduction / Key Findings
    • Historical Market Size Value (USD Billion) & Volume (Units) Analysis By Technology, 2020 to 2024
    • Current and Future Market Size Value (USD Billion) & Volume (Units) Analysis and Forecast By Technology, 2025 to 2035
      • Pressure-Sensitive Labeling
      • Glue-Applied Labeling
      • Shrink Sleeve Labeling
      • Heat Seal Labeling
      • RFID/NFC-Integrated Labeling
    • Y-o-Y Growth Trend Analysis By Technology, 2020 to 2024
    • Absolute $ Opportunity Analysis By Technology, 2025 to 2035
  6. Global Market Analysis 2020 to 2024 and Forecast 2025 to 2035, By Label Type
    • Introduction / Key Findings
    • Historical Market Size Value (USD Billion) & Volume (Units) Analysis By Label Type, 2020 to 2024
    • Current and Future Market Size Value (USD Billion) & Volume (Units) Analysis and Forecast By Label Type, 2025 to 2035
      • Void Labels
      • Destructible Labels
      • Holographic Labels
      • Shrink Film Labels
      • Seal Tape Labels
    • Y-o-Y Growth Trend Analysis By Label Type, 2020 to 2024
    • Absolute $ Opportunity Analysis By Label Type, 2025 to 2035
  7. Global Market Analysis 2020 to 2024 and Forecast 2025 to 2035, By Machine Type
    • Introduction / Key Findings
    • Historical Market Size Value (USD Billion) & Volume (Units) Analysis By Machine Type, 2020 to 2024
    • Current and Future Market Size Value (USD Billion) & Volume (Units) Analysis and Forecast By Machine Type, 2025 to 2035
      • Automatic Labeling Machines
      • Semi-Automatic Labeling Machines
      • Manual Labeling Systems
    • Y-o-Y Growth Trend Analysis By Machine Type, 2020 to 2024
    • Absolute $ Opportunity Analysis By Machine Type, 2025 to 2035
  8. Global Market Analysis 2020 to 2024 and Forecast 2025 to 2035, By Application
    • Introduction / Key Findings
    • Historical Market Size Value (USD Billion) & Volume (Units) Analysis By Application, 2020 to 2024
    • Current and Future Market Size Value (USD Billion) & Volume (Units) Analysis and Forecast By Application, 2025 to 2035
      • Product Authentication
      • Tamper Detection
      • Track and Trace
      • Brand Protection
    • Y-o-Y Growth Trend Analysis By Application, 2020 to 2024
    • Absolute $ Opportunity Analysis By Application, 2025 to 2035
  9. Global Market Analysis 2020 to 2024 and Forecast 2025 to 2035, By End-Use Industry
    • Introduction / Key Findings
    • Historical Market Size Value (USD Billion) & Volume (Units) Analysis By End-Use Industry, 2020 to 2024
    • Current and Future Market Size Value (USD Billion) & Volume (Units) Analysis and Forecast By End-Use Industry, 2025 to 2035
      • Pharmaceuticals and Healthcare
      • Food and Beverages
      • Cosmetics and Personal Care
      • Consumer Electronics
      • Industrial Goods
      • Retail
    • Y-o-Y Growth Trend Analysis By End-Use Industry, 2020 to 2024
    • Absolute $ Opportunity Analysis By End-Use Industry, 2025 to 2035
  10. Global Market Analysis 2020 to 2024 and Forecast 2025 to 2035, By Region
    • Introduction
    • Historical Market Size Value (USD Billion) & Volume (Units) Analysis By Region, 2020 to 2024
    • Current Market Size Value (USD Billion) & Volume (Units) Analysis and Forecast By Region, 2025 to 2035
      • North America
      • Latin America
      • East Asia
      • South Asia & Pacific
      • Western Europe
      • Eastern Europe
      • Middle East & Africa
    • Market Attractiveness Analysis By Region
  11. North America Market Analysis 2020 to 2024 and Forecast 2025 to 2035, By Country
    • Historical Market Size Value (USD Billion) & Volume (Units) Trend Analysis By Market Taxonomy, 2020 to 2024
    • Market Size Value (USD Billion) & Volume (Units) Forecast By Market Taxonomy, 2025 to 2035
      • By Country
        • USA
        • Canada
        • Mexico
      • By Technology
      • By Label Type
      • By Machine Type
      • By Application
      • By End-Use Industry
    • Market Attractiveness Analysis
      • By Country
      • By Technology
      • By Label Type
      • By Machine Type
      • By Application
      • By End-Use Industry
    • Key Takeaways
  12. Latin America Market Analysis 2020 to 2024 and Forecast 2025 to 2035, By Country
    • Historical Market Size Value (USD Billion) & Volume (Units) Trend Analysis By Market Taxonomy, 2020 to 2024
    • Market Size Value (USD Billion) & Volume (Units) Forecast By Market Taxonomy, 2025 to 2035
      • By Country
        • Brazil
        • Argentina
        • Rest of Latin America
      • By Technology
      • By Label Type
      • By Machine Type
      • By Application
      • By End-Use Industry
    • Market Attractiveness Analysis
      • By Country
      • By Technology
      • By Label Type
      • By Machine Type
      • By Application
      • By End-Use Industry
    • Key Takeaways
  13. East Asia Market Analysis 2020 to 2024 and Forecast 2025 to 2035, By Country
    • Historical Market Size Value (USD Billion) & Volume (Units) Trend Analysis By Market Taxonomy, 2020 to 2024
    • Market Size Value (USD Billion) & Volume (Units) Forecast By Market Taxonomy, 2025 to 2035
      • By Country
        • China
        • Japan
        • South Korea
      • By Technology
      • By Label Type
      • By Machine Type
      • By Application
      • By End-Use Industry
    • Market Attractiveness Analysis
      • By Country
      • By Technology
      • By Label Type
      • By Machine Type
      • By Application
      • By End-Use Industry
    • Key Takeaways
  14. South Asia & Pacific Market Analysis 2020 to 2024 and Forecast 2025 to 2035, By Country
    • Historical Market Size Value (USD Billion) & Volume (Units) Trend Analysis By Market Taxonomy, 2020 to 2024
    • Market Size Value (USD Billion) & Volume (Units) Forecast By Market Taxonomy, 2025 to 2035
      • By Country
        • India
        • ASEAN Countries
        • Australia& New Zealand
        • Rest of South Asia
      • By Technology
      • By Label Type
      • By Machine Type
      • By Application
      • By End-Use Industry
    • Market Attractiveness Analysis
      • By Country
      • By Technology
      • By Label Type
      • By Machine Type
      • By Application
      • By End-Use Industry
    • Key Takeaways
  15. Western Europe Market Analysis 2020 to 2024 and Forecast 2025 to 2035, By Country
    • Historical Market Size Value (USD Billion) & Volume (Units) Trend Analysis By Market Taxonomy, 2020 to 2024
    • Market Size Value (USD Billion) & Volume (Units) Forecast By Market Taxonomy, 2025 to 2035
      • By Country
        • Germany
        • UK
        • France
        • Italy
        • Spain
        • BENELUX
        • Nordic Countries
        • Rest of Western Europe
      • By Technology
      • By Label Type
      • By Machine Type
      • By Application
      • By End-Use Industry
    • Market Attractiveness Analysis
      • By Country
      • By Technology
      • By Label Type
      • By Machine Type
      • By Application
      • By End-Use Industry
    • Key Takeaways
  16. Eastern Europe Market Analysis 2020 to 2024 and Forecast 2025 to 2035, By Country
    • Historical Market Size Value (USD Billion) & Volume (Units) Trend Analysis By Market Taxonomy, 2020 to 2024
    • Market Size Value (USD Billion) & Volume (Units) Forecast By Market Taxonomy, 2025 to 2035
      • By Country
        • Russia
        • Hungary
        • Poland
        • Rest of Eastern Europe
      • By Technology
      • By Label Type
      • By Machine Type
      • By Application
      • By End-Use Industry
    • Market Attractiveness Analysis
      • By Country
      • By Technology
      • By Label Type
      • By Machine Type
      • By Application
      • By End-Use Industry
    • Key Takeaways
  17. Middle East & Africa Market Analysis 2020 to 2024 and Forecast 2025 to 2035, By Country
    • Historical Market Size Value (USD Billion) & Volume (Units) Trend Analysis By Market Taxonomy, 2020 to 2024
    • Market Size Value (USD Billion) & Volume (Units) Forecast By Market Taxonomy, 2025 to 2035
      • By Country
        • Saudi Arabia
        • Türkiye
        • South Africa
        • Other African Union
        • Rest of Middle East & Africa
      • By Technology
      • By Label Type
      • By Machine Type
      • By Application
      • By End-Use Industry
    • Market Attractiveness Analysis
      • By Country
      • By Technology
      • By Label Type
      • By Machine Type
      • By Application
      • By End-Use Industry
    • Key Takeaways
  18. Key Countries Market Analysis
    • USA
      • Pricing Analysis
      • Market Share Analysis, 2024
        • By Technology
        • By Label Type
        • By Machine Type
        • By Application
        • By End-Use Industry
    • Brazil
      • Pricing Analysis
      • Market Share Analysis, 2024
        • By Technology
        • By Label Type
        • By Machine Type
        • By Application
        • By End-Use Industry
    • China
      • Pricing Analysis
      • Market Share Analysis, 2024
        • By Technology
        • By Label Type
        • By Machine Type
        • By Application
        • By End-Use Industry
    • India
      • Pricing Analysis
      • Market Share Analysis, 2024
        • By Technology
        • By Label Type
        • By Machine Type
        • By Application
        • By End-Use Industry
    • Europe
      • Pricing Analysis
      • Market Share Analysis, 2024
        • By Technology
        • By Label Type
        • By Machine Type
        • By Application
        • By End-Use Industry
    • Germany
      • Pricing Analysis
      • Market Share Analysis, 2024
        • By Technology
        • By Label Type
        • By Machine Type
        • By Application
        • By End-Use Industry
    • France
      • Pricing Analysis
      • Market Share Analysis, 2024
        • By Technology
        • By Label Type
        • By Machine Type
        • By Application
        • By End-Use Industry
    • UK
      • Pricing Analysis
      • Market Share Analysis, 2024
        • By Technology
        • By Label Type
        • By Machine Type
        • By Application
        • By End-Use Industry
  19. Market Structure Analysis
    • Competition Dashboard
    • Competition Benchmarking
    • Market Share Analysis of Top Players
      • By Regional
      • By Technology
      • By Label Type
      • By Machine Type
      • By Application
      • By End-Use Industry
  20. Competition Analysis
    • Competition Deep Dive
      • Siddhivinayak Engineering
        • Overview
        • Product Portfolio
        • Profitability by Market Segments (Product/Age /Sales Channel/Region)
        • Sales Footprint
        • Strategy Overview
          • Marketing Strategy
          • Product Strategy
          • Channel Strategy
      • b + b Automation and Control Technology GmbH.
        • Overview
        • Product Portfolio
        • Profitability by Market Segments (Product/Age /Sales Channel/Region)
        • Sales Footprint
        • Strategy Overview
          • Marketing Strategy
          • Product Strategy
          • Channel Strategy
      • PDC International Corp.
        • Overview
        • Product Portfolio
        • Profitability by Market Segments (Product/Age /Sales Channel/Region)
        • Sales Footprint
        • Strategy Overview
          • Marketing Strategy
          • Product Strategy
          • Channel Strategy
      • Maharshi
        • Overview
        • Product Portfolio
        • Profitability by Market Segments (Product/Age /Sales Channel/Region)
        • Sales Footprint
        • Strategy Overview
          • Marketing Strategy
          • Product Strategy
          • Channel Strategy
      • Jekson Vision
        • Overview
        • Product Portfolio
        • Profitability by Market Segments (Product/Age /Sales Channel/Region)
        • Sales Footprint
        • Strategy Overview
          • Marketing Strategy
          • Product Strategy
          • Channel Strategy
      • CLHSANYOU
        • Overview
        • Product Portfolio
        • Profitability by Market Segments (Product/Age /Sales Channel/Region)
        • Sales Footprint
        • Strategy Overview
          • Marketing Strategy
          • Product Strategy
          • Channel Strategy
      • Interpack Technologies LLP
        • Overview
        • Product Portfolio
        • Profitability by Market Segments (Product/Age /Sales Channel/Region)
        • Sales Footprint
        • Strategy Overview
          • Marketing Strategy
          • Product Strategy
          • Channel Strategy
      • Worldpack Automation Systems
        • Overview
        • Product Portfolio
        • Profitability by Market Segments (Product/Age /Sales Channel/Region)
        • Sales Footprint
        • Strategy Overview
          • Marketing Strategy
          • Product Strategy
          • Channel Strategy
      • Vial Labeller
        • Overview
        • Product Portfolio
        • Profitability by Market Segments (Product/Age /Sales Channel/Region)
        • Sales Footprint
        • Strategy Overview
          • Marketing Strategy
          • Product Strategy
          • Channel Strategy
      • Lodha International LLP
        • Overview
        • Product Portfolio
        • Profitability by Market Segments (Product/Age /Sales Channel/Region)
        • Sales Footprint
        • Strategy Overview
          • Marketing Strategy
          • Product Strategy
          • Channel Strategy
  21. Assumptions & Acronyms Used
  22. Research Methodology

List of Tables

  • Table 1: Global Market Value (USD Billion) Forecast by Region, 2020-2035
  • Table 2: Global Market Volume (Units) Forecast by Region, 2020-2035
  • Table 3: Global Market Value (USD Billion) Forecast by Technology, 2020-2035
  • Table 4: Global Market Volume (Units) Forecast by Technology, 2020-2035
  • Table 5: Global Market Value (USD Billion) Forecast by Label Type, 2020-2035
  • Table 6: Global Market Volume (Units) Forecast by Label Type, 2020-2035
  • Table 7: Global Market Value (USD Billion) Forecast by Machine Type, 2020-2035
  • Table 8: Global Market Volume (Units) Forecast by Machine Type, 2020-2035
  • Table 9: Global Market Value (USD Billion) Forecast by Application, 2020-2035
  • Table 10: Global Market Volume (Units) Forecast by Application, 2020-2035
  • Table 11: Global Market Value (USD Billion) Forecast by End-Use Industry, 2020-2035
  • Table 12: Global Market Volume (Units) Forecast by End-Use Industry, 2020-2035
  • Table 13: North America Market Value (USD Billion) Forecast by Country, 2020-2035
  • Table 14: North America Market Volume (Units) Forecast by Country, 2020-2035
  • Table 15: North America Market Value (USD Billion) Forecast by Technology, 2020-2035
  • Table 16: North America Market Volume (Units) Forecast by Technology, 2020-2035
  • Table 17: North America Market Value (USD Billion) Forecast by Label Type, 2020-2035
  • Table 18: North America Market Volume (Units) Forecast by Label Type, 2020-2035
  • Table 19: North America Market Value (USD Billion) Forecast by Machine Type, 2020-2035
  • Table 20: North America Market Volume (Units) Forecast by Machine Type, 2020-2035
  • Table 21: North America Market Value (USD Billion) Forecast by Application, 2020-2035
  • Table 22: North America Market Volume (Units) Forecast by Application, 2020-2035
  • Table 23: North America Market Value (USD Billion) Forecast by End-Use Industry, 2020-2035
  • Table 24: North America Market Volume (Units) Forecast by End-Use Industry, 2020-2035
  • Table 25: Latin America Market Value (USD Billion) Forecast by Country, 2020-2035
  • Table 26: Latin America Market Volume (Units) Forecast by Country, 2020-2035
  • Table 27: Latin America Market Value (USD Billion) Forecast by Technology, 2020-2035
  • Table 28: Latin America Market Volume (Units) Forecast by Technology, 2020-2035
  • Table 29: Latin America Market Value (USD Billion) Forecast by Label Type, 2020-2035
  • Table 30: Latin America Market Volume (Units) Forecast by Label Type, 2020-2035
  • Table 31: Latin America Market Value (USD Billion) Forecast by Machine Type, 2020-2035
  • Table 32: Latin America Market Volume (Units) Forecast by Machine Type, 2020-2035
  • Table 33: Latin America Market Value (USD Billion) Forecast by Application, 2020-2035
  • Table 34: Latin America Market Volume (Units) Forecast by Application, 2020-2035
  • Table 35: Latin America Market Value (USD Billion) Forecast by End-Use Industry, 2020-2035
  • Table 36: Latin America Market Volume (Units) Forecast by End-Use Industry, 2020-2035
  • Table 37: East Asia Market Value (USD Billion) Forecast by Country, 2020-2035
  • Table 38: East Asia Market Volume (Units) Forecast by Country, 2020-2035
  • Table 39: East Asia Market Value (USD Billion) Forecast by Technology, 2020-2035
  • Table 40: East Asia Market Volume (Units) Forecast by Technology, 2020-2035
  • Table 41: East Asia Market Value (USD Billion) Forecast by Label Type, 2020-2035
  • Table 42: East Asia Market Volume (Units) Forecast by Label Type, 2020-2035
  • Table 43: East Asia Market Value (USD Billion) Forecast by Machine Type, 2020-2035
  • Table 44: East Asia Market Volume (Units) Forecast by Machine Type, 2020-2035
  • Table 45: East Asia Market Value (USD Billion) Forecast by Application, 2020-2035
  • Table 46: East Asia Market Volume (Units) Forecast by Application, 2020-2035
  • Table 47: East Asia Market Value (USD Billion) Forecast by End-Use Industry, 2020-2035
  • Table 48: East Asia Market Volume (Units) Forecast by End-Use Industry, 2020-2035
  • Table 49: South Asia & Pacific Market Value (USD Billion) Forecast by Country, 2020-2035
  • Table 50: South Asia & Pacific Market Volume (Units) Forecast by Country, 2020-2035
  • Table 51: South Asia & Pacific Market Value (USD Billion) Forecast by Technology, 2020-2035
  • Table 52: South Asia & Pacific Market Volume (Units) Forecast by Technology, 2020-2035
  • Table 53: South Asia & Pacific Market Value (USD Billion) Forecast by Label Type, 2020-2035
  • Table 54: South Asia & Pacific Market Volume (Units) Forecast by Label Type, 2020-2035
  • Table 55: South Asia & Pacific Market Value (USD Billion) Forecast by Machine Type, 2020-2035
  • Table 56: South Asia & Pacific Market Volume (Units) Forecast by Machine Type, 2020-2035
  • Table 57: South Asia & Pacific Market Value (USD Billion) Forecast by Application, 2020-2035
  • Table 58: South Asia & Pacific Market Volume (Units) Forecast by Application, 2020-2035
  • Table 59: South Asia & Pacific Market Value (USD Billion) Forecast by End-Use Industry, 2020-2035
  • Table 60: South Asia & Pacific Market Volume (Units) Forecast by End-Use Industry, 2020-2035
  • Table 61: Western Europe Market Value (USD Billion) Forecast by Country, 2020-2035
  • Table 62: Western Europe Market Volume (Units) Forecast by Country, 2020-2035
  • Table 63: Western Europe Market Value (USD Billion) Forecast by Technology, 2020-2035
  • Table 64: Western Europe Market Volume (Units) Forecast by Technology, 2020-2035
  • Table 65: Western Europe Market Value (USD Billion) Forecast by Label Type, 2020-2035
  • Table 66: Western Europe Market Volume (Units) Forecast by Label Type, 2020-2035
  • Table 67: Western Europe Market Value (USD Billion) Forecast by Machine Type, 2020-2035
  • Table 68: Western Europe Market Volume (Units) Forecast by Machine Type, 2020-2035
  • Table 69: Western Europe Market Value (USD Billion) Forecast by Application, 2020-2035
  • Table 70: Western Europe Market Volume (Units) Forecast by Application, 2020-2035
  • Table 71: Western Europe Market Value (USD Billion) Forecast by End-Use Industry, 2020-2035
  • Table 72: Western Europe Market Volume (Units) Forecast by End-Use Industry, 2020-2035
  • Table 73: Eastern Europe  Market Value (USD Billion) Forecast by Country, 2020-2035
  • Table 74: Eastern Europe  Market Volume (Units) Forecast by Country, 2020-2035
  • Table 75: Eastern Europe  Market Value (USD Billion) Forecast by Technology, 2020-2035
  • Table 76: Eastern Europe  Market Volume (Units) Forecast by Technology, 2020-2035
  • Table 77: Eastern Europe  Market Value (USD Billion) Forecast by Label Type, 2020-2035
  • Table 78: Eastern Europe  Market Volume (Units) Forecast by Label Type, 2020-2035
  • Table 79: Eastern Europe  Market Value (USD Billion) Forecast by Machine Type, 2020-2035
  • Table 80: Eastern Europe  Market Volume (Units) Forecast by Machine Type, 2020-2035
  • Table 81: Eastern Europe  Market Value (USD Billion) Forecast by Application, 2020-2035
  • Table 82: Eastern Europe  Market Volume (Units) Forecast by Application, 2020-2035
  • Table 83: Eastern Europe  Market Value (USD Billion) Forecast by End-Use Industry, 2020-2035
  • Table 84: Eastern Europe  Market Volume (Units) Forecast by End-Use Industry, 2020-2035
  • Table 85: Middle East & Africa Market Value (USD Billion) Forecast by Country, 2020-2035
  • Table 86: Middle East & Africa Market Volume (Units) Forecast by Country, 2020-2035
  • Table 87: Middle East & Africa Market Value (USD Billion) Forecast by Technology, 2020-2035
  • Table 88: Middle East & Africa Market Volume (Units) Forecast by Technology, 2020-2035
  • Table 89: Middle East & Africa Market Value (USD Billion) Forecast by Label Type, 2020-2035
  • Table 90: Middle East & Africa Market Volume (Units) Forecast by Label Type, 2020-2035
  • Table 91: Middle East & Africa Market Value (USD Billion) Forecast by Machine Type, 2020-2035
  • Table 92: Middle East & Africa Market Volume (Units) Forecast by Machine Type, 2020-2035
  • Table 93: Middle East & Africa Market Value (USD Billion) Forecast by Application, 2020-2035
  • Table 94: Middle East & Africa Market Volume (Units) Forecast by Application, 2020-2035
  • Table 95: Middle East & Africa Market Value (USD Billion) Forecast by End-Use Industry, 2020-2035
  • Table 96: Middle East & Africa Market Volume (Units) Forecast by End-Use Industry, 2020-2035

List of Figures

  • Figure 1: Global Market Value (USD Billion) by Technology, 2025-2035
  • Figure 2: Global Market Value (USD Billion) by Label Type, 2025-2035
  • Figure 3: Global Market Value (USD Billion) by Machine Type, 2025-2035
  • Figure 4: Global Market Value (USD Billion) by Application, 2025-2035
  • Figure 5: Global Market Value (USD Billion) by End-Use Industry, 2025-2035
  • Figure 6: Global Market Value (USD Billion) by Region, 2025-2035
  • Figure 7: Global Market Value (USD Billion) Analysis by Region, 2020-2035
  • Figure 8: Global Market Volume (Units) Analysis by Region, 2020-2035
  • Figure 9: Global Market Value Share (%) and BPS Analysis by Region, 2025-2035
  • Figure 10: Global Market Y-o-Y Growth (%) Projections by Region, 2025-2035
  • Figure 11: Global Market Value (USD Billion) Analysis by Technology, 2020-2035
  • Figure 12: Global Market Volume (Units) Analysis by Technology, 2020-2035
  • Figure 13: Global Market Value Share (%) and BPS Analysis by Technology, 2025-2035
  • Figure 14: Global Market Y-o-Y Growth (%) Projections by Technology, 2025-2035
  • Figure 15: Global Market Value (USD Billion) Analysis by Label Type, 2020-2035
  • Figure 16: Global Market Volume (Units) Analysis by Label Type, 2020-2035
  • Figure 17: Global Market Value Share (%) and BPS Analysis by Label Type, 2025-2035
  • Figure 18: Global Market Y-o-Y Growth (%) Projections by Label Type, 2025-2035
  • Figure 19: Global Market Value (USD Billion) Analysis by Machine Type, 2020-2035
  • Figure 20: Global Market Volume (Units) Analysis by Machine Type, 2020-2035
  • Figure 21: Global Market Value Share (%) and BPS Analysis by Machine Type, 2025-2035
  • Figure 22: Global Market Y-o-Y Growth (%) Projections by Machine Type, 2025-2035
  • Figure 23: Global Market Value (USD Billion) Analysis by Application, 2020-2035
  • Figure 24: Global Market Volume (Units) Analysis by Application, 2020-2035
  • Figure 25: Global Market Value Share (%) and BPS Analysis by Application, 2025-2035
  • Figure 26: Global Market Y-o-Y Growth (%) Projections by Application, 2025-2035
  • Figure 27: Global Market Value (USD Billion) Analysis by End-Use Industry, 2020-2035
  • Figure 28: Global Market Volume (Units) Analysis by End-Use Industry, 2020-2035
  • Figure 29: Global Market Value Share (%) and BPS Analysis by End-Use Industry, 2025-2035
  • Figure 30: Global Market Y-o-Y Growth (%) Projections by End-Use Industry, 2025-2035
  • Figure 31: Global Market Attractiveness by Technology, 2025-2035
  • Figure 32: Global Market Attractiveness by Label Type, 2025-2035
  • Figure 33: Global Market Attractiveness by Machine Type, 2025-2035
  • Figure 34: Global Market Attractiveness by Application, 2025-2035
  • Figure 35: Global Market Attractiveness by End-Use Industry, 2025-2035
  • Figure 36: Global Market Attractiveness by Region, 2025-2035
  • Figure 37: North America Market Value (USD Billion) by Technology, 2025-2035
  • Figure 38: North America Market Value (USD Billion) by Label Type, 2025-2035
  • Figure 39: North America Market Value (USD Billion) by Machine Type, 2025-2035
  • Figure 40: North America Market Value (USD Billion) by Application, 2025-2035
  • Figure 41: North America Market Value (USD Billion) by End-Use Industry, 2025-2035
  • Figure 42: North America Market Value (USD Billion) by Country, 2025-2035
  • Figure 43: North America Market Value (USD Billion) Analysis by Country, 2020-2035
  • Figure 44: North America Market Volume (Units) Analysis by Country, 2020-2035
  • Figure 45: North America Market Value Share (%) and BPS Analysis by Country, 2025-2035
  • Figure 46: North America Market Y-o-Y Growth (%) Projections by Country, 2025-2035
  • Figure 47: North America Market Value (USD Billion) Analysis by Technology, 2020-2035
  • Figure 48: North America Market Volume (Units) Analysis by Technology, 2020-2035
  • Figure 49: North America Market Value Share (%) and BPS Analysis by Technology, 2025-2035
  • Figure 50: North America Market Y-o-Y Growth (%) Projections by Technology, 2025-2035
  • Figure 51: North America Market Value (USD Billion) Analysis by Label Type, 2020-2035
  • Figure 52: North America Market Volume (Units) Analysis by Label Type, 2020-2035
  • Figure 53: North America Market Value Share (%) and BPS Analysis by Label Type, 2025-2035
  • Figure 54: North America Market Y-o-Y Growth (%) Projections by Label Type, 2025-2035
  • Figure 55: North America Market Value (USD Billion) Analysis by Machine Type, 2020-2035
  • Figure 56: North America Market Volume (Units) Analysis by Machine Type, 2020-2035
  • Figure 57: North America Market Value Share (%) and BPS Analysis by Machine Type, 2025-2035
  • Figure 58: North America Market Y-o-Y Growth (%) Projections by Machine Type, 2025-2035
  • Figure 59: North America Market Value (USD Billion) Analysis by Application, 2020-2035
  • Figure 60: North America Market Volume (Units) Analysis by Application, 2020-2035
  • Figure 61: North America Market Value Share (%) and BPS Analysis by Application, 2025-2035
  • Figure 62: North America Market Y-o-Y Growth (%) Projections by Application, 2025-2035
  • Figure 63: North America Market Value (USD Billion) Analysis by End-Use Industry, 2020-2035
  • Figure 64: North America Market Volume (Units) Analysis by End-Use Industry, 2020-2035
  • Figure 65: North America Market Value Share (%) and BPS Analysis by End-Use Industry, 2025-2035
  • Figure 66: North America Market Y-o-Y Growth (%) Projections by End-Use Industry, 2025-2035
  • Figure 67: North America Market Attractiveness by Technology, 2025-2035
  • Figure 68: North America Market Attractiveness by Label Type, 2025-2035
  • Figure 69: North America Market Attractiveness by Machine Type, 2025-2035
  • Figure 70: North America Market Attractiveness by Application, 2025-2035
  • Figure 71: North America Market Attractiveness by End-Use Industry, 2025-2035
  • Figure 72: North America Market Attractiveness by Country, 2025-2035
  • Figure 73: Latin America Market Value (USD Billion) by Technology, 2025-2035
  • Figure 74: Latin America Market Value (USD Billion) by Label Type, 2025-2035
  • Figure 75: Latin America Market Value (USD Billion) by Machine Type, 2025-2035
  • Figure 76: Latin America Market Value (USD Billion) by Application, 2025-2035
  • Figure 77: Latin America Market Value (USD Billion) by End-Use Industry, 2025-2035
  • Figure 78: Latin America Market Value (USD Billion) by Country, 2025-2035
  • Figure 79: Latin America Market Value (USD Billion) Analysis by Country, 2020-2035
  • Figure 80: Latin America Market Volume (Units) Analysis by Country, 2020-2035
  • Figure 81: Latin America Market Value Share (%) and BPS Analysis by Country, 2025-2035
  • Figure 82: Latin America Market Y-o-Y Growth (%) Projections by Country, 2025-2035
  • Figure 83: Latin America Market Value (USD Billion) Analysis by Technology, 2020-2035
  • Figure 84: Latin America Market Volume (Units) Analysis by Technology, 2020-2035
  • Figure 85: Latin America Market Value Share (%) and BPS Analysis by Technology, 2025-2035
  • Figure 86: Latin America Market Y-o-Y Growth (%) Projections by Technology, 2025-2035
  • Figure 87: Latin America Market Value (USD Billion) Analysis by Label Type, 2020-2035
  • Figure 88: Latin America Market Volume (Units) Analysis by Label Type, 2020-2035
  • Figure 89: Latin America Market Value Share (%) and BPS Analysis by Label Type, 2025-2035
  • Figure 90: Latin America Market Y-o-Y Growth (%) Projections by Label Type, 2025-2035
  • Figure 91: Latin America Market Value (USD Billion) Analysis by Machine Type, 2020-2035
  • Figure 92: Latin America Market Volume (Units) Analysis by Machine Type, 2020-2035
  • Figure 93: Latin America Market Value Share (%) and BPS Analysis by Machine Type, 2025-2035
  • Figure 94: Latin America Market Y-o-Y Growth (%) Projections by Machine Type, 2025-2035
  • Figure 95: Latin America Market Value (USD Billion) Analysis by Application, 2020-2035
  • Figure 96: Latin America Market Volume (Units) Analysis by Application, 2020-2035
  • Figure 97: Latin America Market Value Share (%) and BPS Analysis by Application, 2025-2035
  • Figure 98: Latin America Market Y-o-Y Growth (%) Projections by Application, 2025-2035
  • Figure 99: Latin America Market Value (USD Billion) Analysis by End-Use Industry, 2020-2035
  • Figure 100: Latin America Market Volume (Units) Analysis by End-Use Industry, 2020-2035
  • Figure 101: Latin America Market Value Share (%) and BPS Analysis by End-Use Industry, 2025-2035
  • Figure 102: Latin America Market Y-o-Y Growth (%) Projections by End-Use Industry, 2025-2035
  • Figure 103: Latin America Market Attractiveness by Technology, 2025-2035
  • Figure 104: Latin America Market Attractiveness by Label Type, 2025-2035
  • Figure 105: Latin America Market Attractiveness by Machine Type, 2025-2035
  • Figure 106: Latin America Market Attractiveness by Application, 2025-2035
  • Figure 107: Latin America Market Attractiveness by End-Use Industry, 2025-2035
  • Figure 108: Latin America Market Attractiveness by Country, 2025-2035
  • Figure 109: East Asia Market Value (USD Billion) by Technology, 2025-2035
  • Figure 110: East Asia Market Value (USD Billion) by Label Type, 2025-2035
  • Figure 111: East Asia Market Value (USD Billion) by Machine Type, 2025-2035
  • Figure 112: East Asia Market Value (USD Billion) by Application, 2025-2035
  • Figure 113: East Asia Market Value (USD Billion) by End-Use Industry, 2025-2035
  • Figure 114: East Asia Market Value (USD Billion) by Country, 2025-2035
  • Figure 115: East Asia Market Value (USD Billion) Analysis by Country, 2020-2035
  • Figure 116: East Asia Market Volume (Units) Analysis by Country, 2020-2035
  • Figure 117: East Asia Market Value Share (%) and BPS Analysis by Country, 2025-2035
  • Figure 118: East Asia Market Y-o-Y Growth (%) Projections by Country, 2025-2035
  • Figure 119: East Asia Market Value (USD Billion) Analysis by Technology, 2020-2035
  • Figure 120: East Asia Market Volume (Units) Analysis by Technology, 2020-2035
  • Figure 121: East Asia Market Value Share (%) and BPS Analysis by Technology, 2025-2035
  • Figure 122: East Asia Market Y-o-Y Growth (%) Projections by Technology, 2025-2035
  • Figure 123: East Asia Market Value (USD Billion) Analysis by Label Type, 2020-2035
  • Figure 124: East Asia Market Volume (Units) Analysis by Label Type, 2020-2035
  • Figure 125: East Asia Market Value Share (%) and BPS Analysis by Label Type, 2025-2035
  • Figure 126: East Asia Market Y-o-Y Growth (%) Projections by Label Type, 2025-2035
  • Figure 127: East Asia Market Value (USD Billion) Analysis by Machine Type, 2020-2035
  • Figure 128: East Asia Market Volume (Units) Analysis by Machine Type, 2020-2035
  • Figure 129: East Asia Market Value Share (%) and BPS Analysis by Machine Type, 2025-2035
  • Figure 130: East Asia Market Y-o-Y Growth (%) Projections by Machine Type, 2025-2035
  • Figure 131: East Asia Market Value (USD Billion) Analysis by Application, 2020-2035
  • Figure 132: East Asia Market Volume (Units) Analysis by Application, 2020-2035
  • Figure 133: East Asia Market Value Share (%) and BPS Analysis by Application, 2025-2035
  • Figure 134: East Asia Market Y-o-Y Growth (%) Projections by Application, 2025-2035
  • Figure 135: East Asia Market Value (USD Billion) Analysis by End-Use Industry, 2020-2035
  • Figure 136: East Asia Market Volume (Units) Analysis by End-Use Industry, 2020-2035
  • Figure 137: East Asia Market Value Share (%) and BPS Analysis by End-Use Industry, 2025-2035
  • Figure 138: East Asia Market Y-o-Y Growth (%) Projections by End-Use Industry, 2025-2035
  • Figure 139: East Asia Market Attractiveness by Technology, 2025-2035
  • Figure 140: East Asia Market Attractiveness by Label Type, 2025-2035
  • Figure 141: East Asia Market Attractiveness by Machine Type, 2025-2035
  • Figure 142: East Asia Market Attractiveness by Application, 2025-2035
  • Figure 143: East Asia Market Attractiveness by End-Use Industry, 2025-2035
  • Figure 144: East Asia Market Attractiveness by Country, 2025-2035
  • Figure 145: South Asia & Pacific Market Value (USD Billion) by Technology, 2025-2035
  • Figure 146: South Asia & Pacific Market Value (USD Billion) by Label Type, 2025-2035
  • Figure 147: South Asia & Pacific Market Value (USD Billion) by Machine Type, 2025-2035
  • Figure 148: South Asia & Pacific Market Value (USD Billion) by Application, 2025-2035
  • Figure 149: South Asia & Pacific Market Value (USD Billion) by End-Use Industry, 2025-2035
  • Figure 150: South Asia & Pacific Market Value (USD Billion) by Country, 2025-2035
  • Figure 151: South Asia & Pacific Market Value (USD Billion) Analysis by Country, 2020-2035
  • Figure 152: South Asia & Pacific Market Volume (Units) Analysis by Country, 2020-2035
  • Figure 153: South Asia & Pacific Market Value Share (%) and BPS Analysis by Country, 2025-2035
  • Figure 154: South Asia & Pacific Market Y-o-Y Growth (%) Projections by Country, 2025-2035
  • Figure 155: South Asia & Pacific Market Value (USD Billion) Analysis by Technology, 2020-2035
  • Figure 156: South Asia & Pacific Market Volume (Units) Analysis by Technology, 2020-2035
  • Figure 157: South Asia & Pacific Market Value Share (%) and BPS Analysis by Technology, 2025-2035
  • Figure 158: South Asia & Pacific Market Y-o-Y Growth (%) Projections by Technology, 2025-2035
  • Figure 159: South Asia & Pacific Market Value (USD Billion) Analysis by Label Type, 2020-2035
  • Figure 160: South Asia & Pacific Market Volume (Units) Analysis by Label Type, 2020-2035
  • Figure 161: South Asia & Pacific Market Value Share (%) and BPS Analysis by Label Type, 2025-2035
  • Figure 162: South Asia & Pacific Market Y-o-Y Growth (%) Projections by Label Type, 2025-2035
  • Figure 163: South Asia & Pacific Market Value (USD Billion) Analysis by Machine Type, 2020-2035
  • Figure 164: South Asia & Pacific Market Volume (Units) Analysis by Machine Type, 2020-2035
  • Figure 165: South Asia & Pacific Market Value Share (%) and BPS Analysis by Machine Type, 2025-2035
  • Figure 166: South Asia & Pacific Market Y-o-Y Growth (%) Projections by Machine Type, 2025-2035
  • Figure 167: South Asia & Pacific Market Value (USD Billion) Analysis by Application, 2020-2035
  • Figure 168: South Asia & Pacific Market Volume (Units) Analysis by Application, 2020-2035
  • Figure 169: South Asia & Pacific Market Value Share (%) and BPS Analysis by Application, 2025-2035
  • Figure 170: South Asia & Pacific Market Y-o-Y Growth (%) Projections by Application, 2025-2035
  • Figure 171: South Asia & Pacific Market Value (USD Billion) Analysis by End-Use Industry, 2020-2035
  • Figure 172: South Asia & Pacific Market Volume (Units) Analysis by End-Use Industry, 2020-2035
  • Figure 173: South Asia & Pacific Market Value Share (%) and BPS Analysis by End-Use Industry, 2025-2035
  • Figure 174: South Asia & Pacific Market Y-o-Y Growth (%) Projections by End-Use Industry, 2025-2035
  • Figure 175: South Asia & Pacific Market Attractiveness by Technology, 2025-2035
  • Figure 176: South Asia & Pacific Market Attractiveness by Label Type, 2025-2035
  • Figure 177: South Asia & Pacific Market Attractiveness by Machine Type, 2025-2035
  • Figure 178: South Asia & Pacific Market Attractiveness by Application, 2025-2035
  • Figure 179: South Asia & Pacific Market Attractiveness by End-Use Industry, 2025-2035
  • Figure 180: South Asia & Pacific Market Attractiveness by Country, 2025-2035
  • Figure 181: Western Europe Market Value (USD Billion) by Technology, 2025-2035
  • Figure 182: Western Europe Market Value (USD Billion) by Label Type, 2025-2035
  • Figure 183: Western Europe Market Value (USD Billion) by Machine Type, 2025-2035
  • Figure 184: Western Europe Market Value (USD Billion) by Application, 2025-2035
  • Figure 185: Western Europe Market Value (USD Billion) by End-Use Industry, 2025-2035
  • Figure 186: Western Europe Market Value (USD Billion) by Country, 2025-2035
  • Figure 187: Western Europe Market Value (USD Billion) Analysis by Country, 2020-2035
  • Figure 188: Western Europe Market Volume (Units) Analysis by Country, 2020-2035
  • Figure 189: Western Europe Market Value Share (%) and BPS Analysis by Country, 2025-2035
  • Figure 190: Western Europe Market Y-o-Y Growth (%) Projections by Country, 2025-2035
  • Figure 191: Western Europe Market Value (USD Billion) Analysis by Technology, 2020-2035
  • Figure 192: Western Europe Market Volume (Units) Analysis by Technology, 2020-2035
  • Figure 193: Western Europe Market Value Share (%) and BPS Analysis by Technology, 2025-2035
  • Figure 194: Western Europe Market Y-o-Y Growth (%) Projections by Technology, 2025-2035
  • Figure 195: Western Europe Market Value (USD Billion) Analysis by Label Type, 2020-2035
  • Figure 196: Western Europe Market Volume (Units) Analysis by Label Type, 2020-2035
  • Figure 197: Western Europe Market Value Share (%) and BPS Analysis by Label Type, 2025-2035
  • Figure 198: Western Europe Market Y-o-Y Growth (%) Projections by Label Type, 2025-2035
  • Figure 199: Western Europe Market Value (USD Billion) Analysis by Machine Type, 2020-2035
  • Figure 200: Western Europe Market Volume (Units) Analysis by Machine Type, 2020-2035
  • Figure 201: Western Europe Market Value Share (%) and BPS Analysis by Machine Type, 2025-2035
  • Figure 202: Western Europe Market Y-o-Y Growth (%) Projections by Machine Type, 2025-2035
  • Figure 203: Western Europe Market Value (USD Billion) Analysis by Application, 2020-2035
  • Figure 204: Western Europe Market Volume (Units) Analysis by Application, 2020-2035
  • Figure 205: Western Europe Market Value Share (%) and BPS Analysis by Application, 2025-2035
  • Figure 206: Western Europe Market Y-o-Y Growth (%) Projections by Application, 2025-2035
  • Figure 207: Western Europe Market Value (USD Billion) Analysis by End-Use Industry, 2020-2035
  • Figure 208: Western Europe Market Volume (Units) Analysis by End-Use Industry, 2020-2035
  • Figure 209: Western Europe Market Value Share (%) and BPS Analysis by End-Use Industry, 2025-2035
  • Figure 210: Western Europe Market Y-o-Y Growth (%) Projections by End-Use Industry, 2025-2035
  • Figure 211: Western Europe Market Attractiveness by Technology, 2025-2035
  • Figure 212: Western Europe Market Attractiveness by Label Type, 2025-2035
  • Figure 213: Western Europe Market Attractiveness by Machine Type, 2025-2035
  • Figure 214: Western Europe Market Attractiveness by Application, 2025-2035
  • Figure 215: Western Europe Market Attractiveness by End-Use Industry, 2025-2035
  • Figure 216: Western Europe Market Attractiveness by Country, 2025-2035
  • Figure 217: Eastern Europe  Market Value (USD Billion) by Technology, 2025-2035
  • Figure 218: Eastern Europe  Market Value (USD Billion) by Label Type, 2025-2035
  • Figure 219: Eastern Europe  Market Value (USD Billion) by Machine Type, 2025-2035
  • Figure 220: Eastern Europe  Market Value (USD Billion) by Application, 2025-2035
  • Figure 221: Eastern Europe  Market Value (USD Billion) by End-Use Industry, 2025-2035
  • Figure 222: Eastern Europe  Market Value (USD Billion) by Country, 2025-2035
  • Figure 223: Eastern Europe  Market Value (USD Billion) Analysis by Country, 2020-2035
  • Figure 224: Eastern Europe  Market Volume (Units) Analysis by Country, 2020-2035
  • Figure 225: Eastern Europe  Market Value Share (%) and BPS Analysis by Country, 2025-2035
  • Figure 226: Eastern Europe  Market Y-o-Y Growth (%) Projections by Country, 2025-2035
  • Figure 227: Eastern Europe  Market Value (USD Billion) Analysis by Technology, 2020-2035
  • Figure 228: Eastern Europe  Market Volume (Units) Analysis by Technology, 2020-2035
  • Figure 229: Eastern Europe  Market Value Share (%) and BPS Analysis by Technology, 2025-2035
  • Figure 230: Eastern Europe  Market Y-o-Y Growth (%) Projections by Technology, 2025-2035
  • Figure 231: Eastern Europe  Market Value (USD Billion) Analysis by Label Type, 2020-2035
  • Figure 232: Eastern Europe  Market Volume (Units) Analysis by Label Type, 2020-2035
  • Figure 233: Eastern Europe  Market Value Share (%) and BPS Analysis by Label Type, 2025-2035
  • Figure 234: Eastern Europe  Market Y-o-Y Growth (%) Projections by Label Type, 2025-2035
  • Figure 235: Eastern Europe  Market Value (USD Billion) Analysis by Machine Type, 2020-2035
  • Figure 236: Eastern Europe  Market Volume (Units) Analysis by Machine Type, 2020-2035
  • Figure 237: Eastern Europe  Market Value Share (%) and BPS Analysis by Machine Type, 2025-2035
  • Figure 238: Eastern Europe  Market Y-o-Y Growth (%) Projections by Machine Type, 2025-2035
  • Figure 239: Eastern Europe  Market Value (USD Billion) Analysis by Application, 2020-2035
  • Figure 240: Eastern Europe  Market Volume (Units) Analysis by Application, 2020-2035
  • Figure 241: Eastern Europe  Market Value Share (%) and BPS Analysis by Application, 2025-2035
  • Figure 242: Eastern Europe  Market Y-o-Y Growth (%) Projections by Application, 2025-2035
  • Figure 243: Eastern Europe  Market Value (USD Billion) Analysis by End-Use Industry, 2020-2035
  • Figure 244: Eastern Europe  Market Volume (Units) Analysis by End-Use Industry, 2020-2035
  • Figure 245: Eastern Europe  Market Value Share (%) and BPS Analysis by End-Use Industry, 2025-2035
  • Figure 246: Eastern Europe  Market Y-o-Y Growth (%) Projections by End-Use Industry, 2025-2035
  • Figure 247: Eastern Europe  Market Attractiveness by Technology, 2025-2035
  • Figure 248: Eastern Europe  Market Attractiveness by Label Type, 2025-2035
  • Figure 249: Eastern Europe  Market Attractiveness by Machine Type, 2025-2035
  • Figure 250: Eastern Europe  Market Attractiveness by Application, 2025-2035
  • Figure 251: Eastern Europe  Market Attractiveness by End-Use Industry, 2025-2035
  • Figure 252: Eastern Europe  Market Attractiveness by Country, 2025-2035
  • Figure 253: Middle East & Africa Market Value (USD Billion) by Technology, 2025-2035
  • Figure 254: Middle East & Africa Market Value (USD Billion) by Label Type, 2025-2035
  • Figure 255: Middle East & Africa Market Value (USD Billion) by Machine Type, 2025-2035
  • Figure 256: Middle East & Africa Market Value (USD Billion) by Application, 2025-2035
  • Figure 257: Middle East & Africa Market Value (USD Billion) by End-Use Industry, 2025-2035
  • Figure 258: Middle East & Africa Market Value (USD Billion) by Country, 2025-2035
  • Figure 259: Middle East & Africa Market Value (USD Billion) Analysis by Country, 2020-2035
  • Figure 260: Middle East & Africa Market Volume (Units) Analysis by Country, 2020-2035
  • Figure 261: Middle East & Africa Market Value Share (%) and BPS Analysis by Country, 2025-2035
  • Figure 262: Middle East & Africa Market Y-o-Y Growth (%) Projections by Country, 2025-2035
  • Figure 263: Middle East & Africa Market Value (USD Billion) Analysis by Technology, 2020-2035
  • Figure 264: Middle East & Africa Market Volume (Units) Analysis by Technology, 2020-2035
  • Figure 265: Middle East & Africa Market Value Share (%) and BPS Analysis by Technology, 2025-2035
  • Figure 266: Middle East & Africa Market Y-o-Y Growth (%) Projections by Technology, 2025-2035
  • Figure 267: Middle East & Africa Market Value (USD Billion) Analysis by Label Type, 2020-2035
  • Figure 268: Middle East & Africa Market Volume (Units) Analysis by Label Type, 2020-2035
  • Figure 269: Middle East & Africa Market Value Share (%) and BPS Analysis by Label Type, 2025-2035
  • Figure 270: Middle East & Africa Market Y-o-Y Growth (%) Projections by Label Type, 2025-2035
  • Figure 271: Middle East & Africa Market Value (USD Billion) Analysis by Machine Type, 2020-2035
  • Figure 272: Middle East & Africa Market Volume (Units) Analysis by Machine Type, 2020-2035
  • Figure 273: Middle East & Africa Market Value Share (%) and BPS Analysis by Machine Type, 2025-2035
  • Figure 274: Middle East & Africa Market Y-o-Y Growth (%) Projections by Machine Type, 2025-2035
  • Figure 275: Middle East & Africa Market Value (USD Billion) Analysis by Application, 2020-2035
  • Figure 276: Middle East & Africa Market Volume (Units) Analysis by Application, 2020-2035
  • Figure 277: Middle East & Africa Market Value Share (%) and BPS Analysis by Application, 2025-2035
  • Figure 278: Middle East & Africa Market Y-o-Y Growth (%) Projections by Application, 2025-2035
  • Figure 279: Middle East & Africa Market Value (USD Billion) Analysis by End-Use Industry, 2020-2035
  • Figure 280: Middle East & Africa Market Volume (Units) Analysis by End-Use Industry, 2020-2035
  • Figure 281: Middle East & Africa Market Value Share (%) and BPS Analysis by End-Use Industry, 2025-2035
  • Figure 282: Middle East & Africa Market Y-o-Y Growth (%) Projections by End-Use Industry, 2025-2035
  • Figure 283: Middle East & Africa Market Attractiveness by Technology, 2025-2035
  • Figure 284: Middle East & Africa Market Attractiveness by Label Type, 2025-2035
  • Figure 285: Middle East & Africa Market Attractiveness by Machine Type, 2025-2035
  • Figure 286: Middle East & Africa Market Attractiveness by Application, 2025-2035
  • Figure 287: Middle East & Africa Market Attractiveness by End-Use Industry, 2025-2035
  • Figure 288: Middle East & Africa Market Attractiveness by Country, 2025-2035

Frequently Asked Questions

How big is the tamper evident labeler market in 2025?

The global tamper evident labeler market is estimated to be valued at USD 2.6 billion in 2025.

What will be the size of the tamper evident labeler market in 2035?

The market size for the tamper evident labeler market is projected to reach USD 4.1 billion by 2035.

How much will be the tamper evident labeler market growth between 2025 and 2035?

The tamper evident labeler market is expected to grow at a CAGR of 4.7% between 2025 and 2035.

What are the key technologies in the tamper evident labeler market?

The key technologies in the tamper evident labeler market include pressure-sensitive labeling, glue-applied labeling, shrink sleeve labeling, heat seal labeling, and RFID/NFC-integrated labeling.

Which technology segment is expected to contribute significant share in the tamper evident labeler market in 2025?

Shrink sleeve labeling is expected to hold a significant share of 33.4% in 2025.

Explore Similar Insights

Future Market Insights

Tamper Evident Labeler Market

Chat With

MaRIA

Hi There, I am MaRIA, Your Market Research Intelligence Assistant. How may I help you?