

- Market Size (2026)
- USD 980.7 Mn
- Forecast (2036)
- USD 1723.4 Mn
- CAGR (2026 to 2036)
- 5.8%
How big is the telescopic way covers market size?
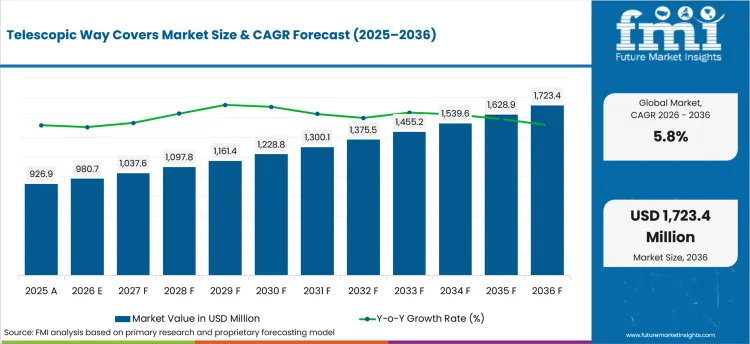
USD 980.7 million in 2026 and USD 1,723.4 million by 2036 at a 5.8% CAGR.
Sales in telescopic way covers market are projected to grow at 5.8% CAGR through 2036, driving valuation to USD 1,723.4 million by 2036 from USD 980.7 million in 2026. Machine builders are expected to screen cover systems through axis protection and coolant exposure. International Federation of Robotics reported on September 25, 2025 industrial robot installations reached 542,000 units in 2024 as automated equipment needed protected linear motion.
India and China buyers are expected to review local fabrication access and service-led sampling needs. Germany and Japan buyer teams are anticipated to favor machine-builder documents and qualified repair channels. Association for Manufacturing Technology reported on May 11, 2026 first-quarter manufacturing technology orders were 27.8% above year-earlier levels as machine orders lifted requirements for covers linked with equipment builds.
| Metric | Value |
|---|---|
| 2025 Market Size | USD 926.9 million |
| 2026 Market Size | USD 980.7 million |
| 2036 Market Size | USD 1,723.4 million |
| Forecast CAGR (2026-2036) | 5.8% |
| Leading Cover Type | Steel Telescopic Covers |
| Steel Telescopic Covers Share (2026) | 42.0% |
| Leading Machine Type | CNC Machining Centers |
| CNC Machining Centers Share (2026) | 38.0% |
| Leading Material Type | Carbon Steel |
| Carbon Steel Share (2026) | 36.6% |
| Fastest-growing Country | India |
| India CAGR by 2036 | 7.6% |
Summary of the Telescopic Way Covers Market
| Market Signal | Commercial Impact |
|---|---|
| Demand and Growth Drivers | Demand for telescopic way covers is expected to improve as machine builders protect precision guideways from chips and coolant. Buyer teams are projected to connect cover choice with downtime control and maintenance planning.
|
| Product and Segment View | Segment demand is led by steel cover formats followed by CNC machining centers and carbon steel structures requiring validated machine protection. Specification work is expected to concentrate on supplier-controlled cover designs aligned with coolant exposure and moving-axis protection.
|
| Geography and Growth Outlook | Country demand is expected to vary with machine tool order cycles and local service availability. Supplier gains are likely to reflect machine-builder approvals and repair-channel access.
|
| Competitive View | Competition is expected to focus on cover durability and field support. Account outcomes are likely to favor suppliers pairing engineering files with repair service and machine-specific design support.
|
| Analyst Perspective | Telescopic way covers are developing into a protection-led machine accessory segment connected to guideway life and repair readiness. Supplier progress is projected to improve through technical proof and repeatable customization aligned with precision machinery requirements.
- Nikhil Kaitwade, Principal Consultant for Industrial Automation at Future Market Insights |
Source: Future Market Insights analysis, 2026.
How is the telescopic way covers market segmented?
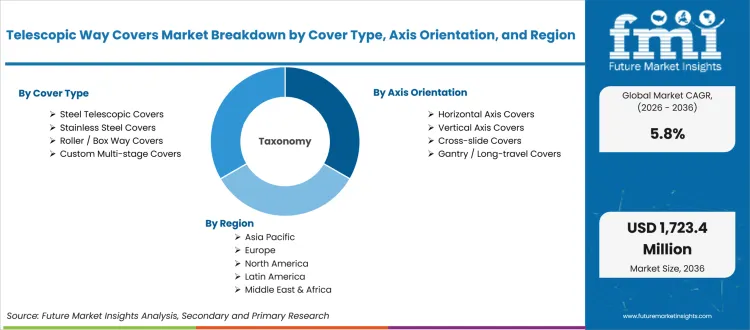
The telescopic way covers market is segmented by cover type, material type, axis orientation, machine type, sales channel, and region.
The telescopic way covers industry is segmented by cover type, material type, axis orientation, machine type, sales channel, and region. Cover type coverage includes steel telescopic covers, stainless steel covers, roller and box way covers, custom multi-stage covers, and heavy-duty slat covers. Material type coverage includes carbon steel, stainless steel, aluminum, composite polymer, and hybrid metal-composite structures. Axis orientation coverage includes horizontal axis covers, vertical axis covers, cross-slide covers, gantry and long-travel covers, and multi-axis covers. Machine type coverage includes CNC machining centers, turning centers, grinding machines, special purpose machines, and laser or fabrication machines. Sales channel coverage includes machine tool OEMs, aftermarket replacement, rebuilders and service shops, industrial distributors, and direct engineering support. Regional coverage includes North America, Latin America, Europe, East Asia, South Asia and Pacific, and Middle East and Africa.
How do steel telescopic covers support cover type demand?
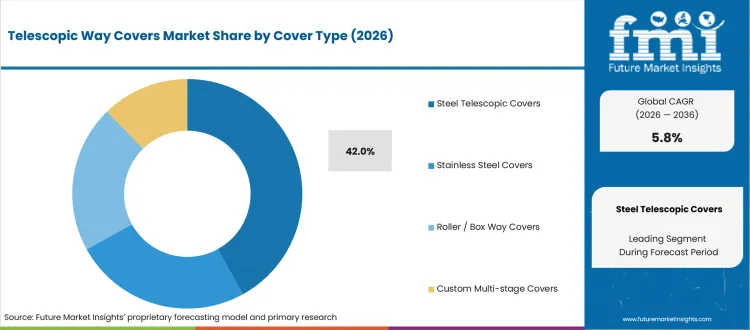
Steel telescopic covers are expected to guide cover type demand as metal cutting machines need rigid shielding. HEMA stated in its April 2025 production-machine catalog GLADIATOR covers may reach 5 m width and extension lengths above 15 m, supporting long-travel machine protection without forcing format changes.
- Steel telescopic covers are projected to account for 42.0% share in 2026, aided by chip-load resistance and routine use across machining centers. Buyers are likely to prefer steel formats once guideway protection and cover repair access affect equipment uptime.
- Stainless steel covers and roller or box way covers remain useful for special environments and compact machine layouts. Steel telescopic covers are anticipated to receive priority once buyers need proven shielding and replacement familiarity.
How does carbon steel support material type selection?
Carbon steel is expected to support material type selection through strength and established fabrication routes. HEMA reported in April 2025 GLADIATOR covers use cold-rolled sheet steel with 1.5 mm to 3 mm thickness, helping buyers compare strength and serviceability before approval.
- Carbon steel is estimated to account for 36.6% share in 2026, helped by strength requirements and established forming practices. Buyer teams are projected to favor carbon steel covers once durability and repair planning guide sourcing decisions.
- Stainless steel and aluminum formats are anticipated to serve corrosive or weight-sensitive applications. Carbon steel is likely to retain preference across standard machine tool protection needs requiring dependable shielding.
How do horizontal axis covers shape axis orientation purchasing?
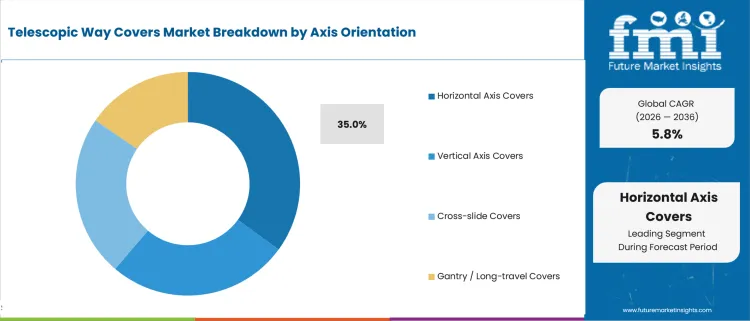
Horizontal axis covers are projected to shape purchasing as machining centers need coordinated extension and chip control across frequent slide movements. HEMA reported in April 2025 telescopic steel covers support four installation orientations, helping designers match cover geometry with machine travel and service access.
- Horizontal axis covers are expected to capture 35.0% share in 2026, guided by recurring use on machining centers and turning platforms. Buyer teams are likely to evaluate cover stroke and sealing performance before supplier approval.
- Vertical axis covers and cross-slide covers are anticipated to serve machine-specific protection needs. Horizontal axis covers are expected to stay under close review once chip exposure and slideway travel drive replacement frequency.
Why do CNC machining centers influence machine type demand?
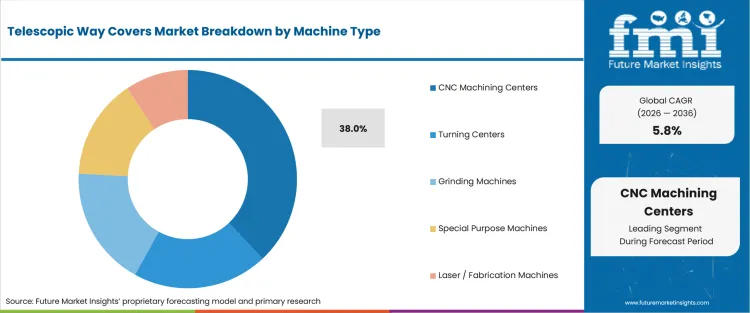
CNC machining centers are estimated to support machine type demand as high-speed cutting raises guideway protection needs across production cells. HEMA reported in April 2025 scissor systems are installed for telescopic cover travel speeds above 30 m per minute, supporting machine types needing controlled cover movement.
- CNC machining centers are anticipated to hold 38.0% share in 2026, led by repeat cutting cycles and coolant exposure. Machine builders are expected to approve covers after movement smoothness and wiper performance are reviewed.
- Turning centers and grinding machines need different cover geometries. CNC machining centers are likely to receive deeper buyer review once multi-axis motion and chip handling raise protection needs.
How do machine tool OEMs support sales channel demand?
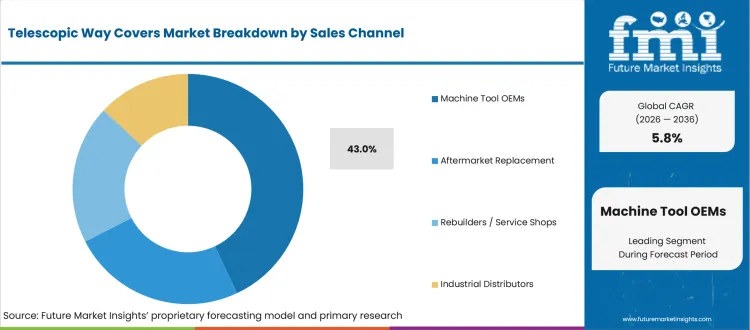
Machine tool OEMs are expected to support sales channel demand as cover selection often enters design approval and factory assembly. Association for Manufacturing Technology reported on February 9, 2026 total 2025 orders were 22.5% above 2024, supporting OEM-linked cover review for new equipment programs.
- Machine tool OEMs are projected to account for 43.0% share in 2026, backed by early specification influence and repeat production programs. Suppliers are likely to gain access once cover movement and service files match machine build requirements.
- Aftermarket replacement and rebuilders remain useful for installed-base service. OEM channels are expected to influence recurring demand once original cover designs guide later repair and replacement decisions.
What are the drivers, restraints, and opportunities in the telescopic way covers market?
Near-term purchases are shaped by machine uptime and service-led replacement needs outlined below.
- Driver: Machine builders are adopting validated way cover systems to protect guideways and linear motion parts during automated cutting cycles.
- Restraint: Adoption slows if cover stroke or repair responsibility remains unclear during machine approval.
- Opportunity: Suppliers offering engineered cover designs with field repair and replacement documents improve approval chances across machine tool accounts.
Demand is expected to improve as automated equipment expands across industrial production. International Federation of Robotics reported on September 25, 2025 Asia represented 74% of new industrial robot deployments in 2024 as manufacturers added equipment needing protected motion systems.
Qualification delays are anticipated to persist as guarding reviews expose incomplete service records. Occupational Safety and Health Administration listed Machine Guarding as the No. 10 cited standard in fiscal 2025 on April 15, 2026, leading buyer teams expecting to request clearer cover documents.
Opportunity improves as manufacturers fund equipment replacement and machining capacity upgrades. Association for Manufacturing Technology reported on May 11, 2026 March 2026 manufacturing technology orders were 31.5% above March 2025 and suppliers gain more cover trials linked with equipment builds.
What country CAGRs are profiled in the telescopic way covers market?
.webp "Top Country Growth Comparison Telescopic Way Covers Market Cagr (2026 2036)")
| Country | CAGR |
|---|---|
| Japan | 4.2% |
| Germany | 4.5% |
| United States | 4.8% |
| Italy | 5.4% |
| South Korea | 5.5% |
| China | 6.9% |
| India | 7.6% |
Source: Future Market Insights, 2026.
How do country-level CAGRs compare in the telescopic way covers market?
Country demand in telescopic way covers is expected to be guided by machine tool order cycles and repair approval requirements. India and China are likely to connect demand with manufacturing expansion and local machine-building activity. South Korea and Italy are anticipated to connect adoption with automation-linked machine protection and export-led equipment programs. United States, Germany, and Japan are projected to connect demand with replacement orders and documentation-led supplier validation.
- India telescopic way covers demand is likely to be influenced by local manufacturing activity and expanding cover service needs. Demand in India is projected to grow at 7.6% CAGR through 2036, reflected by production-line expansion and local machine-builder requirements. Ministry of Statistics and Programme Implementation reported in its June 1, 2026 release manufacturing output increased 6.2% in April 2026. Production activity keeps cover approval close to machine uptime and service access. Local suppliers are estimated to gain account attention through faster sampling cycles and consistent repair support.
- China telescopic way covers demand is projected to be influenced by automation equipment output and domestic machine tool activity. State Council Information Office reported in its January 19, 2026 release industrial robot value-added output increased 28.0% in 2025. Sales in China are forecast to expand at 6.9% CAGR from 2026 to 2036, backed by automated cell adoption and local component supply. Automation depth makes cover qualification important as poor shielding may affect recurring machine performance. Domestic suppliers are expected to receive review strength once cover drawings and replenishment discipline match machine-builder schedules.
- Industry in South Korea is anticipated to scale at 5.5% CAGR over the forecast period, propelled by automation intensity and precision manufacturing exposure. South Korea cover purchasing is estimated to be guided by robot-linked machining lines and compact production layouts. International Federation of Robotics reported in its September 25, 2025 release industrial sites installed 30,600 robots in 2024. Automation scale keeps machine protection evidence important for buyers managing downtime and replacement cycles. Supplier progress is likely to improve through documented fit checks and clear service responsibility.
- Italy buyers are expected to favor suppliers supporting machine-builder specification work and export-oriented equipment programs. UCIMU reported in its April 28, 2026 release first-quarter 2026 machine tool orders rose 3.1% against year-earlier levels, reinforcing demand for covers suited to approved machine designs. Adoption in Italy is predicted to rise at 5.4% CAGR by 2036, aided by equipment orders and cover specification review. Cover suppliers are likely to gain acceptance through repairable designs and reliable drawing support.
- United States telescopic way covers purchasing is anticipated to be shaped by replacement demand and equipment-order recovery. Demand in the United States is expected to scale at 4.8% CAGR during the assessment period, guided by machining investment and aftermarket replacement needs. Association for Manufacturing Technology reported in its February 9, 2026 release December 2025 orders grew 86.7% from November. Equipment purchasing depth keeps replacement way covers important for machine shops managing uptime. Account teams are likely to require fit evidence and service files before recurring orders move to new suppliers.
- Germany is estimated to expand at 4.5% CAGR between 2026 and 2036, reinforced by cautious supplier review and documentation-led cover approval. German account teams are expected to review cover drawings and repair responsibility carefully before replacing established machine protection parts. VDW reported in its May 21, 2025 release orders received in first quarter 2025 were 10% lower year over year. Softer order conditions support disciplined review across replacement and rebuild programs. Supplier selection is expected to favor tested cover systems and consistent documentation.
- Japan keeps telescopic way covers demand close to precision machining and long approval cycles. Japan Machine Tool Builders Association reported in its February 3, 2026 release machine tool orders increased 8.0% in 2025. Controlled order recovery is anticipated to keep supplier selection centered on low failure risk and repeat-cover consistency. Japanese machine shops are likely to avoid quick supplier changes unless sample quality and evidence files stay stable. Sector in Japan is projected to post 4.2% CAGR during the forecast period, shaped by qualification depth and precision facility replacement needs.
Who are the notable companies in the telescopic way covers market?
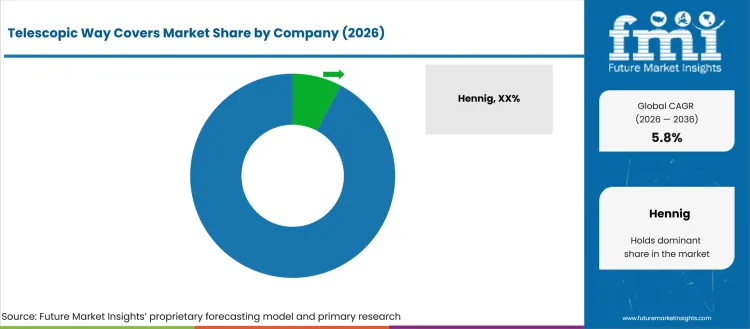
Notable companies include Hennig, Dynatect Manufacturing, HEMA, Sermeto Hennig France, PEI Group, Tecnimetal, Arno Arnold, Bellowstech, Shaver Industries, and TSUBAKI KABELSCHLEPP. Competition is expected to reflect cover application engineering and installed-base replacement access.
Machine tool protection specialists are anticipated to compete b replacement support and repair knowledge. Hennig, Dynatect Manufacturing, HEMA, and Sermeto Hennig France are likely to receive attention from machine builders needing proven steel cover performance and drawing support.
Precision cover and accessory groups are projected to compete through custom machine geometry, compact space handling, and engineering support. PEI Group, Tecnimetal, Arno Arnold, and Bellowstech are expected to serve buyers needing special cover assemblies and technical review.
Regional service and channel partners are likely to support aftermarket demand through replacement guidance, spare-part access, and local troubleshooting. Shaver Industries and TSUBAKI KABELSCHLEPP are expected to gain review in accounts needing service continuity and adjacent machine protection support.
Competitive Benchmarking: Telescopic Way Covers Market
| Company | Portfolio Depth | Cover Format Alignment | Application Support | Service Reach |
|---|---|---|---|---|
| Hennig | High | High | High | Regional/Global |
| Dynatect Manufacturing | High | High | High | Regional/Global |
| HEMA | High | High | Medium | Regional/Global |
| Sermeto Hennig France | Medium | High | Medium | Regional |
| PEI Group | Medium | High | High | Regional/Global |
| Tecnimetal | Medium | High | Medium | Regional |
| Arno Arnold | Medium | Medium | High | Regional/Global |
| Bellowstech | Medium | Medium | Medium | Regional |
| Shaver Industries | Medium | Medium | Medium | Regional |
| TSUBAKI KABELSCHLEPP | High | Medium | High | Global |
Source: Future Market Insights competitive analysis, 2026.
Key Developments in the Telescopic Way Covers Market
- In April 2025, HEMA issued its production-machine protection program covering GLADIATOR telescopic steel covers. HEMA stated in April 2025 GLADIATOR covers may extend above 15 m, supporting long-travel machine protection and large-axis design review.
- In September 2025, Hennig reported placement on the 2025 INC5000 list amid renewed USA manufacturing investment. Hennig stated on September 10, 2025 its three-year growth reached 239.38%, improving buyer confidence around capacity and service depth.
- In October 2025, Dynatect Manufacturing announced a USA patent for a powered roll-up door system awarded in May 2025. Dynatect stated on October 16, 2025 the award marked its fifth patent since 2020, supporting engineered protection capability across machine safety and motion products.
Key Players in the Telescopic Way Covers Market
Machine tool protection and way cover specialists
- Hennig
- Dynatect Manufacturing
- HEMA
- Sermeto Hennig France
Precision cover and accessory specialists
- PEI Group
- Tecnimetal
- Arno Arnold
- Bellowstech
Regional service and protection suppliers
- Shaver Industries
- TSUBAKI KABELSCHLEPP
Telescopic Way Covers Market - Report Scope
| Coverage field | Report scope |
|---|---|
| Market breakdown | Telescopic way covers market breakdown by cover type, material type, axis orientation, machine type, sales channel, and region. |
| Market Definition | Telescopic way covers are segmented metal or hybrid protection assemblies designed to shield machine guideways, ball screws, linear rails, and moving machine components from chips, coolant, debris, and mechanical damage. |
| Core Applications | CNC machining centers, turning centers, grinding machines, special purpose machines, laser machines, fabrication equipment, and precision production systems. |
| Regions Covered | North America, Latin America, Europe, East Asia, South Asia and Pacific, and Middle East and Africa. |
| Countries Covered | United States, Canada, Brazil, Mexico, Germany, United Kingdom, France, Italy, Spain, China, Japan, South Korea, India, ASEAN, Australia and New Zealand, GCC countries, South Africa, and Türkiye. |
| Key Companies Profiled | Hennig, Dynatect Manufacturing, HEMA, Sermeto Hennig France, PEI Group, Tecnimetal, Arno Arnold, Bellowstech, Shaver Industries, and TSUBAKI KABELSCHLEPP. |
| Forecast Period | 2026 to 2036. |
| Primary Methodology | Future Market Insights analysis using supplier interviews, buyer discussions, product portfolio review, country demand scoring, and segment-level forecast modeling. |
Source: Future Market Insights competitive analysis, 2026.
Telescopic Way Covers Market - Research Methodology
| Method | Approach |
|---|---|
| Primary Research | Primary interviews covered machine builders, automation OEMs, maintenance teams, component distributors, rebuilders, cover suppliers, service shops, and precision equipment manufacturers. Discussions focused on cover stroke, chip exposure, coolant resistance, wiper life, repair timing, document depth, and repeat-order readiness. |
| Desk Research | Desk research reviewed official machine tool order releases, robot installation data, company development pages, and machine protection product information. |
| Market Sizing and Forecasting | Market sizing used a hybrid model across segment mix, country CAGR, machine tool exposure, automation-linked replacement, OEM participation, aftermarket service depth, and supplier coverage across telescopic way covers. |
| Data Validation | Data validation compared segment shares, country CAGRs, company alignment, and official source signals to reduce unsupported claims and unrelated industrial component leakage. |
Source: Future Market Insights analysis, 2026.
Telescopic Way Covers Market by Segments
Telescopic Way Covers Market segmented by Cover Type:
- Steel telescopic covers
- Stainless steel covers
- Roller and box way covers
- Custom multi-stage covers
- Heavy-duty slat covers
Telescopic Way Covers Market segmented by Material Type:
- Carbon steel
- Stainless steel
- Aluminum
- Composite polymer
- Hybrid metal-composite structures
Telescopic Way Covers Market segmented by Axis Orientation:
- Horizontal axis covers
- Vertical axis covers
- Cross-slide covers
- Gantry and long-travel covers
- Multi-axis covers
Telescopic Way Covers Market segmented by Machine Type:
- CNC machining centers
- Turning centers
- Grinding machines
- Special purpose machines
- Laser and fabrication machines
Telescopic Way Covers Market segmented by Sales Channel:
- Machine tool OEMs
- Aftermarket replacement
- Rebuilders and service shops
- Industrial distributors
- Direct engineering support
Telescopic Way Covers Market segmented by Region:
- North America
- Latin America
- Europe
- East Asia
- South Asia and Pacific
- Middle East and Africa
Telescopic Way Covers Market by Region:
- North America
- United States
- Canada
- Latin America
- Brazil
- Mexico
- Argentina
- Europe
- Germany
- United Kingdom
- France
- Italy
- Spain
- East Asia
- China
- Japan
- South Korea
- South Asia and Pacific
- India
- ASEAN
- Australia and New Zealand
- Middle East and Africa
- GCC countries
- South Africa
- Türkiye
Research Sources and Bibliography
- AMT - The Association For Manufacturing Technology. (2026, February 9). Manufacturing technology orders set record in December 2025.
- AMT - The Association For Manufacturing Technology. (2026, May 11). Machinery orders continue rally in first quarter 2026 amid uncertainty.
- Dynatect Manufacturing, Inc. (2025, October 16). Dynatect awarded patent for powered roll-up door system.
- HEMA Maschinen- und Apparateschutz. (2025, April 16). Your partner all around the production machine.
- Hennig. (2025, September 10). Hennig lands on 2025 INC5000 list as USA manufacturing reinvests in reliability.
- International Federation of Robotics. (2025, September 25). World Robotics 2025 report: Industrial robots.
- Japan Machine Tool Builders Association. (2026, February 3). The current condition of the Japanese machine tool industry.
- Ministry of Statistics and Programme Implementation, Government of India. (2026, June 1). First press release of All India Index of Industrial Production of new series with base year 2022-23.
- Occupational Safety and Health Administration. (2026, April 15). Top 10 most frequently cited standards.
- State Council Information Office of the People’s Republic of China. (2026, January 19). China’s industrial output up 5.9% in 2025.
- UCIMU-SISTEMI PER PRODURRE. (2026, April 28). UCIMU: In first quarter 2026 machine tool orders on the rise.
- VDW. (2025, May 21). International projects hold up machine tool order levels.
This bibliography is provided for reader reference and is not exhaustive. The full report contains the complete reference list and detailed citations.
This Report Answers
- What value is forecast for the telescopic way covers market in 2026 and by 2036?
- What CAGR is forecast for the telescopic way covers market from 2026 to 2036?
- What cover type, material type, axis orientation, machine type, and sales channel segments define the disclosed share view?
- How do sourcing pressures support adoption and purchase activity across approved accounts?
- How do country CAGRs differ across the profiled markets?
- What companies compete across portfolio depth and segment alignment?
- How does FMI validate forecasts using hybrid bottom-up and top-down methodology?
- What factors should buyers address before account expansion or sourcing commitment?
- How do technical files and qualification records affect vendor selection?
Frequently Asked Questions
What is driving growth in the telescopic way covers market?
Demand reflects retrofit compatibility and shorter equipment commissioning cycles across precision machinery accounts. Steel telescopic covers and carbon steel structures keep supplier review focused on protection evidence.
Who are the key players in the telescopic way covers market?
Key players include Hennig, Dynatect Manufacturing, HEMA, Sermeto Hennig France, PEI Group, Tecnimetal, Arno Arnold, Bellowstech, Shaver Industries, and TSUBAKI KABELSCHLEPP. Competition centers on cover design depth and repair support.
What is a material restraint in the telescopic way covers market?
A material restraint in the telescopic way covers market is the approval burden created by unclear cover stroke data and repair ownership during machine-builder review. Buyers may delay switching if technical evidence and service accountability are insufficient.
Why should executives track the telescopic way covers market?
Executives should track the market as cover selection affects machine uptime and supplier accountability across recurring manufacturing operations. Product choice may influence service costs and repeat purchase outcomes.
What business problem does the telescopic way covers market address?
The telescopic way covers market addresses a machine-protection problem created by guideway exposure and moving-axis damage across CNC or special-purpose machines. Well-matched covers support machine reliability and controlled maintenance planning.
What should sourcing leaders evaluate before selecting suppliers?
Sourcing leaders should evaluate cover proof and local application support before selecting suppliers. Supplier review should include drawing quality and field troubleshooting capacity.
What limits return on investment for purchasers?
Return on investment is likely to be limited by poor sealing and weak alignment between cover specification and machine conditions. Replacement delays may raise downtime costs during high-use production cycles.
How do suppliers build long-term account confidence?
Suppliers build account confidence through repeatable performance evidence and clear technical files. Regional service capacity and cover design continuity support recurring purchase decisions.
Preview the report firsthand - request a free sample
Get SampleGet the brochure for pricing and purchase details.
Get PDFTable of Content
- Key Takeaways
- Market Size and CAGR
- Top Growth Driver
- Fastest Growing Segment
- Leading Region
- Key Companies
- Emerging Opportunities
- Executive Summary
- Global Market Outlook
- Demand-side Trends
- Supply-side Trends
- Technology Roadmap Analysis
- Analysis and Recommendations
- Analyst Perspective (What is happening? Why now? What should investors know?)
- Key Questions Answered
- How large is the market?
- What is the CAGR?
- What are key trends?
- Which region dominates?
- Who are the leaders?
- Market Overview
- Market Coverage / Taxonomy
- Market Definition / Scope / Limitations
- Research Methodology
- Chapter Orientation
- Analytical Lens and Working Hypotheses
- Market Structure, Signals, and Trend Drivers
- Benchmarking and Cross-market Comparability
- Market Sizing, Forecasting, and Opportunity Mapping
- Research Design and Evidence Framework
- Desk Research Programme (Secondary Evidence)
- Expert Input and Fieldwork (Primary Evidence)
- Tooling, Models, and Reference Databases
- Data Engineering and Model Build
- Quality Assurance and Audit Trail
- Market Background
- Market Dynamics (Drivers, Restraints, Opportunity, Trends)
- Scenario Forecast (Optimistic, Likely, Conservative)
- Impact Analysis
- AI Impact
- Sustainability Impact
- Regulatory Impact
- Technology Impact
- Consumer / Buyer Analysis
- Purchase Drivers
- Adoption Barriers
- Buyer Journey
- Opportunity Map Analysis
- Product Life Cycle Analysis
- Supply Chain Analysis
- Investment Feasibility Matrix
- Value Chain Analysis
- PESTLE and Porter's Analysis
- Regulatory Landscape
- Regional Parent Market Outlook
- Production and Consumption Statistics
- Import and Export Statistics
- Global Market Analysis and Forecast, 2021 to 2036
- Historical Market Size Value (USD Million) & Volume (Unit) Analysis, 2021 to 2025
- Current and Future Market Size Value (USD Million) & Volume (Unit) Projections, 2026 to 2036
- Y-o-Y Growth Trend Analysis
- Absolute $ Opportunity Analysis
- Global Market Pricing Analysis, 2021 to 2036
- Global Market Analysis and Forecast, By Cover Type, 2021 to 2036
- Introduction / Key Findings
- Historical Market Size Value (USD Million) & Volume (Unit) Analysis By Cover Type, 2021 to 2025
- Current and Future Market Size Value (USD Million) & Volume (Unit) Analysis and Forecast By Cover Type, 2026 to 2036
- Steel Telescopic Covers
- Stainless Steel Covers
- Roller / Box Way Covers
- Custom Multi-stage Covers
- Heavy-duty slat covers
- Steel Telescopic Covers
- Y-o-Y Growth Trend Analysis By Cover Type, 2021 to 2025
- Absolute $ Opportunity Analysis By Cover Type, 2026 to 2036
- Global Market Analysis and Forecast, By Material Type, 2021 to 2036
- Introduction / Key Findings
- Historical Market Size Value (USD Million) & Volume (Unit) Analysis By Material Type, 2021 to 2025
- Current and Future Market Size Value (USD Million) & Volume (Unit) Analysis and Forecast By Material Type, 2026 to 2036
- Carbon steel
- Stainless steel
- Aluminum
- Composite polymer
- Hybrid metal-composite structures
- Carbon steel
- Y-o-Y Growth Trend Analysis By Material Type, 2021 to 2025
- Absolute $ Opportunity Analysis By Material Type, 2026 to 2036
- Global Market Analysis and Forecast, By Axis Orientation, 2021 to 2036
- Introduction / Key Findings
- Historical Market Size Value (USD Million) & Volume (Unit) Analysis By Axis Orientation, 2021 to 2025
- Current and Future Market Size Value (USD Million) & Volume (Unit) Analysis and Forecast By Axis Orientation, 2026 to 2036
- Horizontal Axis Covers
- Vertical Axis Covers
- Cross-slide Covers
- Gantry / Long-travel Covers
- Multi-axis covers
- Horizontal Axis Covers
- Y-o-Y Growth Trend Analysis By Axis Orientation, 2021 to 2025
- Absolute $ Opportunity Analysis By Axis Orientation, 2026 to 2036
- Global Market Analysis and Forecast, By Machine Type, 2021 to 2036
- Introduction / Key Findings
- Historical Market Size Value (USD Million) & Volume (Unit) Analysis By Machine Type, 2021 to 2025
- Current and Future Market Size Value (USD Million) & Volume (Unit) Analysis and Forecast By Machine Type, 2026 to 2036
- CNC Machining Centers
- Turning Centers
- Grinding Machines
- Special Purpose Machines
- Laser / Fabrication Machines
- CNC Machining Centers
- Y-o-Y Growth Trend Analysis By Machine Type, 2021 to 2025
- Absolute $ Opportunity Analysis By Machine Type, 2026 to 2036
- Global Market Analysis and Forecast, By Sales Channel, 2021 to 2036
- Introduction / Key Findings
- Historical Market Size Value (USD Million) & Volume (Unit) Analysis By Sales Channel, 2021 to 2025
- Current and Future Market Size Value (USD Million) & Volume (Unit) Analysis and Forecast By Sales Channel, 2026 to 2036
- Machine Tool OEMs
- Aftermarket Replacement
- Rebuilders / Service Shops
- Industrial Distributors
- Direct engineering support
- Machine Tool OEMs
- Y-o-Y Growth Trend Analysis By Sales Channel, 2021 to 2025
- Absolute $ Opportunity Analysis By Sales Channel, 2026 to 2036
- Global Market Analysis and Forecast, By Region, 2021 to 2036
- Introduction
- Historical Market Size Value (USD Million) & Volume (Unit) Analysis By Region, 2021 to 2025
- Current Market Size Value (USD Million) & Volume (Unit) Analysis and Forecast By Region, 2026 to 2036
- North America
- Latin America
- Europe
- East Asia
- South Asia and Pacific
- Middle East and Africa
- Market Attractiveness Analysis By Region
- North America Market Analysis and Forecast, By Country, 2021 to 2036
- Historical Market Size Value (USD Million) & Volume (Unit) Trend Analysis By Market Taxonomy, 2021 to 2025
- Market Size Value (USD Million) & Volume (Unit) Forecast By Market Taxonomy, 2026 to 2036
- By Country
- United States
- Canada
- By Cover Type
- By Axis Orientation
- By Machine Type
- By Sales Channel
- By Country
- Market Attractiveness Analysis
- By Country
- By Cover Type
- By Axis Orientation
- By Machine Type
- By Sales Channel
- Key Takeaways
- Latin America Market Analysis and Forecast, By Country
- Historical Market Size Value (USD Million) & Volume (Unit) Trend Analysis By Market Taxonomy, 2021 to 2025
- Market Size Value (USD Million) & Volume (Unit) Forecast By Market Taxonomy, 2026 to 2036
- By Country
- Brazil
- Mexico
- Argentina
- By Cover Type
- By Axis Orientation
- By Machine Type
- By Sales Channel
- By Country
- Market Attractiveness Analysis
- By Country
- By Cover Type
- By Axis Orientation
- By Machine Type
- By Sales Channel
- Key Takeaways
- Europe Market Analysis and Forecast, By Country
- Historical Market Size Value (USD Million) & Volume (Unit) Trend Analysis By Market Taxonomy, 2021 to 2025
- Market Size Value (USD Million) & Volume (Unit) Forecast By Market Taxonomy, 2026 to 2036
- By Country
- Germany
- United Kingdom
- France
- Italy
- Spain
- By Cover Type
- By Axis Orientation
- By Machine Type
- By Sales Channel
- By Country
- Market Attractiveness Analysis
- By Country
- By Cover Type
- By Axis Orientation
- By Machine Type
- By Sales Channel
- Key Takeaways
- East Asia Market Analysis and Forecast, By Country
- Historical Market Size Value (USD Million) & Volume (Unit) Trend Analysis By Market Taxonomy, 2021 to 2025
- Market Size Value (USD Million) & Volume (Unit) Forecast By Market Taxonomy, 2026 to 2036
- By Country
- China
- Japan
- South Korea
- By Cover Type
- By Axis Orientation
- By Machine Type
- By Sales Channel
- By Country
- Market Attractiveness Analysis
- By Country
- By Cover Type
- By Axis Orientation
- By Machine Type
- By Sales Channel
- Key Takeaways
- South Asia and Pacific Market Analysis and Forecast, By Country
- Historical Market Size Value (USD Million) & Volume (Unit) Trend Analysis By Market Taxonomy, 2021 to 2025
- Market Size Value (USD Million) & Volume (Unit) Forecast By Market Taxonomy, 2026 to 2036
- By Country
- India
- ASEAN
- Australia and New Zealand
- By Cover Type
- By Axis Orientation
- By Machine Type
- By Sales Channel
- By Country
- Market Attractiveness Analysis
- By Country
- By Cover Type
- By Axis Orientation
- By Machine Type
- By Sales Channel
- Key Takeaways
- Middle East and Africa Market Analysis and Forecast, By Country
- Historical Market Size Value (USD Million) & Volume (Unit) Trend Analysis By Market Taxonomy, 2021 to 2025
- Market Size Value (USD Million) & Volume (Unit) Forecast By Market Taxonomy, 2026 to 2036
- By Country
- GCC countries
- South Africa
- Türkiye
- By Cover Type
- By Axis Orientation
- By Machine Type
- By Sales Channel
- By Country
- Market Attractiveness Analysis
- By Country
- By Cover Type
- By Axis Orientation
- By Machine Type
- By Sales Channel
- Key Takeaways
- Key Countries Market Analysis
- Japan
- Pricing Analysis
- Market Share Analysis, 2025
- By Cover Type
- By Axis Orientation
- By Machine Type
- By Sales Channel
- Germany
- Pricing Analysis
- Market Share Analysis, 2025
- By Cover Type
- By Axis Orientation
- By Machine Type
- By Sales Channel
- United States
- Pricing Analysis
- Market Share Analysis, 2025
- By Cover Type
- By Axis Orientation
- By Machine Type
- By Sales Channel
- Italy
- Pricing Analysis
- Market Share Analysis, 2025
- By Cover Type
- By Axis Orientation
- By Machine Type
- By Sales Channel
- South Korea
- Pricing Analysis
- Market Share Analysis, 2025
- By Cover Type
- By Axis Orientation
- By Machine Type
- By Sales Channel
- China
- Pricing Analysis
- Market Share Analysis, 2025
- By Cover Type
- By Axis Orientation
- By Machine Type
- By Sales Channel
- India
- Pricing Analysis
- Market Share Analysis, 2025
- By Cover Type
- By Axis Orientation
- By Machine Type
- By Sales Channel
- Japan
- Market Structure Analysis
- Competition Dashboard
- Competition Benchmarking
- Market Share Analysis of Top Players
- By Regional
- By Cover Type
- By Axis Orientation
- By Machine Type
- By Sales Channel
- Emerging Startups
- Innovation Benchmarking
- Competition Analysis
- Competition Deep Dive
- Hennig
- Overview
- Product Portfolio
- Profitability by Market Segments (Product/Region/Sales Channel)
- Sales Footprint
- Strategy Overview
- Marketing Strategy
- Product Strategy
- Channel Strategy
- Dynatect Manufacturing
- HEMA
- Sermeto Hennig France
- PEI Group
- Tecnimetal
- Arno Arnold
- Bellowstech
- Shaver Industries
- TSUBAKI KABELSCHLEPP
- Hennig
- Case Studies
- Success Stories
- Recent Developments
- Competition Deep Dive
- Assumptions & Acronyms Used


