Reports

- Global Locations -

Headquarters

Future Market Insights, Inc.

Christiana Corporate, 200
Continental Drive, Suite 401,
Newark, Delaware - 19713,
United States

T: +1-845-579-5705

Americas

Future Market Insights, Inc.

616 Corporate Way, Suite 2-9018,
Valley Cottage, NY 10989, United States

T: +1-347-918-3531

MEA

Future Market Insights

1602-6 Jumeirah Bay X2 Tower, Plot No: JLT-PH2-X2A,
Jumeirah Lakes Towers, Dubai,
United Arab Emirates

Europe

Future Market Insights

3rd Floor, 207 Regent Street,
W1B 3HH London
United Kingdom

T: + 44 (0) 20 8123 9659
D: +44 (0) 20 3287 4268

Asia Pacific

Future Market Insights

IndiaLand Global Tech Park, Unit UG-1, Behind Grand HighStreet, Phase 1, Hinjawadi, MH, Pune – 411057, India

Temperature Controlled Pharmaceutical Packaging Solutions Market Snapshot from 2024 to 2034

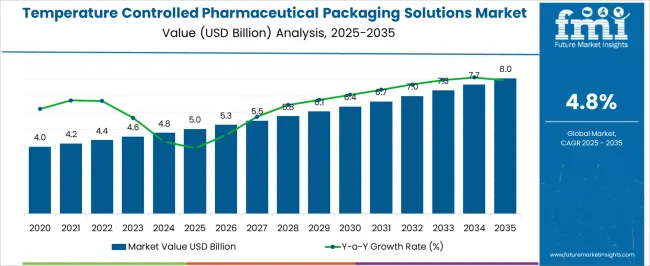
The temperature controlled pharmaceutical packaging solutions market had an estimated market share worth US$ 4.6 billion in 2023, and it is predicted to reach a global market valuation of US$ 7.7 billion by 2034, growing at a CAGR of 4.8% from 2024 to 2034.

Demand Analysis of Temperature Controlled Pharmaceutical Packaging Solutions

  • By ensuring that pharmaceutical items that are sensitive to temperature are kept and transported at the proper temperatures, these solutions lower the risk of product deterioration and degradation and help maintain their efficacy.
  • Temperature controlled packaging solutions assist businesses in adhering to the strict regulations governing pharmaceutical items, guaranteeing that the goods fulfill quality criteria and regulatory directives for temperature control during transit and storage.
  • Companies may increase their reputation for product quality, dependability, and dedication to patient safety by providing pharmaceutical items in optimal condition and fostering trust with stakeholders and consumers.
Report Attribute Details
Estimated Market Value in 2023 US$ 4.6 billion
Expected Market Value in 2024 US$ 4.8 billion
Projected Forecast Value in 2034 US$ 7.7 billion
Anticipated Growth Rate from 2024 to 2034 4.8% CAGR

Don't pay for what you don't need

Customize your report by selecting specific countries or regions and save 30%!

Temperature Controlled Pharmaceutical Packaging Solutions Market Historical Analysis from 2018 to 2023 vs. Forecast Outlook from 2024 to 2034

The global demand for the temperature controlled pharmaceutical packaging solutions market was estimated to reach a valuation of US$ 3.5 billion in 2018, according to a report from Future Market Insights. From 2018 to 2023, the temperature controlled pharmaceutical packaging solutions market witnessed significant growth, registering a CAGR of 5.5%.

Historical CAGR from 2018 to 2023 5.5%
Forecast CAGR from 2024 to 2034 4.8%

The development of temperature controlled packaging solutions that include blockchain technology is a latest innovation in this domain. This concept would improve supply chain transparency and traceability, guaranteeing that pharmaceutical items remain at the appropriate temperature levels throughout their journey from manufacturing plants to end users, hence improving product safety and regulatory compliance.

The market for temperature controlled pharmaceutical packaging solutions is expected to grow in the future due to these factors:

  • The effectiveness and dependability of temperature controlled packaging will be improved by ongoing developments in insulating materials, temperature monitoring technologies, and smart packaging solutions, satisfying changing industrial demands.
  • Temperature controlled pharmaceutical packaging solutions will become more and more in demand as biologics and customized medicine become more commonplace. These treatments frequently call for exact temperature control.
  • This will become more and more necessary as cold chain logistics expand, especially in emerging economies, in order to preserve product integrity during storage and transit.

Key Factors Driving the Temperature Controlled Pharmaceutical Packaging Solutions Market

Strict Temperature Control Regulations to Enhance Market Growth

The growing demand for biologics, vaccines, and specialized pharmaceuticals need stringent temperature control to ensure efficacy and safety, driving the need for innovative packaging solutions. Temperature controlled pharmaceutical packaging solutions are becoming more popular as pharmaceutical distribution networks expand into new areas with harsh climatic conditions.

Investments in dependable packaging solutions are prompted by the strict regulatory requirements for temperature sensitive medications, which demand adherence to temperature control standards. Pharmaceutical supply chains are becoming more global, which emphasizes how crucial temperature controlled pharmaceutical packaging solutions is to maintaining product integrity while in transit.

Ismail Sutaria
Ismail Sutaria

Principal Consultant

Talk to Analyst

Find your sweet spots for generating winning opportunities in this market.

Factors that can impede Market Growth

Challenges in the Cold Chain Management to Impede the Market Growth

Maintaining temperature control throughout the supply chain for temperature sensitive pharmaceuticals involves logistical problems that need specialized infrastructure and knowledge, thereby limiting market accessibility and scalability for some enterprises.

Adoption of current temperature controlled packaging technology is hindered, especially by smaller pharmaceutical businesses, by the high initial cost involved. Challenges in supply chain logistics, such as the requirement for specialized infrastructure and cold chain management, impede industry entrance and growth.

Comparative View of Adjacent Markets

In this section, the analysis will be drawn among three relevant markets. These are the temperature controlled pharmaceutical packaging solutions market, anti-counterfeit pharmaceutical packaging market, and pharmaceutical packaging market.

Strict regulatory requirements, rising specialty medication demand, increased focus on product safety and integrity, and the growth of pharmaceutical supply chains are the common factors driving these markets. Innovative packaging solutions are required to guarantee quality, compliance, and security throughout the product life cycle.

Temperature Controlled Pharmaceutical Packaging Solutions Market:

Market Name Temperature Controlled Pharmaceutical Packaging Solutions Market
CAGR from 2024 to 2034 4.8%
Growth Factor The necessity for dependable temperature controlled packaging solutions to preserve product efficacy and safety during international transit is one factor contributing to the growing globalization of pharmaceutical supply chains.
Future Opportunities To address the rising environmental concerns and satisfy the need for environmentally aware packaging choices in the pharmaceutical business, one possibility is to develop sustainable and eco-friendly temperature controlled packaging solutions.

Anti-counterfeit Pharmaceutical Packaging Market:

Market Name Anti-counterfeit Pharmaceutical Packaging Market
CAGR from 2024 to 2034 8.6%
Growth Factor AI and machine learning are increasingly being used to evaluate data from a variety of sources, including supply chain information and market monitoring. This data analysis aids in the effective identification and defense against counterfeit goods.
Future Opportunities With the increasing popularity of mobile applications and QR codes, consumers and medical professionals may use their cellphones to confirm the legitimacy of pharmaceutical items.

Pharmaceutical Packaging Market:

Market Name Pharmaceutical Packaging Market
CAGR from 2024 to 2034 6.4%
Growth Factor Diverse packaging options play an important role in greatly increasing the shelf life of medications by protecting them from moisture, oxygen, chemicals, and microbiological development.
Future Opportunities The market is expected to grow as a result of the growing number of retail pharmacies in developing nations and the growing focus pharmaceutical companies have placed on brand marketing and product differentiation.

Get the data you need at a Fraction of the cost

Personalize your report by choosing insights you need
and save 40%!

Category wise Insights

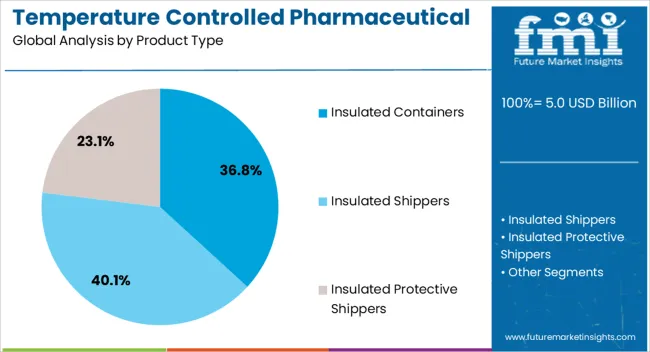
This section focuses on providing detailed analysis of two particular market segments for temperature controlled pharmaceutical packaging solutions, the dominant product type and the significant application. The two main segments discussed below are the insulated chillers and chilled segments.

Insulated Chillers will Gain Traction in the Global Temperature Controlled Pharmaceutical Packaging Solutions Market

Product Type Insulated Chillers
CAGR from 2024 to 2034 62.30%

In 2024, the insulated chillers are anticipated to gain a 62.30% market share. Pharmaceutical supply chains are becoming more and more globalized, making dependable temperature control solutions necessary to preserve product integrity while shipping across several climatic zones.

The necessity for accurate temperature control is highlighted by the rising need for drugs that are sensitive to changes in temperature, such as biologics and vaccinations. Pharmaceutical firms must invest in insulated chillers to maintain compliance and product safety across the supply chain due to strict regulatory standards and quality assurance requirements and costs.

Temperature Controlled Pharmaceutical Packaging Solutions is Likely to be used for Chilled Applications

Application Chilled
Market Share in 2024 42.90%

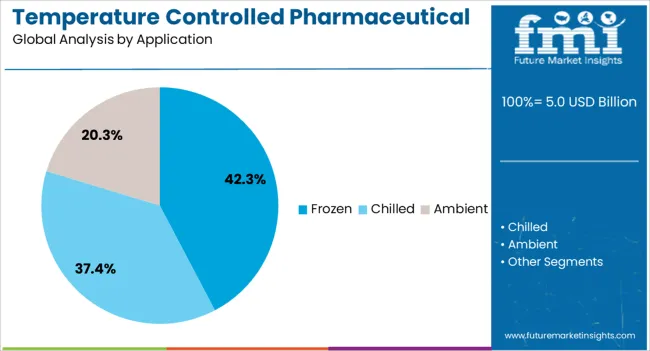
In 2024, the chilled application segment is anticipated to acquire almost 42.90% market share. A growing number of drugs, such as vaccinations and biologics, must be stored and transported at certain cold temperatures in order to be effective.

The use of chilled solutions is becoming increasingly practical due to advancements in refrigeration and cold chain logistics. Pharmaceutical firms are compelled by strict regulations and elevated quality standards to invest in dependable chilled packaging solutions in order to guarantee product safety and stability.

Region wise Analysis

This section will go into detail on the temperature controlled pharmaceutical packaging solutions markets in a few key countries, including the United States, the United Kingdom, China, Japan and South Korea.

This part will focus on the key factors that are driving up demand in these countries for temperature controlled pharmaceutical packaging solutions.

Countries Forecast CAGRs from 2024 to 2034
The United States 36.6%
The United Kingdom 37%
France 36.9%
China 37.6%
Japan 38.1%

Cold Chain Logistics Integration in the United States to Accelerate Demand

The United States temperature controlled pharmaceutical packaging solutions ecosystem is anticipated to gain a CAGR of 2% through 2034. Factors that are bolstering the growth are:

  • These solutions frequently integrate with cold chain logistics, guaranteeing the smooth movement and storage of medications that are sensitive to temperature from production sites to final consumers, preserving product integrity all the way through the supply chain.
  • Smart technology like RFID tags and Internet of Things sensors may be included into creative temperature controlled packaging solutions to provide real time temperature monitoring throughout transport and give stakeholders useful information to assure product quality and compliance.

Need for Biologics and Specialty Medications to Accelerate Demand in the United Kingdom

The temperature controlled pharmaceutical packaging solutions market in the United Kingdom is expected to expand with a 3.80% CAGR through 2034. The factors pushing the growth are:

  • The aging population and rising incidence of chronic illnesses in the United Kingdom are driving up demand for biologics and specialty pharmaceuticals, which are temperature sensitive treatments.
  • Advanced packaging solutions that can preserve product efficacy and safety throughout storage and transit are becoming more and more necessary as a result of this development.

Strict Government Regulations towards Secure Drug Packaging to Bolster Growth in China

The temperature controlled pharmaceutical packaging solutions ecosystem in China is anticipated to develop with a 5.10% CAGR from 2024 to 2034. The drivers behind this growth are:

  • The Chinese government is tightening restrictions and standards for pharmaceutical items, including severe temperature controls during storage and transit.
  • Pharmaceutical businesses are compelled by the current regulatory landscape to make investments in dependable temperature controlled packaging solutions in order to go by rules, preserve product quality, and ensure product safety.

Robust Healthcare Infrastructure in Japan to Accelerate Demand

The temperature controlled pharmaceutical packaging solutions industry in Japan is anticipated to reach a 2.60% CAGR from 2024 to 2034. The drivers propelling growth forward are:

  • Japan is known for having an extremely advanced healthcare system and for prioritizing quality control. In order to protect pharmaceutical items during storage and transit, there is a growing need for advanced temperature controlled packaging solutions.
  • Due to its huge aging population, Japan has seen a rise in the need for drugs that are sensitive to temperature. The necessity for dependable packaging solutions that can preserve the safety and effectiveness of pharmaceutical items for this age group is fueled by this demographic trend.

Rising Demand for Specialty Medications to Enhance Market Growth in South Korea

The temperature controlled pharmaceutical packaging solutions ecosystem in South Korea is likely to evolve with a 3.40% CAGR during the forecast period. The factors bolstering the growth are:
  • The need for temperature sensitive specialty drugs is driven by the aging population and the increased incidence of chronic diseases. This means that advanced packaging solutions are required to guarantee the safety and effectiveness of the products.
  • The pharmaceutical industry in South Korea is subject to stringent regulations that demand adherence to temperature control measures. This has led to a surge in investment in new packaging technologies aimed at meeting regulatory standards and preserving product integrity.

Market Competition

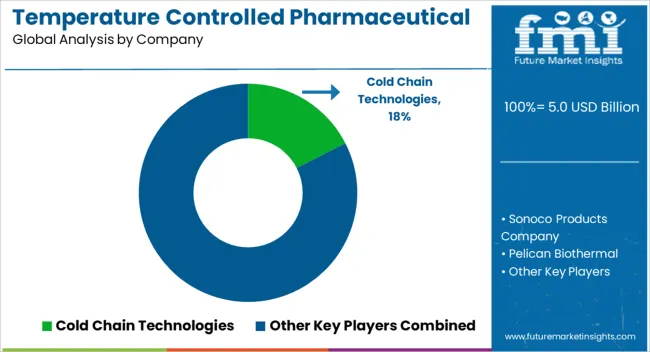
The key players in the market for temperature controlled pharmaceutical packaging solutions are concentrating on a number of tactics to satisfy the strict needs for the transportation and storage of drugs that are sensitive to temperature. Investing in research and development to improve temperature monitoring systems and insulating materials is part of this.

They are also diversifying their product lines to provide a greater selection of packaging alternatives that are suited to various temperature needs. To guarantee the integrity of the supply chain from beginning to finish, cooperation with pharmaceutical firms and logistical partners is also given top priority.

Significant corporations are progressively implementing sustainable practices in order to lessen their impact on the environment and adhere to legal requirements. The key players in this market include:

  • Sonoco Products Company
  • Pelican Biothermal
  • Sofrigam SA Ltd.
  • Cryopak
  • Cold Chain Technologies
  • Envirotainer Ltd.
  • Cencora Inc.
  • Inmark Packaging
  • American Aerogel Corporation
  • Aeris Dynamics

Significant advancements in the temperature controlled pharmaceutical packaging solutions market are being made by key market participants, and these include:

  • In 2023, Sonoco declared that EnviroFlex® Paper Ultimate (ULT) 1.0, a high barrier paper based structure, has met all the requirements of the Fibre Box Association's Voluntary Standard for Repulping and Recycling and has been pre qualified by How2Recycle®.
  • Sonoco is pre qualified because of its continuous efforts to provide cutting edge, environmentally friendly packaging solutions. Superior grease, moisture, and oxygen barrier packaging is offered by EnviroFlex Paper ULT 1.0, which comes in rollstock, heat/cold seal, sachets, and pre made pouches.

Key Coverage in Temperature Controlled Pharmaceutical Packaging Solutions Market Report

  • Outlook for Temperature Controlled Pharma Packaging Solutions
  • Controlled temperature packaging innovations
  • Frozen Temperature Controlled Pharma Packaging Solutions
  • Ambient Temperature Controlled Pharma Packaging Solutions
  • Pharma cold chain market
  • Thermal packaging solutions market

Report Scope

Report Attribute Details
Growth Rate CAGR of 4.8% from 2024 to 2034
Market value in 2024 US$ 4.8 billion
Market value in 2034 US$ 7.7 billion
Base Year for Estimation 2023
Historical Data 2018 to 2023
Forecast Period 2024 to 2034
Quantitative Units US$ billion for value
Report Coverage Revenue Forecast, Company Ranking, Competitive Landscape, Growth Factors, Trends, and Pricing Analysis
Segments Covered
  • Product Type
  • Application
  • Region
Region Covered
  • North America
  • Latin America
  • Western Europe
  • Eastern Europe
  • South Asia and Pacific
  • East Asia
  • The Middle East & Africa
Countries Profiled
  • The United States
  • Canada
  • Brazil
  • Mexico
  • Germany
  • The United Kingdom
  • France
  • Spain
  • Italy
  • Poland
  • Russia
  • Czech Republic
  • Romania
  • India
  • Bangladesh
  • Australia
  • New Zealand
  • China
  • Japan
  • South Korea
  • GCC Countries
  • South Africa
  • Israel
Key Companies Profiled
  • Sonoco Products Company
  • Pelican Biothermal
  • Sofrigam SA Ltd.
  • Cryopak
  • Cold Chain Technologies
  • Envirotainer Ltd.
  • Cencora Inc.
  • Inmark Packaging
  • American Aerogel Corporation
  • Aeris Dynamics
Customization Scope Available on Request

Key Segments Profiled in the Temperature Controlled Pharmaceutical Packaging Solutions Market

By Product Type:

  • Insulated Shippers
    • Panels & Envelopes
    • EPS Foam Containers
    • Fibreboard
    • PUR Containers
  • Insulated Protective Shippers
  • Insulated Containers
    • Chest Style
    • Upright Style
    • Others

By Application:

  • Frozen
  • Chilled
  • Ambient

By Region:

  • North America
  • Latin America
  • Western Europe
  • Eastern Europe
  • South Asia and Pacific
  • East Asia
  • The Middle East & Africa

Frequently Asked Questions

What is the anticipated growth rate of the temperature controlled pharmaceutical packaging solutions market from 2024 to 2034?

The temperature controlled pharmaceutical packaging solutions market is expected to garner a 4.8% CAGR from 2024 to 2034.

What will be the global market outlook for temperature controlled pharmaceutical packaging solutions through 2024?

By 2024, the global temperature controlled pharmaceutical packaging solutions market is likely to gain US$ 4.8 billion.

What is the expected global market valuation for temperature controlled pharmaceutical packaging solutions by 2034?

By 2034, the temperature controlled pharmaceutical packaging solutions market valuation is likely to reach a sum of US$ 7.7 billion.

How will the demand for temperature controlled pharmaceutical packaging solutions develop in the United States?

The temperature controlled pharmaceutical packaging solutions industry in the United States is likely to garner a 2% CAGR during the forecast period.

Which kind of temperature controlled pharmaceutical packaging solutions to gain traction during the forecast period?

The insulated shippers to gain traction in the global market for temperature controlled pharmaceutical packaging solutions, with an expected 62.30% market share in 2024.

Which will be the dominant application of temperature controlled pharmaceutical packaging solutions?

The temperature controlled pharmaceutical packaging solutions systems will be highly used for chilled packaging with an anticipated 42.90% market share in 2024.

Table of Content

1. Executive Summary

    1.1. Global Market Outlook

    1.2. Demand-side Trends

    1.3. Supply-side Trends

    1.4. Technology Roadmap Analysis

    1.5. Analysis and Recommendations

2. Market Overview

    2.1. Market Coverage / Taxonomy

    2.2. Market Definition / Scope / Limitations

3. Market Background

    3.1. Market Dynamics

        3.1.1. Drivers

        3.1.2. Restraints

        3.1.3. Opportunity

        3.1.4. Trends

    3.2. Scenario Forecast

        3.2.1. Demand in Optimistic Scenario

        3.2.2. Demand in Likely Scenario

        3.2.3. Demand in Conservative Scenario

    3.3. Opportunity Map Analysis

    3.4. Product Life Cycle Analysis

    3.5. Supply Chain Analysis

        3.5.1. Supply Side Participants and their Roles

            3.5.1.1. Manufacturer

            3.5.1.2. Mid-Level Participants (Traders)

    3.6. 3.5.1.3 Distributors

        3.6.1. Value Added and Value Created at Node in the Supply Chain

        3.6.2. List of Raw Material Suppliers

        3.6.3. List of Existing and Potential Buyer’s

    3.7. Investment Feasibility Matrix

    3.8. Value Chain Analysis

        3.8.1. Profit Margin Analysis

        3.8.2. Distributors

    3.9. PESTLE and Porter’s Analysis

    3.10. Regulatory Landscape

        3.10.1. By Key Regions

        3.10.2. By Key Countries

    3.11. Regional Parent Market Outlook

    3.12. Manufacturer and Consumption Statistics

    3.13. Import and Export Statistics

4. Global Market Analysis 2019 to 2023 and Forecast, 2024 to 2034

    4.1. Historical Market Size Value (US$ Million) & Volume (Units) Analysis, 2019 to 2023

    4.2. Current and Future Market Size Value (US$ Million) & Volume (Units) Projections, 2024 to 2034

        4.2.1. Y-o-Y Growth Trend Analysis

        4.2.2. Absolute $ Opportunity Analysis

5. Global Market Analysis 2019 to 2023 and Forecast 2024 to 2034, By Product Type

    5.1. Introduction / Key Findings

    5.2. Historical Market Size Value (US$ Million) & Volume (Units) Analysis By Product Type, 2019 to 2023

    5.3. Current and Future Market Size Value (US$ Million) & Volume (Units) Analysis and Forecast By Product Type, 2024 to 2034

        5.3.1. Insulated Shippers

            5.3.1.1. Panels & Envelopes

            5.3.1.2. EPS Foam Containers

            5.3.1.3. Fibreboard

            5.3.1.4. PUR Containers

        5.3.2. Insulated Protective Shippers

        5.3.3. Insulated Containers

            5.3.3.1. Chest Style

            5.3.3.2. Upright Style

        5.3.4. Others

    5.4. Y-o-Y Growth Trend Analysis By Product Type, 2019 to 2023

    5.5. Absolute $ Opportunity Analysis By Product Type, 2024 to 2034

6. Global Market Analysis 2019 to 2023 and Forecast 2024 to 2034, By Application

    6.1. Introduction / Key Findings

    6.2. Historical Market Size Value (US$ Million) & Volume (Units) Analysis By Application, 2019 to 2023

    6.3. Current and Future Market Size Value (US$ Million) & Volume (Units) Analysis and Forecast By Application, 2024 to 2034

        6.3.1. Frozen

        6.3.2. Chilled

        6.3.3. Ambient

    6.4. Y-o-Y Growth Trend Analysis By Application, 2019 to 2023

    6.5. Absolute $ Opportunity Analysis By Application, 2024 to 2034

7. Global Market Analysis 2019 to 2023 and Forecast 2024 to 2034, By Region

    7.1. Introduction

    7.2. Historical Market Size Value (US$ Million) & Volume (Units) Analysis By Region, 2019 to 2023

    7.3. Current Market Size Value (US$ Million) & Volume (Units) Analysis and Forecast By Region, 2024 to 2034

        7.3.1. North America

        7.3.2. Latin America

        7.3.3. Western Europe

        7.3.4. Eastern Europe

        7.3.5. South Asia and Pacific

        7.3.6. East Asia

        7.3.7. Middle East and Africa

    7.4. Market Attractiveness Analysis By Region

8. North America Market Analysis 2019 to 2023 and Forecast 2024 to 2034, By Country

    8.1. Historical Market Size Value (US$ Million) & Volume (Units) Trend Analysis By Market Taxonomy, 2019 to 2023

    8.2. Market Size Value (US$ Million) & Volume (Units) Forecast By Market Taxonomy, 2024 to 2034

        8.2.1. By Country

            8.2.1.1. USA

            8.2.1.2. Canada

        8.2.2. By Product Type

        8.2.3. By Application

    8.3. Market Attractiveness Analysis

        8.3.1. By Country

        8.3.2. By Product Type

        8.3.3. By Application

    8.4. Key Takeaways

9. Latin America Market Analysis 2019 to 2023 and Forecast 2024 to 2034, By Country

    9.1. Historical Market Size Value (US$ Million) & Volume (Units) Trend Analysis By Market Taxonomy, 2019 to 2023

    9.2. Market Size Value (US$ Million) & Volume (Units) Forecast By Market Taxonomy, 2024 to 2034

        9.2.1. By Country

            9.2.1.1. Brazil

            9.2.1.2. Mexico

            9.2.1.3. Rest of Latin America

        9.2.2. By Product Type

        9.2.3. By Application

    9.3. Market Attractiveness Analysis

        9.3.1. By Country

        9.3.2. By Product Type

        9.3.3. By Application

    9.4. Key Takeaways

10. Western Europe Market Analysis 2019 to 2023 and Forecast 2024 to 2034, By Country

    10.1. Historical Market Size Value (US$ Million) & Volume (Units) Trend Analysis By Market Taxonomy, 2019 to 2023

    10.2. Market Size Value (US$ Million) & Volume (Units) Forecast By Market Taxonomy, 2024 to 2034

        10.2.1. By Country

            10.2.1.1. Germany

            10.2.1.2. UK

            10.2.1.3. France

            10.2.1.4. Spain

            10.2.1.5. Italy

            10.2.1.6. Rest of Western Europe

        10.2.2. By Product Type

        10.2.3. By Application

    10.3. Market Attractiveness Analysis

        10.3.1. By Country

        10.3.2. By Product Type

        10.3.3. By Application

    10.4. Key Takeaways

11. Eastern Europe Market Analysis 2019 to 2023 and Forecast 2024 to 2034, By Country

    11.1. Historical Market Size Value (US$ Million) & Volume (Units) Trend Analysis By Market Taxonomy, 2019 to 2023

    11.2. Market Size Value (US$ Million) & Volume (Units) Forecast By Market Taxonomy, 2024 to 2034

        11.2.1. By Country

            11.2.1.1. Poland

            11.2.1.2. Russia

            11.2.1.3. Czech Republic

            11.2.1.4. Romania

            11.2.1.5. Rest of Eastern Europe

        11.2.2. By Product Type

        11.2.3. By Application

    11.3. Market Attractiveness Analysis

        11.3.1. By Country

        11.3.2. By Product Type

        11.3.3. By Application

    11.4. Key Takeaways

12. South Asia and Pacific Market Analysis 2019 to 2023 and Forecast 2024 to 2034, By Country

    12.1. Historical Market Size Value (US$ Million) & Volume (Units) Trend Analysis By Market Taxonomy, 2019 to 2023

    12.2. Market Size Value (US$ Million) & Volume (Units) Forecast By Market Taxonomy, 2024 to 2034

        12.2.1. By Country

            12.2.1.1. India

            12.2.1.2. Bangladesh

            12.2.1.3. Australia

            12.2.1.4. New Zealand

            12.2.1.5. Rest of South Asia and Pacific

        12.2.2. By Product Type

        12.2.3. By Application

    12.3. Market Attractiveness Analysis

        12.3.1. By Country

        12.3.2. By Product Type

        12.3.3. By Application

    12.4. Key Takeaways

13. East Asia Market Analysis 2019 to 2023 and Forecast 2024 to 2034, By Country

    13.1. Historical Market Size Value (US$ Million) & Volume (Units) Trend Analysis By Market Taxonomy, 2019 to 2023

    13.2. Market Size Value (US$ Million) & Volume (Units) Forecast By Market Taxonomy, 2024 to 2034

        13.2.1. By Country

            13.2.1.1. China

            13.2.1.2. Japan

            13.2.1.3. South Korea

        13.2.2. By Product Type

        13.2.3. By Application

    13.3. Market Attractiveness Analysis

        13.3.1. By Country

        13.3.2. By Product Type

        13.3.3. By Application

    13.4. Key Takeaways

14. Middle East and Africa Market Analysis 2019 to 2023 and Forecast 2024 to 2034, By Country

    14.1. Historical Market Size Value (US$ Million) & Volume (Units) Trend Analysis By Market Taxonomy, 2019 to 2023

    14.2. Market Size Value (US$ Million) & Volume (Units) Forecast By Market Taxonomy, 2024 to 2034

        14.2.1. By Country

            14.2.1.1. GCC Countries

            14.2.1.2. South Africa

            14.2.1.3. Israel

            14.2.1.4. Rest of MEA

        14.2.2. By Product Type

        14.2.3. By Application

    14.3. Market Attractiveness Analysis

        14.3.1. By Country

        14.3.2. By Product Type

        14.3.3. By Application

    14.4. Key Takeaways

15. Key Countries Market Analysis

    15.1. USA

        15.1.1. Pricing Analysis

        15.1.2. Market Share Analysis, 2023

            15.1.2.1. By Product Type

            15.1.2.2. By Application

    15.2. Canada

        15.2.1. Pricing Analysis

        15.2.2. Market Share Analysis, 2023

            15.2.2.1. By Product Type

            15.2.2.2. By Application

    15.3. Brazil

        15.3.1. Pricing Analysis

        15.3.2. Market Share Analysis, 2023

            15.3.2.1. By Product Type

            15.3.2.2. By Application

    15.4. Mexico

        15.4.1. Pricing Analysis

        15.4.2. Market Share Analysis, 2023

            15.4.2.1. By Product Type

            15.4.2.2. By Application

    15.5. Germany

        15.5.1. Pricing Analysis

        15.5.2. Market Share Analysis, 2023

            15.5.2.1. By Product Type

            15.5.2.2. By Application

    15.6. UK

        15.6.1. Pricing Analysis

        15.6.2. Market Share Analysis, 2023

            15.6.2.1. By Product Type

            15.6.2.2. By Application

    15.7. France

        15.7.1. Pricing Analysis

        15.7.2. Market Share Analysis, 2023

            15.7.2.1. By Product Type

            15.7.2.2. By Application

    15.8. Spain

        15.8.1. Pricing Analysis

        15.8.2. Market Share Analysis, 2023

            15.8.2.1. By Product Type

            15.8.2.2. By Application

    15.9. Italy

        15.9.1. Pricing Analysis

        15.9.2. Market Share Analysis, 2023

            15.9.2.1. By Product Type

            15.9.2.2. By Application

    15.10. Poland

        15.10.1. Pricing Analysis

        15.10.2. Market Share Analysis, 2023

            15.10.2.1. By Product Type

            15.10.2.2. By Application

    15.11. Russia

        15.11.1. Pricing Analysis

        15.11.2. Market Share Analysis, 2023

            15.11.2.1. By Product Type

            15.11.2.2. By Application

    15.12. Czech Republic

        15.12.1. Pricing Analysis

        15.12.2. Market Share Analysis, 2023

            15.12.2.1. By Product Type

            15.12.2.2. By Application

    15.13. Romania

        15.13.1. Pricing Analysis

        15.13.2. Market Share Analysis, 2023

            15.13.2.1. By Product Type

            15.13.2.2. By Application

    15.14. India

        15.14.1. Pricing Analysis

        15.14.2. Market Share Analysis, 2023

            15.14.2.1. By Product Type

            15.14.2.2. By Application

    15.15. Bangladesh

        15.15.1. Pricing Analysis

        15.15.2. Market Share Analysis, 2023

            15.15.2.1. By Product Type

            15.15.2.2. By Application

    15.16. Australia

        15.16.1. Pricing Analysis

        15.16.2. Market Share Analysis, 2023

            15.16.2.1. By Product Type

            15.16.2.2. By Application

    15.17. New Zealand

        15.17.1. Pricing Analysis

        15.17.2. Market Share Analysis, 2023

            15.17.2.1. By Product Type

            15.17.2.2. By Application

    15.18. China

        15.18.1. Pricing Analysis

        15.18.2. Market Share Analysis, 2023

            15.18.2.1. By Product Type

            15.18.2.2. By Application

    15.19. Japan

        15.19.1. Pricing Analysis

        15.19.2. Market Share Analysis, 2023

            15.19.2.1. By Product Type

            15.19.2.2. By Application

    15.20. South Korea

        15.20.1. Pricing Analysis

        15.20.2. Market Share Analysis, 2023

            15.20.2.1. By Product Type

            15.20.2.2. By Application

    15.21. GCC Countries

        15.21.1. Pricing Analysis

        15.21.2. Market Share Analysis, 2023

            15.21.2.1. By Product Type

            15.21.2.2. By Application

    15.22. South Africa

        15.22.1. Pricing Analysis

        15.22.2. Market Share Analysis, 2023

            15.22.2.1. By Product Type

            15.22.2.2. By Application

    15.23. Israel

        15.23.1. Pricing Analysis

        15.23.2. Market Share Analysis, 2023

            15.23.2.1. By Product Type

            15.23.2.2. By Application

16. Market Structure Analysis

    16.1. Competition Dashboard

    16.2. Competition Benchmarking

    16.3. Market Share Analysis of Top Players

        16.3.1. By Regional

        16.3.2. By Product Type

        16.3.3. By Application

17. Competition Analysis

    17.1. Competition Deep Dive

        17.1.1. Sonoco Products Company

            17.1.1.1. Overview

            17.1.1.2. Product Portfolio

            17.1.1.3. Profitability by Market Segments

            17.1.1.4. Sales Footprint

            17.1.1.5. Strategy Overview

                17.1.1.5.1. Marketing Strategy

                17.1.1.5.2. Product Strategy

                17.1.1.5.3. Channel Strategy

        17.1.2. Pelican Biothermal

            17.1.2.1. Overview

            17.1.2.2. Product Portfolio

            17.1.2.3. Profitability by Market Segments

            17.1.2.4. Sales Footprint

            17.1.2.5. Strategy Overview

                17.1.2.5.1. Marketing Strategy

                17.1.2.5.2. Product Strategy

                17.1.2.5.3. Channel Strategy

        17.1.3. Sofrigam SA Ltd.

            17.1.3.1. Overview

            17.1.3.2. Product Portfolio

            17.1.3.3. Profitability by Market Segments

            17.1.3.4. Sales Footprint

            17.1.3.5. Strategy Overview

                17.1.3.5.1. Marketing Strategy

                17.1.3.5.2. Product Strategy

                17.1.3.5.3. Channel Strategy

        17.1.4. Cryopak

            17.1.4.1. Overview

            17.1.4.2. Product Portfolio

            17.1.4.3. Profitability by Market Segments

            17.1.4.4. Sales Footprint

            17.1.4.5. Strategy Overview

                17.1.4.5.1. Marketing Strategy

                17.1.4.5.2. Product Strategy

                17.1.4.5.3. Channel Strategy

        17.1.5. Cold Chain Technologies

            17.1.5.1. Overview

            17.1.5.2. Product Portfolio

            17.1.5.3. Profitability by Market Segments

            17.1.5.4. Sales Footprint

            17.1.5.5. Strategy Overview

                17.1.5.5.1. Marketing Strategy

                17.1.5.5.2. Product Strategy

                17.1.5.5.3. Channel Strategy

        17.1.6. Envirotainer Ltd.

            17.1.6.1. Overview

            17.1.6.2. Product Portfolio

            17.1.6.3. Profitability by Market Segments

            17.1.6.4. Sales Footprint

            17.1.6.5. Strategy Overview

                17.1.6.5.1. Marketing Strategy

                17.1.6.5.2. Product Strategy

                17.1.6.5.3. Channel Strategy

        17.1.7. Cencora Inc.

            17.1.7.1. Overview

            17.1.7.2. Product Portfolio

            17.1.7.3. Profitability by Market Segments

            17.1.7.4. Sales Footprint

            17.1.7.5. Strategy Overview

                17.1.7.5.1. Marketing Strategy

                17.1.7.5.2. Product Strategy

                17.1.7.5.3. Channel Strategy

        17.1.8. Inmark Packaging

            17.1.8.1. Overview

            17.1.8.2. Product Portfolio

            17.1.8.3. Profitability by Market Segments

            17.1.8.4. Sales Footprint

            17.1.8.5. Strategy Overview

                17.1.8.5.1. Marketing Strategy

                17.1.8.5.2. Product Strategy

                17.1.8.5.3. Channel Strategy

        17.1.9. American Aerogel Corporation

            17.1.9.1. Overview

            17.1.9.2. Product Portfolio

            17.1.9.3. Profitability by Market Segments

            17.1.9.4. Sales Footprint

            17.1.9.5. Strategy Overview

                17.1.9.5.1. Marketing Strategy

                17.1.9.5.2. Product Strategy

                17.1.9.5.3. Channel Strategy

        17.1.10. Aeris Dynamics

            17.1.10.1. Overview

            17.1.10.2. Product Portfolio

            17.1.10.3. Profitability by Market Segments

            17.1.10.4. Sales Footprint

            17.1.10.5. Strategy Overview

                17.1.10.5.1. Marketing Strategy

                17.1.10.5.2. Product Strategy

                17.1.10.5.3. Channel Strategy

18. Assumptions & Acronyms Used

19. Research Methodology

Don't pay for what you don't need

Customize your report by selecting specific countries or regions and save 30%!

List of Tables

Table 1: Global Market Value (US$ Million) Forecast by Region, 2019 to 2034

Table 2: Global Market Volume (Units) Forecast by Region, 2019 to 2034

Table 3: Global Market Value (US$ Million) Forecast by Product Type, 2019 to 2034

Table 4: Global Market Volume (Units) Forecast by Product Type, 2019 to 2034

Table 5: Global Market Value (US$ Million) Forecast by Application, 2019 to 2034

Table 6: Global Market Volume (Units) Forecast by Application, 2019 to 2034

Table 7: North America Market Value (US$ Million) Forecast by Country, 2019 to 2034

Table 8: North America Market Volume (Units) Forecast by Country, 2019 to 2034

Table 9: North America Market Value (US$ Million) Forecast by Product Type, 2019 to 2034

Table 10: North America Market Volume (Units) Forecast by Product Type, 2019 to 2034

Table 11: North America Market Value (US$ Million) Forecast by Application, 2019 to 2034

Table 12: North America Market Volume (Units) Forecast by Application, 2019 to 2034

Table 13: Latin America Market Value (US$ Million) Forecast by Country, 2019 to 2034

Table 14: Latin America Market Volume (Units) Forecast by Country, 2019 to 2034

Table 15: Latin America Market Value (US$ Million) Forecast by Product Type, 2019 to 2034

Table 16: Latin America Market Volume (Units) Forecast by Product Type, 2019 to 2034

Table 17: Latin America Market Value (US$ Million) Forecast by Application, 2019 to 2034

Table 18: Latin America Market Volume (Units) Forecast by Application, 2019 to 2034

Table 19: Western Europe Market Value (US$ Million) Forecast by Country, 2019 to 2034

Table 20: Western Europe Market Volume (Units) Forecast by Country, 2019 to 2034

Table 21: Western Europe Market Value (US$ Million) Forecast by Product Type, 2019 to 2034

Table 22: Western Europe Market Volume (Units) Forecast by Product Type, 2019 to 2034

Table 23: Western Europe Market Value (US$ Million) Forecast by Application, 2019 to 2034

Table 24: Western Europe Market Volume (Units) Forecast by Application, 2019 to 2034

Table 25: Eastern Europe Market Value (US$ Million) Forecast by Country, 2019 to 2034

Table 26: Eastern Europe Market Volume (Units) Forecast by Country, 2019 to 2034

Table 27: Eastern Europe Market Value (US$ Million) Forecast by Product Type, 2019 to 2034

Table 28: Eastern Europe Market Volume (Units) Forecast by Product Type, 2019 to 2034

Table 29: Eastern Europe Market Value (US$ Million) Forecast by Application, 2019 to 2034

Table 30: Eastern Europe Market Volume (Units) Forecast by Application, 2019 to 2034

Table 31: South Asia and Pacific Market Value (US$ Million) Forecast by Country, 2019 to 2034

Table 32: South Asia and Pacific Market Volume (Units) Forecast by Country, 2019 to 2034

Table 33: South Asia and Pacific Market Value (US$ Million) Forecast by Product Type, 2019 to 2034

Table 34: South Asia and Pacific Market Volume (Units) Forecast by Product Type, 2019 to 2034

Table 35: South Asia and Pacific Market Value (US$ Million) Forecast by Application, 2019 to 2034

Table 36: South Asia and Pacific Market Volume (Units) Forecast by Application, 2019 to 2034

Table 37: East Asia Market Value (US$ Million) Forecast by Country, 2019 to 2034

Table 38: East Asia Market Volume (Units) Forecast by Country, 2019 to 2034

Table 39: East Asia Market Value (US$ Million) Forecast by Product Type, 2019 to 2034

Table 40: East Asia Market Volume (Units) Forecast by Product Type, 2019 to 2034

Table 41: East Asia Market Value (US$ Million) Forecast by Application, 2019 to 2034

Table 42: East Asia Market Volume (Units) Forecast by Application, 2019 to 2034

Table 43: Middle East and Africa Market Value (US$ Million) Forecast by Country, 2019 to 2034

Table 44: Middle East and Africa Market Volume (Units) Forecast by Country, 2019 to 2034

Table 45: Middle East and Africa Market Value (US$ Million) Forecast by Product Type, 2019 to 2034

Table 46: Middle East and Africa Market Volume (Units) Forecast by Product Type, 2019 to 2034

Table 47: Middle East and Africa Market Value (US$ Million) Forecast by Application, 2019 to 2034

Table 48: Middle East and Africa Market Volume (Units) Forecast by Application, 2019 to 2034
Ismail Sutaria
Ismail Sutaria

Principal Consultant

Talk to Analyst

Find your sweet spots for generating winning opportunities in this market.

List of Charts

Figure 1: Global Market Value (US$ Million) by Product Type, 2024 to 2034

Figure 2: Global Market Value (US$ Million) by Application, 2024 to 2034

Figure 3: Global Market Value (US$ Million) by Region, 2024 to 2034

Figure 4: Global Market Value (US$ Million) Analysis by Region, 2019 to 2034

Figure 5: Global Market Volume (Units) Analysis by Region, 2019 to 2034

Figure 6: Global Market Value Share (%) and BPS Analysis by Region, 2024 to 2034

Figure 7: Global Market Y-o-Y Growth (%) Projections by Region, 2024 to 2034

Figure 8: Global Market Value (US$ Million) Analysis by Product Type, 2019 to 2034

Figure 9: Global Market Volume (Units) Analysis by Product Type, 2019 to 2034

Figure 10: Global Market Value Share (%) and BPS Analysis by Product Type, 2024 to 2034

Figure 11: Global Market Y-o-Y Growth (%) Projections by Product Type, 2024 to 2034

Figure 12: Global Market Value (US$ Million) Analysis by Application, 2019 to 2034

Figure 13: Global Market Volume (Units) Analysis by Application, 2019 to 2034

Figure 14: Global Market Value Share (%) and BPS Analysis by Application, 2024 to 2034

Figure 15: Global Market Y-o-Y Growth (%) Projections by Application, 2024 to 2034

Figure 16: Global Market Attractiveness by Product Type, 2024 to 2034

Figure 17: Global Market Attractiveness by Application, 2024 to 2034

Figure 18: Global Market Attractiveness by Region, 2024 to 2034

Figure 19: North America Market Value (US$ Million) by Product Type, 2024 to 2034

Figure 20: North America Market Value (US$ Million) by Application, 2024 to 2034

Figure 21: North America Market Value (US$ Million) by Country, 2024 to 2034

Figure 22: North America Market Value (US$ Million) Analysis by Country, 2019 to 2034

Figure 23: North America Market Volume (Units) Analysis by Country, 2019 to 2034

Figure 24: North America Market Value Share (%) and BPS Analysis by Country, 2024 to 2034

Figure 25: North America Market Y-o-Y Growth (%) Projections by Country, 2024 to 2034

Figure 26: North America Market Value (US$ Million) Analysis by Product Type, 2019 to 2034

Figure 27: North America Market Volume (Units) Analysis by Product Type, 2019 to 2034

Figure 28: North America Market Value Share (%) and BPS Analysis by Product Type, 2024 to 2034

Figure 29: North America Market Y-o-Y Growth (%) Projections by Product Type, 2024 to 2034

Figure 30: North America Market Value (US$ Million) Analysis by Application, 2019 to 2034

Figure 31: North America Market Volume (Units) Analysis by Application, 2019 to 2034

Figure 32: North America Market Value Share (%) and BPS Analysis by Application, 2024 to 2034

Figure 33: North America Market Y-o-Y Growth (%) Projections by Application, 2024 to 2034

Figure 34: North America Market Attractiveness by Product Type, 2024 to 2034

Figure 35: North America Market Attractiveness by Application, 2024 to 2034

Figure 36: North America Market Attractiveness by Country, 2024 to 2034

Figure 37: Latin America Market Value (US$ Million) by Product Type, 2024 to 2034

Figure 38: Latin America Market Value (US$ Million) by Application, 2024 to 2034

Figure 39: Latin America Market Value (US$ Million) by Country, 2024 to 2034

Figure 40: Latin America Market Value (US$ Million) Analysis by Country, 2019 to 2034

Figure 41: Latin America Market Volume (Units) Analysis by Country, 2019 to 2034

Figure 42: Latin America Market Value Share (%) and BPS Analysis by Country, 2024 to 2034

Figure 43: Latin America Market Y-o-Y Growth (%) Projections by Country, 2024 to 2034

Figure 44: Latin America Market Value (US$ Million) Analysis by Product Type, 2019 to 2034

Figure 45: Latin America Market Volume (Units) Analysis by Product Type, 2019 to 2034

Figure 46: Latin America Market Value Share (%) and BPS Analysis by Product Type, 2024 to 2034

Figure 47: Latin America Market Y-o-Y Growth (%) Projections by Product Type, 2024 to 2034

Figure 48: Latin America Market Value (US$ Million) Analysis by Application, 2019 to 2034

Figure 49: Latin America Market Volume (Units) Analysis by Application, 2019 to 2034

Figure 50: Latin America Market Value Share (%) and BPS Analysis by Application, 2024 to 2034

Figure 51: Latin America Market Y-o-Y Growth (%) Projections by Application, 2024 to 2034

Figure 52: Latin America Market Attractiveness by Product Type, 2024 to 2034

Figure 53: Latin America Market Attractiveness by Application, 2024 to 2034

Figure 54: Latin America Market Attractiveness by Country, 2024 to 2034

Figure 55: Western Europe Market Value (US$ Million) by Product Type, 2024 to 2034

Figure 56: Western Europe Market Value (US$ Million) by Application, 2024 to 2034

Figure 57: Western Europe Market Value (US$ Million) by Country, 2024 to 2034

Figure 58: Western Europe Market Value (US$ Million) Analysis by Country, 2019 to 2034

Figure 59: Western Europe Market Volume (Units) Analysis by Country, 2019 to 2034

Figure 60: Western Europe Market Value Share (%) and BPS Analysis by Country, 2024 to 2034

Figure 61: Western Europe Market Y-o-Y Growth (%) Projections by Country, 2024 to 2034

Figure 62: Western Europe Market Value (US$ Million) Analysis by Product Type, 2019 to 2034

Figure 63: Western Europe Market Volume (Units) Analysis by Product Type, 2019 to 2034

Figure 64: Western Europe Market Value Share (%) and BPS Analysis by Product Type, 2024 to 2034

Figure 65: Western Europe Market Y-o-Y Growth (%) Projections by Product Type, 2024 to 2034

Figure 66: Western Europe Market Value (US$ Million) Analysis by Application, 2019 to 2034

Figure 67: Western Europe Market Volume (Units) Analysis by Application, 2019 to 2034

Figure 68: Western Europe Market Value Share (%) and BPS Analysis by Application, 2024 to 2034

Figure 69: Western Europe Market Y-o-Y Growth (%) Projections by Application, 2024 to 2034

Figure 70: Western Europe Market Attractiveness by Product Type, 2024 to 2034

Figure 71: Western Europe Market Attractiveness by Application, 2024 to 2034

Figure 72: Western Europe Market Attractiveness by Country, 2024 to 2034

Figure 73: Eastern Europe Market Value (US$ Million) by Product Type, 2024 to 2034

Figure 74: Eastern Europe Market Value (US$ Million) by Application, 2024 to 2034

Figure 75: Eastern Europe Market Value (US$ Million) by Country, 2024 to 2034

Figure 76: Eastern Europe Market Value (US$ Million) Analysis by Country, 2019 to 2034

Figure 77: Eastern Europe Market Volume (Units) Analysis by Country, 2019 to 2034

Figure 78: Eastern Europe Market Value Share (%) and BPS Analysis by Country, 2024 to 2034

Figure 79: Eastern Europe Market Y-o-Y Growth (%) Projections by Country, 2024 to 2034

Figure 80: Eastern Europe Market Value (US$ Million) Analysis by Product Type, 2019 to 2034

Figure 81: Eastern Europe Market Volume (Units) Analysis by Product Type, 2019 to 2034

Figure 82: Eastern Europe Market Value Share (%) and BPS Analysis by Product Type, 2024 to 2034

Figure 83: Eastern Europe Market Y-o-Y Growth (%) Projections by Product Type, 2024 to 2034

Figure 84: Eastern Europe Market Value (US$ Million) Analysis by Application, 2019 to 2034

Figure 85: Eastern Europe Market Volume (Units) Analysis by Application, 2019 to 2034

Figure 86: Eastern Europe Market Value Share (%) and BPS Analysis by Application, 2024 to 2034

Figure 87: Eastern Europe Market Y-o-Y Growth (%) Projections by Application, 2024 to 2034

Figure 88: Eastern Europe Market Attractiveness by Product Type, 2024 to 2034

Figure 89: Eastern Europe Market Attractiveness by Application, 2024 to 2034

Figure 90: Eastern Europe Market Attractiveness by Country, 2024 to 2034

Figure 91: South Asia and Pacific Market Value (US$ Million) by Product Type, 2024 to 2034

Figure 92: South Asia and Pacific Market Value (US$ Million) by Application, 2024 to 2034

Figure 93: South Asia and Pacific Market Value (US$ Million) by Country, 2024 to 2034

Figure 94: South Asia and Pacific Market Value (US$ Million) Analysis by Country, 2019 to 2034

Figure 95: South Asia and Pacific Market Volume (Units) Analysis by Country, 2019 to 2034

Figure 96: South Asia and Pacific Market Value Share (%) and BPS Analysis by Country, 2024 to 2034

Figure 97: South Asia and Pacific Market Y-o-Y Growth (%) Projections by Country, 2024 to 2034

Figure 98: South Asia and Pacific Market Value (US$ Million) Analysis by Product Type, 2019 to 2034

Figure 99: South Asia and Pacific Market Volume (Units) Analysis by Product Type, 2019 to 2034

Figure 100: South Asia and Pacific Market Value Share (%) and BPS Analysis by Product Type, 2024 to 2034

Figure 101: South Asia and Pacific Market Y-o-Y Growth (%) Projections by Product Type, 2024 to 2034

Figure 102: South Asia and Pacific Market Value (US$ Million) Analysis by Application, 2019 to 2034

Figure 103: South Asia and Pacific Market Volume (Units) Analysis by Application, 2019 to 2034

Figure 104: South Asia and Pacific Market Value Share (%) and BPS Analysis by Application, 2024 to 2034

Figure 105: South Asia and Pacific Market Y-o-Y Growth (%) Projections by Application, 2024 to 2034

Figure 106: South Asia and Pacific Market Attractiveness by Product Type, 2024 to 2034

Figure 107: South Asia and Pacific Market Attractiveness by Application, 2024 to 2034

Figure 108: South Asia and Pacific Market Attractiveness by Country, 2024 to 2034

Figure 109: East Asia Market Value (US$ Million) by Product Type, 2024 to 2034

Figure 110: East Asia Market Value (US$ Million) by Application, 2024 to 2034

Figure 111: East Asia Market Value (US$ Million) by Country, 2024 to 2034

Figure 112: East Asia Market Value (US$ Million) Analysis by Country, 2019 to 2034

Figure 113: East Asia Market Volume (Units) Analysis by Country, 2019 to 2034

Figure 114: East Asia Market Value Share (%) and BPS Analysis by Country, 2024 to 2034

Figure 115: East Asia Market Y-o-Y Growth (%) Projections by Country, 2024 to 2034

Figure 116: East Asia Market Value (US$ Million) Analysis by Product Type, 2019 to 2034

Figure 117: East Asia Market Volume (Units) Analysis by Product Type, 2019 to 2034

Figure 118: East Asia Market Value Share (%) and BPS Analysis by Product Type, 2024 to 2034

Figure 119: East Asia Market Y-o-Y Growth (%) Projections by Product Type, 2024 to 2034

Figure 120: East Asia Market Value (US$ Million) Analysis by Application, 2019 to 2034

Figure 121: East Asia Market Volume (Units) Analysis by Application, 2019 to 2034

Figure 122: East Asia Market Value Share (%) and BPS Analysis by Application, 2024 to 2034

Figure 123: East Asia Market Y-o-Y Growth (%) Projections by Application, 2024 to 2034

Figure 124: East Asia Market Attractiveness by Product Type, 2024 to 2034

Figure 125: East Asia Market Attractiveness by Application, 2024 to 2034

Figure 126: East Asia Market Attractiveness by Country, 2024 to 2034

Figure 127: Middle East and Africa Market Value (US$ Million) by Product Type, 2024 to 2034

Figure 128: Middle East and Africa Market Value (US$ Million) by Application, 2024 to 2034

Figure 129: Middle East and Africa Market Value (US$ Million) by Country, 2024 to 2034

Figure 130: Middle East and Africa Market Value (US$ Million) Analysis by Country, 2019 to 2034

Figure 131: Middle East and Africa Market Volume (Units) Analysis by Country, 2019 to 2034

Figure 132: Middle East and Africa Market Value Share (%) and BPS Analysis by Country, 2024 to 2034

Figure 133: Middle East and Africa Market Y-o-Y Growth (%) Projections by Country, 2024 to 2034

Figure 134: Middle East and Africa Market Value (US$ Million) Analysis by Product Type, 2019 to 2034

Figure 135: Middle East and Africa Market Volume (Units) Analysis by Product Type, 2019 to 2034

Figure 136: Middle East and Africa Market Value Share (%) and BPS Analysis by Product Type, 2024 to 2034

Figure 137: Middle East and Africa Market Y-o-Y Growth (%) Projections by Product Type, 2024 to 2034

Figure 138: Middle East and Africa Market Value (US$ Million) Analysis by Application, 2019 to 2034

Figure 139: Middle East and Africa Market Volume (Units) Analysis by Application, 2019 to 2034

Figure 140: Middle East and Africa Market Value Share (%) and BPS Analysis by Application, 2024 to 2034

Figure 141: Middle East and Africa Market Y-o-Y Growth (%) Projections by Application, 2024 to 2034

Figure 142: Middle East and Africa Market Attractiveness by Product Type, 2024 to 2034

Figure 143: Middle East and Africa Market Attractiveness by Application, 2024 to 2034

Figure 144: Middle East and Africa Market Attractiveness by Country, 2024 to 2034

Recommendations

Packaging

Pharmaceutical Packaging Market

Published : January 2024

Packaging

Pharmaceutical Contract Packaging Market

Published : October 2023

Packaging

Anti-counterfeit Pharmaceutical Packaging Market

Published : October 2023

Explore Packaging Insights

View Reports

Temperature Controlled Pharmaceutical Packaging Solutions Market