Reports

- Global Locations -

Headquarters

Future Market Insights, Inc.

Christiana Corporate, 200
Continental Drive, Suite 401,
Newark, Delaware - 19713,
United States

T: +1-845-579-5705

Americas

Future Market Insights, Inc.

616 Corporate Way, Suite 2-9018,
Valley Cottage, NY 10989, United States

T: +1-347-918-3531

MEA

Future Market Insights

1602-6 Jumeirah Bay X2 Tower, Plot No: JLT-PH2-X2A,
Jumeirah Lakes Towers, Dubai,
United Arab Emirates

Europe

Future Market Insights

3rd Floor, 207 Regent Street,
W1B 3HH London
United Kingdom

T: + 44 (0) 20 8123 9659
D: +44 (0) 20 3287 4268

Asia Pacific

Future Market Insights

IndiaLand Global Tech Park, Unit UG-1, Behind Grand HighStreet, Phase 1, Hinjawadi, MH, Pune – 411057, India

Temperature Monitoring Devices Market Snapshot 2024 to 2034

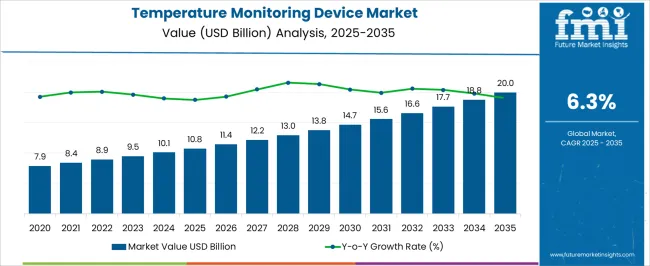
The global temperature monitoring devices market is expected to develop at a CAGR of 6.4% during the forecast period. The market value is projected to increase from US$ 10.7 billion in 2024 to US$ 17.68 billion by 2034. The market was valued at US$ 9.50 billion in 2023 and exhibited a Y-o-Y growth of 2.5% in 2022.

Market Outlook:

Temperature monitoring devices help maintain optimal temperature conditions for various applications, such as preserving product integrity, ensuring patient safety, preventing spoilage, and supporting process efficiency.

The temperature monitoring devices market is expected to experience substantial growth over the forecast period due to the increasing demand for better healthcare services and the rising adoption of wireless and digital temperature monitoring devices. Additionally, the market is anticipated to grow due to healthcare professionals' growing reliance on thermometers to assess patients' health.

Data Points Market Insights
Market Value, 2023 US$ 9.50 billion
Market Value, 2024 US$ 10.7 billion
Market Value, 2034 US$ 17.68 billion
CAGR 2024 to 2034 6.4%
Market Share of Top 5 Countries 52.7%
Key Market Players 3M, Testo AG, Terumo Corporation, Siemens AG, Rees Scientific, Omron Healthcare, Monnit Corporation, Honeywell, Deltatrack, Cosinuss GmbH, Abb Ltd., SensoScientific Inc., Omega Engineering, Kelsius Ltd., and Emerson Electric

Don't pay for what you don't need

Customize your report by selecting specific countries or regions and save 30%!

Sales Analysis of Temperature Monitoring Devices from 2019 to 2023 Vs. Market Outlook for 2024 to 2034

The sales of temperature monitoring devices expanded at a CAGR of 12.7% during the historical period; the temperature monitoring devices market has been witnessing steady growth. The market has been driven by factors such as increasing awareness about the importance of temperature monitoring in various industries, stringent regulatory requirements in sectors like healthcare and food safety, and technological advancements in temperature monitoring devices.

Data Points Market Insights
Market Value, 2023 US$ 9.50 billion
Market Value, 2019 US$ 6.81 billion
CAGR 2024 to 2034 12.7%

The COVID-19 pandemic also had an impact on the market, as temperature monitoring became crucial for screening individuals and controlling the spread of the virus. This led to a surge in demand for temperature monitoring devices, particularly infrared thermometers and contactless temperature measurement solutions.

Furthermore, it is necessary to regularly check the temperature of patients with other chronic diseases, particularly when hospitalized. This is because temperature monitoring provides an overview of how well the patient's body is functioning.

The rising patient awareness and rising health consciousness are two additional key drivers of market expansion. There is also an increase in awareness among other industries, including the chemical, food, and pharmaceutical industries. In these businesses, maintaining a certain temperature during various product development phases is a crucial step. Thus, owing to the factors mentioned above, the global temperature monitoring devices market registered a valuation of US$ 9.50 billion in 2023.

Rectum temperature monitoring, however, can hamper the growth of the market. To monitor the temperature of the rectum, a temperature catheter is introduced through the anus and several centimeters into the rectum. These devices may not be used due to issues including the prolonged monitoring period, related privacy and discomfort to the patient, the high risk of intestinal injury, and the presence of feces that prevent the thermometer from hitting the intestine wall.

Key Opportunities for the Temperature Monitoring Device Manufacturers

Increasing technical innovation has resulted in the introduction of novel products. For instance, in 2020, American Diagnostics Corporation introduced the Adtemp 429 thermometer, which monitors temperature without making direct contact with the skin and reduces the possibility of cross-contamination.

Thus, it is anticipated that rising consumer demand for quick, sensitive thermometers will help propel the market. Additionally, the production of wearable temperature monitoring devices is the main emphasis of businesses in the market for such devices.

A digital thermometer that is worn on the body measures temperature via touch or patch. It enables continuous temperature monitoring and is connected to smart devices like laptops, tablets, and mobile phones. Wearable temperature monitoring products like the Fitbit and Apple Watch, temperature strips, and temperature patches are frequently used to check the temperature.

Sabyasachi Ghosh
Sabyasachi Ghosh

Principal Consultant

Talk to Analyst

Find your sweet spots for generating winning opportunities in this market.

Comparative View of Adjacent Temperature Monitoring Devices Market

For a comparative view of temperature monitoring devices, the market is compared with the temperature sensor market and the patient monitoring devices market. The table below highlights factors that are impacting these markets.

Based on the market figure, the patient monitoring devices market is expected to register a growth of 11% by 2024 end, significantly greater than the other two markets. Moreover, the temperature monitoring devices market is expected to record a modest growth of 6.4% over the next decade.

Temperature Monitoring Devices Market:

Attributes Temperature Monitoring Devices Market
CAGR (2024 to 2034) 6.4%
Growth Factor An increase in wireless temperature solutions with the data logger in hospitals
Future Opportunities Room temperature and humidity monitors that create alerts and show accurate data for pharmaceuticals, data centers, and others

Patient Monitoring Devices Market:

Attributes Patient Monitoring Devices Market
CAGR (2024 to 2034) 11%
Growth Factor Growing demand for remote monitoring devices for patients with chronic conditions
Future Opportunities Wearable medical devices with greater connectivity present opportunities for market players

Temperature Sensor Market:

Attributes Temperature Sensor Market
CAGR (2024 to 2034) 5%
Growth Factor Surging demand for skin temperature sensors due to rising infectious disease
Future Opportunities Emergence of wireless technology and Integration of IoT to avoid hazardous incidents

Country-wise Insights

Countries CAGR
The United States 5.2%
China 4.4%
The United Kingdom 4.7%
Japan 4.1%
Germany 4.6%

Real-time Health Monitoring Devices Driving the Market in the United Kingdom

The United Kingdom holds an 18.1% share of the market in 2022 and is projected to display a lucrative CAGR of 4.7% during the forecast period.

The United Kingdom government has placed considerable emphasis on improving food safety. Temperature monitoring is a critical component of food safety, helping to prevent foodborne illness and ensuring that food is safe for consumption. This has created a significant demand for temperature monitoring devices in the food and beverage industry, which contributes to the market growth.
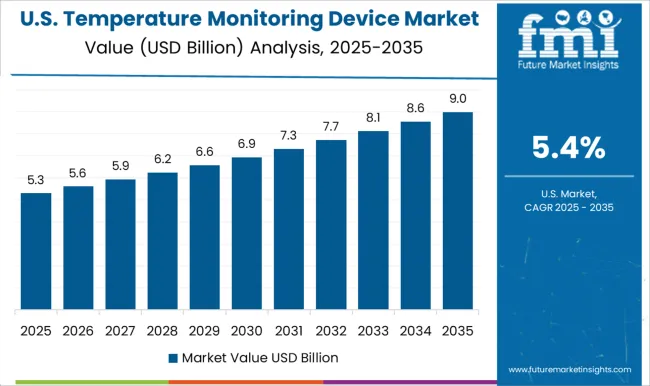
An Increase in Respiratory Disease Fueling the Demand for Telehealth Monitoring Devices

The United States temperature monitoring devices are leading in the North American region, with a market value share of 89.2% in 2022. The market is likely to record a growth of 5.2% through the forecast period.

The market is expanding due to major companies in this area, strategic alliances, and new product launches by these key players. For example, Recon Health unveiled the world's first health patch with core body temperature monitoring in December 2021, powered by the greenTEG CALERA Core Body Temperature Sensor.
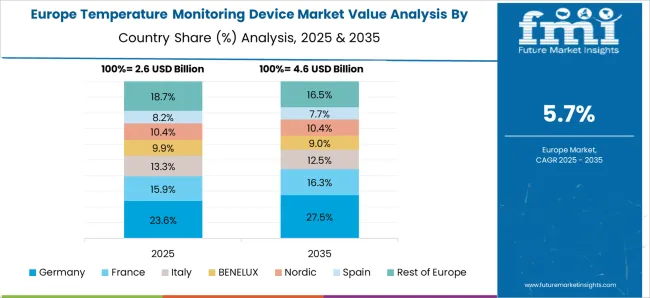
Smart Temperature Monitoring Systems Changing the Outlook of the Market in Germany

Germany is set to exhibit a CAGR of nearly 4.4% from 2024 to 2034 due to a surge in non-contact temperature sensors in cold chain, food and beverage, and pharmaceuticals, among others.

In Germany, an increase in government efforts increased funding for research and development of temperature monitoring devices, and a rise in innovative products and their approvals drives the market. Additionally, the convenience of modern healthcare systems, ongoing advancements in body temperature monitoring technology, and a considerable increase in demand for progressive healthcare facilities all contribute to the market's expansion.

Get the data you need at a Fraction of the cost

Personalize your report by choosing insights you need
and save 40%!

Category-wise Insights

Non-contact-based Temperature Monitoring Devices is Leading in the Product Category

Product Type Non-contact Temperature Monitoring
CAGR 6.0%

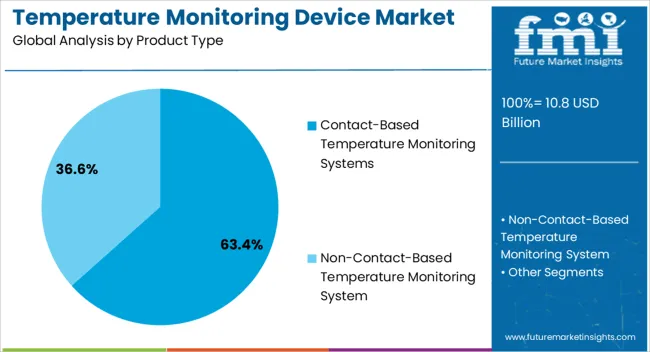
Non-contact-based temperature monitoring systems are expected to register a CAGR of 6.0% by the end of the forecast period, with a market share of about 54.3% in the global market in 2022.

The growing reliance of healthcare professionals on the use of non-contact thermometers to check patients' health conditions is likely to propel the market. The ever-increasing importance of continuous temperature monitoring and the rise in manufacturing and research and development activities are all contributing factors to the growth of the non-contact-based temperature monitoring devices market.

For instance, thirteen states of the United States have banned traditional mercury-in-glass thermometers and are encouraging the use of non-contact thermometers. The government has banned the production and distribution of mercury thermometers.

This is done to remove the possibility of glass thermometer breakage and the subsequent release of environmentally toxic mercury vapor at home. Infrared thermometer sales increased as a result of mercury thermometers being replaced by electronic models.

Oral Cavity Segment to Dominate the Temperature Monitoring Devices Market

Application Oral Cavity
CAGR 7.2%

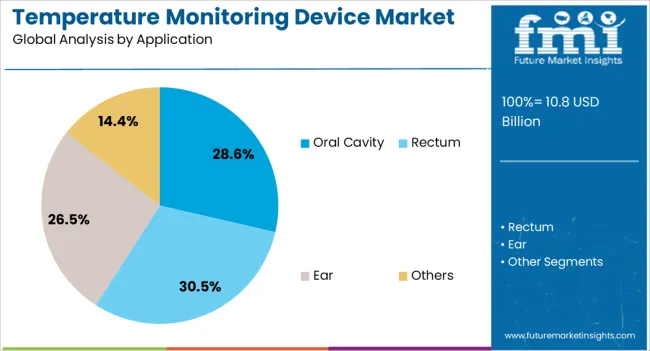
The oral cavity holds a revenue share of 48.4% in 2022 and is expected to display gradual growth, with an estimated rate of 7.2% through 2034. Oral cavity application for temperature monitoring is easy to use and comfortable for the patient. Also, they are more accurate; hence, they hold a significant share of the market.

Hospitals & Clinics is to Hold a Significant Share in the Temperature Monitoring Devices Market

End User Hospitals & Clinics
CAGR 7.3%

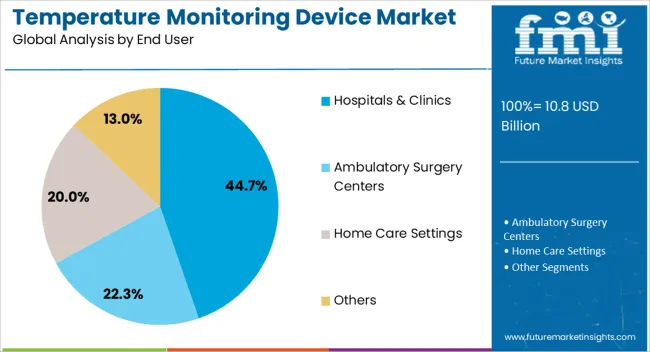
Hospitals and clinics hold the leading market share value of 42.5% in 2022. The rise in the number of government initiatives to assure a high degree of infectious disease preventive measures, as well as an increase in the use of novel body temperature monitoring equipment in hospitals and clinics, drive the growth of this segment.
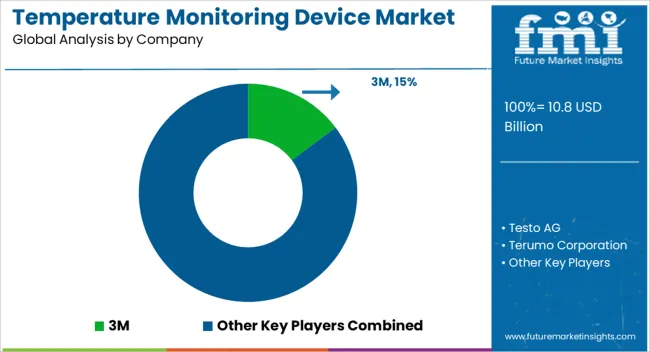
Competitive Landscape

The market for temperature monitoring devices is fragmented, and there exist several local, emerging, and established players within the market sphere.

These companies are using strategies including mergers and acquisitions, partnerships and collaborations, and new product releases to fulfill consumer demand and increase their customer base.

Recent Development

  • In 2020, the Radius T0 Continuous Thermometer was introduced by Masimo for consumers. The wearable, wireless Radius T0 measures body temperature continuously, unlike spot-check and episodic thermometers, and seamlessly transmits data and customizable temperature notifications to the consumer's smartphone.
  • In 2021, Fitgo introduced a new line of infrared thermometers with advanced technology to advance fitness and self-care among the global diaspora. The products are offered both online and offline in India and internationally. The infrared thermometer's unique features include its ability to provide accurate temperature readings in less than a second and its adaptability for use in newborns, adults, elderly people, objects, and even rooms.

Report Scope as per Temperature Monitoring Devices Industry Analysis

Attribute Details
Historical Data Available for 2019 to 2023
Forecast Period 2024 to 2034
Market Analysis US$ billion for Value, Units for Volume
Key Regions Covered North America, Latin America, Europe, South Asia, East Asia, Oceania, and Middle East & Africa
Key Countries Covered The United States, Canada, Brazil, Mexico, Argentina, The United Kingdom, Germany, Italy, Russia, Spain, France, BENELUX, India, Thailand, Indonesia, Malaysia, Japan, China, South Korea, Australia, New Zealand, Türkiye, GCC, and South Africa
Key Market Segments Covered Product Type, Application, End User, and Region
Key Companies Profiled
  • 3M
  • Testo AG
  • Terumo Corporation
  • Siemens AG
  • Rees Scientific
  • Omron Healthcare
  • Monnit Corporation
  • Honeywell
  • Deltatrack
  • Cosinuss GmbH
  • Abb Ltd.
  • SensoScientific, Inc.
  • Omega Engineering
  • Kelsius, Ltd.
  • Emerson Electric
Pricing Available upon Request

Key Market Segments Covered in Temperature Monitoring Devices Industry Research

By Product Type:

  • Contact-based Temperature Monitoring Systems
  • Non-contact-based Temperature Monitoring System

By Application:

  • Oral Cavity
  • Rectum
  • Ear
  • Others

By End User:

  • Hospitals & Clinics
  • Ambulatory surgery centers
  • Home care settings
  • Others

By Region:

  • North America
  • Latin America
  • Europe
  • South Asia
  • East Asia
  • Oceania
  • The Middle East and Africa (MEA)

Frequently Asked Questions

How Much is the Temperature Monitoring Devices Market Worth in 2023?

The global temperature monitoring devices market is worth US$ 9.50 billion in 2023.

What is the Sales Forecast for the Temperature Monitoring Devices Market Through 2034?

The temperature monitoring devices market is expected to reach US$ 17.68 billion by the end of 2034, with sales revenue expected to register a 6.4% CAGR.

What is the Key Driver in the Temperature Monitoring Devices Industry?

An increase in surgical procedures as well as the frequency of infectious diseases.

What is the Market Outlook for Temperature Monitoring Devices in China?

China is expected to register a growth of 4.4% throughout the forecast period.

At What Percentage is the Demand for Temperature Monitoring Devices Expected to Register Growth in Europe?

Demand for temperature monitoring devices in Europe is expected to register a growth of 6.4% over the next ten years.

Which Countries are Leading in the Temperature Monitoring Devices Market?

China, the United States, and the United Kingdom are the leading countries in the market.

Who are the Key Players in the Temperature Monitoring Devices Market?

3M, Testo AG, Terumo Corporation, Siemens AG, Rees Scientific, and Omron Healthcare are some key players in the temperature monitoring devices industry.

Table of Content

1. Executive Summary

    1.1. Global Market Outlook

    1.2. Demand Side Trends

    1.3. Supply Side Trends

    1.4. Market Round Offs

    1.5. FMI Analysis and Recommendations

2. Market Overview

    2.1. Market Coverage / Taxonomy

    2.2. Market Definition / Scope / Limitations

3. Market Trends & Dynamics

    3.1. Key Trends Impacting the Market

    3.2. Product Innovation / Development Trends

        3.2.1. Latest Trends and Demands

        3.2.2. Latest Innovations and New Launches

    3.3. Future Prospects of Industry

    3.4. Market Dynamics

        3.4.1. Drivers

        3.4.2. Restraints

        3.4.3. Opportunity Analysis

4. Value Added Insights

    4.1. Product Adoption / Usage Analysis

    4.2. New Product Launches

    4.3. Investment Feasibility Matrix

    4.4. PESTEL Analysis

    4.5. Porter’s Five Force Analysis

    4.6. Value Chain Analysis

5. Market Background

    5.1. Macro-Economic Factors

        5.1.1. Global GDP Growth Outlook

        5.1.2. Global Healthcare Expenditure Outlook

    5.2. Forecast Factors - Relevance & Impact

        5.2.1. Key Player’s Historic Growth

        5.2.2. Market Consolidation Activities

        5.2.3. Increasing Demand of Digital Scales

        5.2.4. New Innovations in Scales

        5.2.5. Product Adoption / Analysis Rules

        5.2.6. New Product Development & Applications

6. Global Market Demand Analysis 2012 to 2022 and Forecast, 2023 to 2033

    6.1. Historical Market Volume (Units) Analysis, 2012 to 2022

    6.2. Current and Future Market Volume (Units) Projections, 2023 to 2033

        6.2.1. Y-o-Y Growth Trend Analysis *Per Capita Consumption

7. Global Market - Pricing Analysis

    7.1. Regional Pricing Analysis By Product

    7.2. Global Average Pricing Analysis Benchmark

    7.3. Pricing Assumptions

8. Global Market Demand (in Value or Size in US$ Million) Analysis 2012 to 2022 and Forecast, 2023 to 2033

    8.1. Revenue Opportunity Scenario- Likely/Conservative/Optimistic

    8.2. Historical Market Value (US$ Million) Analysis, 2012 to 2022

    8.3. Current and Future Market Value (US$ Million) Projections, 2023 to 2033

        8.3.1. Y-o-Y Growth Trend Analysis

        8.3.2. Absolute $ Opportunity Analysis

9. Global Market Analysis 2012 to 2022 and Forecast 2023 to 2033, by Product

    9.1. Introduction / Key Findings

    9.2. Historical Market Size (US$ Million) and Volume (Units) Analysis, By Product, 2012 to 2022

    9.3. Current and Future Market Size (US$ Million) and Volume (Units) Analysis and Forecast By Product, 2023 to 2033

        9.3.1. Contact-based Temperature Monitoring Systems

        9.3.2. Non-contact-based Temperature Monitoring System

    9.4. Market Attractiveness Analysis By Product

10. Global Market Analysis 2012 to 2022 and Forecast 2023 to 2033, By Application

    10.1. Introduction / Key Findings

    10.2. Historical Market Size (US$ Million) Analysis, By Application, 2012 to 2022

    10.3. Current and Future Market Size (US$ Million) Analysis and Forecast By Application, 2023 to 2033

        10.3.1. Oral Cavity

        10.3.2. Rectum

        10.3.3. Ear

        10.3.4. Others

    10.4. Market Attractiveness Analysis By Application

11. Global Market Analysis 2012 to 2022 and Forecast 2023 to 2033, by End User

    11.1. Introduction / Key Findings

    11.2. Historical Market Size (US$ Million) Analysis, By End User, 2012 to 2022

    11.3. Current and Future Market Size (US$ Million) Analysis and Forecast By End User, 2023 to 2033

        11.3.1. Hospitals & Clinics

        11.3.2. Ambulatory surgery centers

        11.3.3. Home care settings

        11.3.4. Others

    11.4. Market Attractiveness Analysis By End User

12. Global Market Analysis 2012 to 2022 and Forecast 2023 to 2033, by Region

    12.1. Introduction

    12.2. Historical Market Size (US$ Million) Analysis, By Region, 2012 to 2022

    12.3. Current and Future Market Size (US$ Million) Analysis and Forecast By Region, 2023 to 2033

        12.3.1. North America

        12.3.2. Latin America

        12.3.3. Europe

        12.3.4. South Asia

        12.3.5. East Asia

        12.3.6. Oceania

        12.3.7. Middle East & Africa

    12.4. Market Attractiveness Analysis By Region

13. North America Market Analysis 2012 to 2022 and Forecast 2023 to 2033

    13.1. Introduction

    13.2. Historical Market Size (US$ Million) and Volume (Units) Trend Analysis By Market Taxonomy, 2012 to 2022

    13.3. Current and Future Market Size (US$ Million) and Volume (Units) Analysis and Forecast By Market Taxonomy, 2023 to 2033

        13.3.1. By Country

            13.3.1.1. USA

            13.3.1.2. Canada

        13.3.2. By Product

        13.3.3. By Application

        13.3.4. By End User

    13.4. Market Attractiveness Analysis

        13.4.1. By Country

        13.4.2. By Product

        13.4.3. By Application

        13.4.4. By End User

    13.5. Market Trends

    13.6. Market Drivers & Restraints – Impact Analysis

    13.7. Country Level Analysis & Forecast

        13.7.1. USA Market

            13.7.1.1. Introduction

            13.7.1.2. Market Analysis and Forecast by Market Taxonomy

                13.7.1.2.1. By Product

                13.7.1.2.2. By Application

                13.7.1.2.3. By End User

        13.7.2. Canada Market

            13.7.2.1. Introduction

            13.7.2.2. Market Analysis and Forecast by Market Taxonomy

                13.7.2.2.1. By Product

                13.7.2.2.2. By Application

                13.7.2.2.3. By End User

14. Latin America Market Analysis 2012 to 2022 and Forecast 2023 to 2033

    14.1. Introduction

    14.2. Historical Market Size (US$ Million) and Volume (Units) Trend Analysis By Market Taxonomy, 2012 to 2022

    14.3. Current and Future Market Size (US$ Million) and Volume (Units) Analysis and Forecast By Market Taxonomy, 2023 to 2033

        14.3.1. By Country

            14.3.1.1. Brazil

            14.3.1.2. Mexico

            14.3.1.3. Argentina

            14.3.1.4. Rest of LATAM

        14.3.2. By Product

        14.3.3. By Application

        14.3.4. By End User

    14.4. Market Attractiveness Analysis

        14.4.1. By Country

        14.4.2. By Product

        14.4.3. By Application

        14.4.4. By End User

    14.5. Market Trends

    14.6. Market Drivers & Restraints – Impact Analysis

    14.7. Country Level Analysis & Forecast

        14.7.1. Brazil Market

            14.7.1.1. Introduction

            14.7.1.2. Market Analysis and Forecast by Market Taxonomy

                14.7.1.2.1. By Product

                14.7.1.2.2. By Application

                14.7.1.2.3. By End User

        14.7.2. Mexico Market

            14.7.2.1. Introduction

            14.7.2.2. Market Analysis and Forecast by Market Taxonomy

                14.7.2.2.1. By Product

                14.7.2.2.2. By Application

                14.7.2.2.3. By End User

        14.7.3. Argentina Market

            14.7.3.1. Introduction

            14.7.3.2. Market Analysis and Forecast by Market Taxonomy

                14.7.3.2.1. By Product

                14.7.3.2.2. By Application

                14.7.3.2.3. By End User

15. Europe Market Analysis 2012 to 2022 and Forecast 2023 to 2033

    15.1. Introduction

    15.2. Historical Market Size (US$ Million) and Volume (Units) Trend Analysis By Market Taxonomy, 2012 to 2022

    15.3. Current and Future Market Size (US$ Million) and Volume (Units) Analysis and Forecast By Market Taxonomy, 2023 to 2033

        15.3.1. By Country

            15.3.1.1. UK

            15.3.1.2. Germany

            15.3.1.3. France

            15.3.1.4. Italy

            15.3.1.5. Spain

            15.3.1.6. BENELUX

            15.3.1.7. Russia

            15.3.1.8. Rest of Europe

        15.3.2. By Product

        15.3.3. By Application

        15.3.4. By End User

    15.4. Market Attractiveness Analysis

        15.4.1. By Country

        15.4.2. By Product

        15.4.3. By Application

        15.4.4. By End User

    15.5. Market Trends

    15.6. Market Drivers & Restraints – Impact Analysis

    15.7. Country Level Analysis & Forecast

        15.7.1. UK Market

            15.7.1.1. Introduction

            15.7.1.2. Market Analysis and Forecast by Market Taxonomy

                15.7.1.2.1. By Product

                15.7.1.2.2. By Application

                15.7.1.2.3. By End User

        15.7.2. Germany Market

            15.7.2.1. Introduction

            15.7.2.2. Market Analysis and Forecast by Market Taxonomy

                15.7.2.2.1. By Product

                15.7.2.2.2. By Application

                15.7.2.2.3. By End User

        15.7.3. France Market

            15.7.3.1. Introduction

            15.7.3.2. Market Analysis and Forecast by Market Taxonomy

                15.7.3.2.1. By Product

                15.7.3.2.2. By Application

                15.7.3.2.3. By End User

        15.7.4. Italy Market

            15.7.4.1. Introduction

            15.7.4.2. Market Analysis and Forecast by Market Taxonomy

                15.7.4.2.1. By Product

                15.7.4.2.2. By Application

                15.7.4.2.3. By End User

        15.7.5. Spain Market

            15.7.5.1. Introduction

            15.7.5.2. Market Analysis and Forecast by Market Taxonomy

                15.7.5.2.1. By Product

                15.7.5.2.2. By Application

                15.7.5.2.3. By End User

        15.7.6. BENELUX Market

            15.7.6.1. Introduction

            15.7.6.2. Market Analysis and Forecast by Market Taxonomy

                15.7.6.2.1. By Product

                15.7.6.2.2. By Application

                15.7.6.2.3. By End User

        15.7.7. Russia Market

            15.7.7.1. Introduction

            15.7.7.2. Market Analysis and Forecast by Market Taxonomy

                15.7.7.2.1. By Product

                15.7.7.2.2. By Application

                15.7.7.2.3. By End User

16. East Asia Market Analysis 2012 to 2022 and Forecast 2023 to 2033

    16.1. Introduction

    16.2. Historical Market Size (US$ Million) and Volume (Units) Trend Analysis By Market Taxonomy, 2012 to 2022

    16.3. Current and Future Market Size (US$ Million) and Volume (Units) Analysis and Forecast By Market Taxonomy, 2023 to 2033

        16.3.1. By Country

            16.3.1.1. China

            16.3.1.2. Japan

            16.3.1.3. South Korea

        16.3.2. By Product

        16.3.3. By Application

        16.3.4. By End User

    16.4. Market Attractiveness Analysis

        16.4.1. BY Country

        16.4.2. By Product

        16.4.3. By Application

        16.4.4. By End User

    16.5. Market Trends

    16.6. Market Drivers & Restraints – Impact Analysis

    16.7. Country Level Analysis & Forecast

        16.7.1. China Market

            16.7.1.1. Introduction

            16.7.1.2. Market Analysis and Forecast by Market Taxonomy

                16.7.1.2.1. By Product

                16.7.1.2.2. By Application

                16.7.1.2.3. By End User

        16.7.2. Japan Market

            16.7.2.1. Introduction

            16.7.2.2. Market Analysis and Forecast by Market Taxonomy

                16.7.2.2.1. By Product

                16.7.2.2.2. By Application

                16.7.2.2.3. By End User

        16.7.3. South Korea Market

            16.7.3.1. Introduction

            16.7.3.2. Market Analysis and Forecast by Market Taxonomy

                16.7.3.2.1. By Product

                16.7.3.2.2. By Application

                16.7.3.2.3. By End User

17. South Asia Market Analysis 2012 to 2022 and Forecast 2023 to 2033

    17.1. Introduction

    17.2. Historical Market Size (US$ Million) and Volume (Units) Trend Analysis By Market Taxonomy, 2012 to 2022

    17.3. Current and Future Market Size (US$ Million) and Volume (Units) Analysis and Forecast By Market Taxonomy, 2023 to 2033

        17.3.1. By Country

            17.3.1.1. India

            17.3.1.2. Indonesia

            17.3.1.3. Thailand

            17.3.1.4. Malaysia

            17.3.1.5. Rest of South Asia

        17.3.2. By Product

        17.3.3. By Application

        17.3.4. By End User

    17.4. Market Attractiveness Analysis

        17.4.1. By Country

        17.4.2. By Product

        17.4.3. By Application

        17.4.4. By End User

    17.5. Market Trends

    17.6. Market Drivers & Restraints – Impact Analysis

    17.7. Country Level Analysis & Forecast

        17.7.1. India Market

            17.7.1.1. Introduction

            17.7.1.2. Market Analysis and Forecast by Market Taxonomy

                17.7.1.2.1. By Product

                17.7.1.2.2. By Application

                17.7.1.2.3. By End User

        17.7.2. Indonesia Market

            17.7.2.1. Introduction

            17.7.2.2. Market Analysis and Forecast by Market Taxonomy

                17.7.2.2.1. By Product

                17.7.2.2.2. By Application

                17.7.2.2.3. By End User

        17.7.3. Thailand Market

            17.7.3.1. Introduction

            17.7.3.2. Market Analysis and Forecast by Market Taxonomy

                17.7.3.2.1. By Product

                17.7.3.2.2. By Application

                17.7.3.2.3. By End User

        17.7.4. Malaysia Market

            17.7.4.1. Introduction

            17.7.4.2. Market Analysis and Forecast by Market Taxonomy

                17.7.4.2.1. By Product

                17.7.4.2.2. By Application

                17.7.4.2.3. By End User

18. Oceania Market Analysis 2012 to 2022 and Forecast 2023 to 2033

    18.1. Introduction

    18.2. Historical Market Size (US$ Million) and Volume (Units) Trend Analysis By Market Taxonomy, 2012 to 2022

    18.3. Current and Future Market Size (US$ Million) and Volume (Units) Analysis and Forecast By Market Taxonomy, 2023 to 2033

        18.3.1. By Country

            18.3.1.1. Australia

            18.3.1.2. New Zealand

        18.3.2. By Product

        18.3.3. By Application

        18.3.4. By End User

    18.4. Market Attractiveness Analysis

        18.4.1. By Country

        18.4.2. By Product

        18.4.3. By Application

        18.4.4. By End User

    18.5. Market Trends

    18.6. Market Drivers & Restraints – Impact Analysis

    18.7. Country Level Analysis & Forecast

        18.7.1. Australia Market

            18.7.1.1. Introduction

            18.7.1.2. Market Analysis and Forecast by Market Taxonomy

                18.7.1.2.1. By Product

                18.7.1.2.2. By Application

                18.7.1.2.3. By End User

        18.7.2. New Zealand Market

            18.7.2.1. Introduction

            18.7.2.2. Market Analysis and Forecast by Market Taxonomy

                18.7.2.2.1. By Product

                18.7.2.2.2. By Application

                18.7.2.2.3. By End User

19. Middle East & Africa Market Analysis 2012 to 2022 and Forecast 2023 to 2033

    19.1. Introduction

    19.2. Historical Market Size (US$ Million) and Volume (Units) Trend Analysis By Market Taxonomy, 2012 to 2022

    19.3. Current and Future Market Size (US$ Million) and Volume (Units) Analysis and Forecast By Market Taxonomy, 2023 to 2033

        19.3.1. By Country

            19.3.1.1. GCC Countries

            19.3.1.2. Türkiye

            19.3.1.3. South Africa

            19.3.1.4. North Africa

            19.3.1.5. Rest of MEA

        19.3.2. By Product

        19.3.3. By Application

        19.3.4. By End User

    19.4. Market Attractiveness Analysis

        19.4.1. By Country

        19.4.2. By Product

        19.4.3. By Application

        19.4.4. By End User

    19.5. Market Trends

    19.6. Market Drivers & Restraints – Impact Analysis

    19.7. Country Level Analysis & Forecast

        19.7.1. GCC Countries Market

            19.7.1.1. Introduction

            19.7.1.2. Market Analysis and Forecast by Market Taxonomy

                19.7.1.2.1. By Product

                19.7.1.2.2. By Application

                19.7.1.2.3. By End User

        19.7.2. Türkiye Market

            19.7.2.1. Introduction

            19.7.2.2. Market Analysis and Forecast by Market Taxonomy

                19.7.2.2.1. By Product

                19.7.2.2.2. By Application

                19.7.2.2.3. By End User

        19.7.3. South Africa Market

            19.7.3.1. Introduction

            19.7.3.2. Market Analysis and Forecast by Market Taxonomy

                19.7.3.2.1. By Product

                19.7.3.2.2. By Application

                19.7.3.2.3. By End User

        19.7.4. North Africa Market

            19.7.4.1. Introduction

            19.7.4.2. Market Analysis and Forecast by Market Taxonomy

                19.7.4.2.1. By Product

                19.7.4.2.2. By Application

                19.7.4.2.3. By End User

20. Market Structure Analysis

    20.1. Market Analysis by Tier of Companies

    20.2. Market Share Analysis of Top Players

    20.3. Market Concentration

21. Competition Analysis

    21.1. Competition Dashboard

    21.2. Branding and Promotional Strategies, By Key Players

    21.3. Key Development Analysis

    21.4. Competition Deep Dive

        21.4.1. 3M

            21.4.1.1. Overview

            21.4.1.2. Product Portfolio

            21.4.1.3. Key Financials

            21.4.1.4. SWOT Analysis

            21.4.1.5. Key Developments

            21.4.1.6. Sales Footprint

            21.4.1.7. Strategy Overview

                21.4.1.7.1. Marketing Strategy

                21.4.1.7.2. Product Strategy

                21.4.1.7.3. Channel Strategy

        21.4.2. Testo AG

        21.4.3. Terumo Corporation

        21.4.4. Siemens AG

        21.4.5. Rees Scientific

        21.4.6. Omron Healthcare

        21.4.7. Monnit Corporation

        21.4.8. Honeywell

        21.4.9. Deltatrack

        21.4.10. Cosinuss GmbH

        21.4.11. Abb Ltd.

        21.4.12. SensoScientific, Inc.

        21.4.13. Omega Engineering

        21.4.14. Kelsius, Ltd.

        21.4.15. Emerson Electric

22. Assumptions and Acronyms Used

23. Research Methodology

List of Tables

Table 01: Global Market Value (US$ Million) Analysis and Forecast 2012 to 2033, by Product

Table 02: Global Market Volume (Units) Analysis and Forecast 2012 to 2033, by Product

Table 03: Global Market Value (US$ Million) Analysis and Forecast 2012 to 2033, by Application

Table 04: Global Market Value (US$ Million) Analysis and Forecast 2012 to 2033, by End User

Table 05: Global Market Value (US$ Million) Analysis and Forecast 2012 to 2033, by Region

Table 06: North America Market Value (US$ Million) Analysis 2012 to 2022 and Forecast 2023 to 2033, by Country

Table 07: North America Market Value (US$ Million) Analysis and Forecast 2012 to 2033, by Product

Table 08: North America Market Volume (Units) Analysis and Forecast 2012 to 2033, by Product

Table 09: North America Market Value (US$ Million) Analysis and Forecast 2012 to 2033, by Application

Table 10: North America Market Value (US$ Million) Analysis and Forecast 2012 to 2033, by End User

Table 11: Latin America Market Value (US$ Million) Analysis 2012 to 2022 and Forecast 2023 to 2033, by Country

Table 12: Latin America Market Value (US$ Million) Analysis and Forecast 2012 to 2033, by Product

Table 13: Latin America Market Volume (Units) Analysis and Forecast 2012 to 2033, by Product

Table 14: Latin America Market Value (US$ Million) Analysis and Forecast 2012 to 2033, by Application

Table 15: Latin America Market Value (US$ Million) Analysis and Forecast 2012 to 2033, by End User

Table 16: Europe Market Value (US$ Million) Analysis 2012 to 2022 and Forecast 2023 to 2033, by Country

Table 17: Europe Market Value (US$ Million) Analysis and Forecast 2012 to 2033, by Product

Table 18: Europe Market Volume (Units) Analysis and Forecast 2012 to 2033, by Product

Table 19: Europe Market Value (US$ Million) Analysis and Forecast 2012 to 2033, by Application

Table 20: Europe Market Value (US$ Million) Analysis and Forecast 2012 to 2033, by End User

Table 21: South Asia Market Value (US$ Million) Analysis 2012 to 2022 and Forecast 2023 to 2033, by Country

Table 22: South Asia Market Value (US$ Million) Analysis and Forecast 2012 to 2033, by Product

Table 23: South Asia Market Volume (Units) Analysis and Forecast 2012 to 2033, by Product

Table 24: South Asia Market Value (US$ Million) Analysis and Forecast 2012 to 2033, by Application

Table 25: South Asia Market Value (US$ Million) Analysis and Forecast 2012 to 2033, by End User

Table 26: East Asia Market Value (US$ Million) Analysis 2012 to 2022 and Forecast 2023 to 2033, by Country

Table 27: East Asia Market Value (US$ Million) Analysis and Forecast 2012 to 2033, by Product

Table 28: East Asia Market Volume (Units) Analysis and Forecast 2012 to 2033, by Product

Table 29: East Asia Market Value (US$ Million) Analysis and Forecast 2012 to 2033, by Application

Table 30: East Asia Market Value (US$ Million) Analysis and Forecast 2012 to 2033, by End User

Table 31: Oceania Market Value (US$ Million) Analysis 2012 to 2022 and Forecast 2023 to 2033, by Country

Table 32: Oceania Market Value (US$ Million) Analysis and Forecast 2012 to 2033, by Product

Table 33: Oceania Market Volume (Units) Analysis and Forecast 2012 to 2033, by Product

Table 34: Oceania Market Value (US$ Million) Analysis and Forecast 2012 to 2033, by Application

Table 35: Oceania Market Value (US$ Million) Analysis and Forecast 2012 to 2033, by End User

Table 36: Middle East & Africa Market Value (US$ Million) Analysis 2012 to 2022 and Forecast 2023 to 2033, by Country

Table 37: Middle East & Africa Market Value (US$ Million) Analysis and Forecast 2012 to 2033, by Product

Table 38: Middle East & Africa Market Volume (Units) Analysis and Forecast 2012 to 2033, by Product

Table 39: Middle East & Africa Market Value (US$ Million) Analysis and Forecast 2012 to 2033, by Application

Table 40: Middle East & Africa Market Value (US$ Million) Analysis and Forecast 2012 to 2033, by End User

List of Charts

Figure 01: Global Market Volume (Units), 2012 to 2022

Figure 02: Global Market Volume (Units) & Y-o-Y Growth (%) Analysis, 2023 to 2033

Figure 03: Pricing Analysis per unit (US$), in 2023

Figure 04: Pricing Forecast per unit (US$), in 2033

Figure 05: Global Market Value (US$ Million) Analysis, 2012 to 2022

Figure 06: Global Market Forecast & Y-o-Y Growth, 2023 to 2033

Figure 07: Global Market Absolute $ Opportunity (US$ Million) Analysis, 2022 to 2033

Figure 08: Global Market Value Share (%) Analysis 2023 to 2033, by Product

Figure 09: Global Market Y-o-Y Growth (%) Analysis 2022 to 2033, by Product

Figure 10: Global Market Attractiveness Analysis 2023 to 2033, by Product

Figure 11: Global Market Value Share (%) Analysis 2023 to 2033, by Application

Figure 12: Global Market Y-o-Y Growth (%) Analysis 2022 to 2033, by Application

Figure 13: Global Market Attractiveness Analysis 2023 to 2033, by Application

Figure 14: Global Market Value Share (%) Analysis 2023 to 2033, by End User

Figure 15: Global Market Y-o-Y Growth (%) Analysis 2022 to 2033, by End User

Figure 16: Global Market Attractiveness Analysis 2023 to 2033, by End User

Figure 17: Global Market Value Share (%) Analysis 2023 to 2033, by Region

Figure 18: Global Market Y-o-Y Growth (%) Analysis 2022 to 2033, by Region

Figure 19: Global Market Attractiveness Analysis 2023 to 2033, by Region

Figure 20: North America Market Value (US$ Million) Analysis, 2012 to 2022

Figure 21: North America Market Value (US$ Million) Forecast, 2023 to 2033

Figure 22: North America Market Value Share, by Product (2023 E)

Figure 23: North America Market Value Share, by Application (2023 E)

Figure 24: North America Market Value Share, by End User (2023 E)

Figure 25: North America Market Value Share, by Country (2023 E)

Figure 26: North America Market Attractiveness Analysis by Product, 2023 to 2033

Figure 27: North America Market Attractiveness Analysis by Application, 2023 to 2033

Figure 28: North America Market Attractiveness Analysis by End User, 2023 to 2033

Figure 29: North America Market Attractiveness Analysis by Country, 2023 to 2033

Figure 30: USA Market Value Proportion Analysis, 2022

Figure 31: Global Vs. USA Growth Comparison

Figure 32: USA Market Share Analysis (%) by Product, 2022 to 2033

Figure 33: USA Market Share Analysis (%) by Application, 2022 to 2033

Figure 34: USA Market Share Analysis (%) by End User, 2022 to 2033

Figure 35: Canada Market Value Proportion Analysis, 2022

Figure 36: Global Vs. Canada. Growth Comparison

Figure 37: Canada Market Share Analysis (%) by Product, 2022 to 2033

Figure 38: Canada Market Share Analysis (%) by Application, 2022 to 2033

Figure 39: Canada Market Share Analysis (%) by End User, 2022 to 2033

Figure 40: Latin America Market Value (US$ Million) Analysis, 2012 to 2022

Figure 41: Latin America Market Value (US$ Million) Forecast, 2023 to 2033

Figure 42: Latin America Market Value Share, by Product (2023 E)

Figure 43: Latin America Market Value Share, by Application (2023 E)

Figure 44: Latin America Market Value Share, by End User (2023 E)

Figure 45: Latin America Market Value Share, by Country (2023 E)

Figure 46: Latin America Market Attractiveness Analysis by Product, 2023 to 2033

Figure 47: Latin America Market Attractiveness Analysis by Application, 2023 to 2033

Figure 48: Latin America Market Attractiveness Analysis by End User, 2023 to 2033

Figure 49: Latin America Market Attractiveness Analysis by Country, 2023 to 2033

Figure 50: Mexico Market Value Proportion Analysis, 2022

Figure 51: Global Vs Mexico Growth Comparison

Figure 52: Mexico Market Share Analysis (%) by Product, 2022 to 2033

Figure 53: Mexico Market Share Analysis (%) by Application, 2022 to 2033

Figure 54: Mexico Market Share Analysis (%) by End User, 2022 to 2033

Figure 55: Brazil Market Value Proportion Analysis, 2022

Figure 56: Global Vs. Brazil. Growth Comparison

Figure 57: Brazil Market Share Analysis (%) by Product, 2022 to 2033

Figure 58: Brazil Market Share Analysis (%) by Application, 2022 to 2033

Figure 59: Brazil Market Share Analysis (%) by End User, 2022 to 2033

Figure 60: Argentina Market Value Proportion Analysis, 2022

Figure 61: Global Vs Argentina Growth Comparison

Figure 62: Argentina Market Share Analysis (%) by Product, 2022 to 2033

Figure 63: Argentina Market Share Analysis (%) by Application, 2022 to 2033

Figure 64: Argentina Market Share Analysis (%) by End User, 2022 to 2033

Figure 65: Europe Market Value (US$ Million) Analysis, 2012 to 2022

Figure 66: Europe Market Value (US$ Million) Forecast, 2023 to 2033

Figure 67: Europe Market Value Share, by Product (2023 E)

Figure 68: Europe Market Value Share, by Application (2023 E)

Figure 69: Europe Market Value Share, by End User (2023 E)

Figure 70: Europe Market Value Share, by Country (2023 E)

Figure 71: Europe Market Attractiveness Analysis by Product, 2023 to 2033

Figure 72: Europe Market Attractiveness Analysis by Application, 2023 to 2033

Figure 73: Europe Market Attractiveness Analysis by End User, 2023 to 2033

Figure 74: Europe Market Attractiveness Analysis by Country, 2023 to 2033

Figure 75: UK Market Value Proportion Analysis, 2022

Figure 76: Global Vs. UK Growth Comparison

Figure 77: UK Market Share Analysis (%) by Product, 2022 to 2033

Figure 78: UK Market Share Analysis (%) by Application, 2022 to 2033

Figure 79: UK Market Share Analysis (%) by End User, 2022 to 2033

Figure 80: Germany Market Value Proportion Analysis, 2022

Figure 81: Global Vs. Germany Growth Comparison

Figure 82: Germany Market Share Analysis (%) by Product, 2022 to 2033

Figure 83: Germany Market Share Analysis (%) by Application, 2022 to 2033

Figure 84: Germany Market Share Analysis (%) by End User, 2022 to 2033

Figure 85: Italy Market Value Proportion Analysis, 2022

Figure 86: Global Vs. Italy Growth Comparison

Figure 87: Italy Market Share Analysis (%) by Product, 2022 to 2033

Figure 88: Italy Market Share Analysis (%) by Application, 2022 to 2033

Figure 89: Italy Market Share Analysis (%) by End User, 2022 to 2033

Figure 90: France Market Value Proportion Analysis, 2022

Figure 91: Global Vs France Growth Comparison

Figure 92: France Market Share Analysis (%) by Product, 2022 to 2033

Figure 93: France Market Share Analysis (%) by Application, 2022 to 2033

Figure 94: France Market Share Analysis (%) by End User, 2022 to 2033

Figure 95: Spain Market Value Proportion Analysis, 2022

Figure 96: Global Vs Spain Growth Comparison

Figure 97: Spain Market Share Analysis (%) by Product, 2022 to 2033

Figure 98: Spain Market Share Analysis (%) by Application, 2022 to 2033

Figure 99: Spain Market Share Analysis (%) by End User, 2022 to 2033

Figure 100: Russia Market Value Proportion Analysis, 2022

Figure 101: Global Vs Russia Growth Comparison

Figure 102: Russia Market Share Analysis (%) by Product, 2022 to 2033

Figure 103: Russia Market Share Analysis (%) by Application, 2022 to 2033

Figure 104: Russia Market Share Analysis (%) by End User, 2022 to 2033

Figure 105: BENELUX Market Value Proportion Analysis, 2022

Figure 106: Global Vs BENELUX Growth Comparison

Figure 107: BENELUX Market Share Analysis (%) by Product, 2022 to 2033

Figure 108: BENELUX Market Share Analysis (%) by Application, 2022 to 2033

Figure 109: BENELUX Market Share Analysis (%) by End User, 2022 to 2033

Figure 110: East Asia Market Value (US$ Million) Analysis, 2012 to 2022

Figure 111: East Asia Market Value (US$ Million) Forecast, 2023 to 2033

Figure 112: East Asia Market Value Share, by Product (2023 E)

Figure 113: East Asia Market Value Share, by Application (2023 E)

Figure 114: East Asia Market Value Share, by End User (2023 E)

Figure 115: East Asia Market Value Share, by Country (2023 E)

Figure 116: East Asia Market Attractiveness Analysis by Product, 2023 to 2033

Figure 117: East Asia Market Attractiveness Analysis by Application, 2023 to 2033

Figure 118: East Asia Market Attractiveness Analysis by End User, 2023 to 2033

Figure 119: East Asia Market Attractiveness Analysis by Country, 2023 to 2033

Figure 120: China Market Value Proportion Analysis, 2022

Figure 121: Global Vs. China Growth Comparison

Figure 122: China Market Share Analysis (%) by Product, 2022 to 2033

Figure 123: China Market Share Analysis (%) by Application, 2022 to 2033

Figure 124: China Market Share Analysis (%) by End User, 2022 to 2033

Figure 125: Japan Market Value Proportion Analysis, 2022

Figure 126: Global Vs. Japan Growth Comparison

Figure 127: Japan Market Share Analysis (%) by Product, 2022 to 2033

Figure 128: Japan Market Share Analysis (%) by Application, 2022 to 2033

Figure 129: Japan Market Share Analysis (%) by End User, 2022 to 2033

Figure 130: South Korea Market Value Proportion Analysis, 2022

Figure 131: Global Vs South Korea Growth Comparison

Figure 132: South Korea Market Share Analysis (%) by Product, 2022 to 2033

Figure 133: South Korea Market Share Analysis (%) by Application, 2022 to 2033

Figure 134: South Korea Market Share Analysis (%) by End User, 2022 to 2033

Figure 135: South Asia Market Value (US$ Million) Analysis, 2012 to 2022

Figure 136: South Asia Market Value (US$ Million) Forecast, 2023 to 2033

Figure 137: South Asia Market Value Share, by Product (2023 E)

Figure 138: South Asia Market Value Share, by Application (2023 E)

Figure 139: South Asia Market Value Share, by End User (2023 E)

Figure 140: South Asia Market Value Share, by Country (2023 E)

Figure 141: South Asia Market Attractiveness Analysis by Product, 2023 to 2033

Figure 142: South Asia Market Attractiveness Analysis by Application, 2023 to 2033

Figure 143: South Asia Market Attractiveness Analysis by End User, 2023 to 2033

Figure 144: South Asia Market Attractiveness Analysis by Country, 2023 to 2033

Figure 145: India Market Value Proportion Analysis, 2022

Figure 146: Global Vs. India Growth Comparison

Figure 147: India Market Share Analysis (%) by Product, 2022 to 2033

Figure 148: India Market Share Analysis (%) by Application, 2022 to 2033

Figure 149: India Market Share Analysis (%) by End User, 2022 to 2033

Figure 150: Indonesia Market Value Proportion Analysis, 2022

Figure 151: Global Vs. Indonesia Growth Comparison

Figure 152: Indonesia Market Share Analysis (%) by Product, 2022 to 2033

Figure 153: Indonesia Market Share Analysis (%) by Application, 2022 to 2033

Figure 154: Indonesia Market Share Analysis (%) by End User, 2022 to 2033

Figure 155: Malaysia Market Value Proportion Analysis, 2022

Figure 156: Global Vs. Malaysia Growth Comparison

Figure 157: Malaysia Market Share Analysis (%) by Product, 2022 to 2033

Figure 158: Malaysia Market Share Analysis (%) by Application, 2022 to 2033

Figure 159: Malaysia Market Share Analysis (%) by End User, 2022 to 2033

Figure 160: Thailand Market Value Proportion Analysis, 2022

Figure 161: Global Vs. Thailand Growth Comparison

Figure 162: Thailand Market Share Analysis (%) by Product, 2022 to 2033

Figure 163: Thailand Market Share Analysis (%) by Application, 2022 to 2033

Figure 164: Thailand Market Share Analysis (%) by End User, 2022 to 2033

Figure 165: Oceania Market Value (US$ Million) Analysis, 2012 to 2022

Figure 166: Oceania Market Value (US$ Million) Forecast, 2023 to 2033

Figure 167: Oceania Market Value Share, by Product (2023 E)

Figure 168: Oceania Market Value Share, by Application (2023 E)

Figure 169: Oceania Market Value Share, by End User (2023 E)

Figure 170: Oceania Market Value Share, by Country (2023 E)

Figure 171: Oceania Market Attractiveness Analysis by Product, 2023 to 2033

Figure 172: Oceania Market Attractiveness Analysis by Application, 2023 to 2033

Figure 173: Oceania Market Attractiveness Analysis by End User, 2023 to 2033

Figure 174: Oceania Market Attractiveness Analysis by Country, 2023 to 2033

Figure 175: Australia Market Value Proportion Analysis, 2022

Figure 176: Global Vs. Australia Growth Comparison

Figure 177: Australia Market Share Analysis (%) by Product, 2022 to 2033

Figure 178: Australia Market Share Analysis (%) by Application, 2022 to 2033

Figure 179: Australia Market Share Analysis (%) by End User, 2022 to 2033

Figure 180: New Zealand Market Value Proportion Analysis, 2022

Figure 181: Global Vs New Zealand Growth Comparison

Figure 182: New Zealand Market Share Analysis (%) by Product, 2022 to 2033

Figure 183: New Zealand Market Share Analysis (%) by Application, 2022 to 2033

Figure 184: New Zealand Market Share Analysis (%) by End User, 2022 to 2033

Figure 185: Middle East & Africa Market Value (US$ Million) Analysis, 2012 to 2022

Figure 186: Middle East & Africa Market Value (US$ Million) Forecast, 2023 to 2033

Figure 187: Middle East & Africa Market Value Share, by Product (2023 E)

Figure 188: Middle East & Africa Market Value Share, by Application (2023 E)

Figure 189: Middle East & Africa Market Value Share, by End User (2023 E)

Figure 190: Middle East & Africa Market Value Share, by Country (2023 E)

Figure 191: Middle East & Africa Market Attractiveness Analysis by Product, 2023 to 2033

Figure 192: Middle East & Africa Market Attractiveness Analysis by Application, 2023 to 2033

Figure 193: Middle East & Africa Market Attractiveness Analysis by End User, 2023 to 2033

Figure 194: Middle East & Africa Market Attractiveness Analysis by Country, 2023 to 2033

Figure 195: GCC Countries Market Value Proportion Analysis, 2022

Figure 196: Global Vs GCC Countries Growth Comparison

Figure 197: GCC Countries Market Share Analysis (%) by Product, 2022 to 2033

Figure 198: GCC Countries Market Share Analysis (%) by Application, 2022 to 2033

Figure 199: GCC Countries Market Share Analysis (%) by End User, 2022 to 2033

Figure 200: Türkiye Market Value Proportion Analysis, 2022

Figure 201: Global Vs. Türkiye Growth Comparison

Figure 202: Türkiye Market Share Analysis (%) by Product, 2022 to 2033

Figure 203: Türkiye Market Share Analysis (%) by Application, 2022 to 2033

Figure 204: Türkiye Market Share Analysis (%) by End User, 2022 to 2033

Figure 205: South Africa Market Value Proportion Analysis, 2022

Figure 206: Global Vs. South Africa Growth Comparison

Figure 207: South Africa Market Share Analysis (%) by Product, 2022 to 2033

Figure 208: South Africa Market Share Analysis (%) by Application, 2022 to 2033

Figure 209: South Africa Market Share Analysis (%) by End User, 2022 to 2033

Figure 210: North Africa Market Value Proportion Analysis, 2022

Figure 211: Global Vs North Africa Growth Comparison

Figure 212: North Africa Market Share Analysis (%) by Product, 2022 to 2033

Figure 213: North Africa Market Share Analysis (%) by Application, 2022 to 2033

Figure 214: North Africa Market Share Analysis (%) by End User, 2022 to 2033

Recommendations

Healthcare

Patient Monitoring Devices Market

Published : December 2022

Industrial Automation

Temperature Sensors Market

Published : November 2022

Explore Healthcare Insights

View Reports

Temperature Monitoring Device Market