Temperature Loggers Market Size and Share Forecast Outlook 2025 to 2035

The temperature loggers market is projected to grow from USD 2.2 billion in 2025 to USD 3.9 billion by 2035, registering a CAGR of 5.7% during the forecast period. Sales in 2024 reached USD 2.0 billion. Demand has been driven by rising cold chain operations across pharmaceuticals, food, and biotech industries.

Quick Stats of Temperature Loggers Market

  • Market Value (2025): USD 2.2 billion
  • Forecast Value (2035): USD 3.9 billion
  • Forecast CAGR: 5.7%
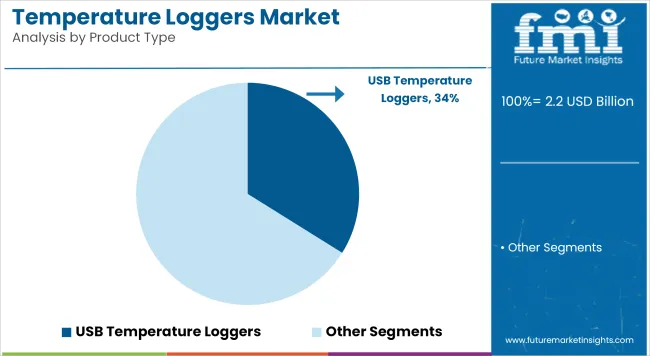
  • Product Leader in 2025: USB Temperature Loggers (33.9% market share)
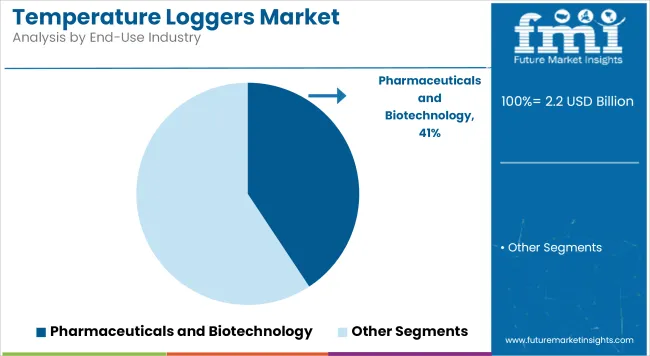
  • Top End Use: Pharmaceuticals and Biotechnology (40.7% share)
  • Key Growth Country: North America (USA is the fastest-growing market with 5.8% CAGR)
Metric Value
Market Size in 2025 USD 2.2 billion
Projected Market Size in 2035 USD 3.9 billion
CAGR (2025 to 2035) 5.7%

Enhanced traceability and real-time monitoring have remained essential for compliance with health safety protocols. Expansion of vaccine distribution networks and biologic shipments has played a key role in influencing purchasing decisions. The increasing importance of end-to-end temperature-sensitive logistics in emerging markets has pushed demand.

In 2023, Tive, the global leader in real-time end-to-end shipment visibility solutions, announced reduced pricing for the revolutionary Tive Tag a reusable, cloud-enabled temperature logger in the form of a thin, flexible shipping label. “We have made tremendous technological advancements with Tive Tag in the last few months, all of which have enabled us to reduce the cost of manufacturing and we are passing those savings on to our customers,” says Krenar Komoni, Founder & CEO of Tive. “As the most affordable temperature logger available in the world, Tive Tag empowers all perishable and cold chain shippers to fully protect their delicate cargo from start to finish.”

The temperature loggers market has been significantly influenced by the increasing demand for sustainable and environmentally friendly monitoring solutions. Manufacturers have been transitioning towards recyclable and biodegradable materials to align with environmental sustainability goals and meet regulatory requirements.

Innovations in sensor technologies have led to the development of devices that not only provide superior accuracy but also minimize environmental impact. Advancements in manufacturing technologies have enabled the production of lightweight and durable temperature loggers, catering to a wide range of applications across different industries.

Future demand for temperature loggers is expected to be led by biopharma cold chain expansion and real-time diagnostics for biologic drugs and high-value foods. Industry players are likely to compete through advanced sensor accuracy, remote calibration, and cloud analytics integration. Strategic emphasis will continue on cost optimization, network automation, and battery-free sensor designs.

Asia-Pacific is forecasted to gain significant momentum due to rising vaccine manufacturing and medical logistics. M&A activity is expected to target sensor firms and software providers for end-to-end logging solutions. Regulatory audits and real-time temperature validation in high-risk sectors are forecasted to drive premium logger adoption. Growth potential also exists in micro-loggers for single-dose shipments.

Analyzing Temperature Loggers Market by Top Investment Segment

The market is segmented based on product type, application type, end-use industry, and region. By product type, it includes single-use temperature loggers, reusable temperature loggers, wireless/Bluetooth temperature loggers, USB temperature loggers, and real-time GPS-enabled temperature loggers. These devices cater to varying monitoring needs across mobility and storage phases.

By application type, segments include cold chain monitoring, warehouse & storage, in-transit monitoring, laboratory & freezer monitoring, and HVAC system monitoring. Key end-use industries comprise pharmaceuticals & biotechnology, food & beverage, chemicals, logistics & supply chain, agriculture & floriculture, and electronics. Regional segmentation includes North America, Latin America, East Asia, South Asia & Pacific, Eastern Europe, Western Europe, Oceania, and the Middle East & Africa.

USB Loggers Preferred for Their Portability and Universal Compatibility

USB temperature loggers are projected to dominate the market with a 33.9% share in 2025, owing to their ease of use, compact form factor, and direct data accessibility without specialized software. These loggers have been extensively adopted in cold chain monitoring and short-duration shipments. They have enabled temperature-sensitive sectors to ensure product integrity through simple plug-and-play validation at delivery points. USB models have been preferred for their cost-effectiveness in both single-use and multi-use formats.

Pharmaceuticals, food logistics, and clinical trials have increasingly utilized USB loggers for real-time alerts and post-trip compliance auditing. Device durability and onboard memory storage have further boosted their appeal in dynamic transit environments. Continued demand for regulatory traceability and lightweight shipment monitoring tools is expected to drive the preference for USB-based loggers in both developed and emerging markets.
Temperature Loggers Market Analysis By Product Type

Pharmaceuticals and Biotechnology Segment Leads Due to Cold Chain Mandates

The pharmaceuticals and biotechnology sector is anticipated to hold 40.7% of the temperature loggers market in 2025, driven by the rising need for precision monitoring of temperature-sensitive biologics and vaccines. Stringent GDP and GxP regulations have mandated real-time thermal data capture across global supply routes. Loggers have been widely implemented in vaccine distribution, cell and gene therapy logistics, and biopharma clinical trials. Specialized packaging solutions integrated with temperature tracking have become standard for regulatory compliance.

USB and real-time GPS loggers have enabled end-to-end thermal mapping for high-value shipments under strict time and temperature controls. These solutions have minimized spoilage risk and improved visibility during multimodal transit. With increased investment in biologics, global immunization efforts, and cold chain infrastructure, temperature loggers are expected to remain indispensable tools in the pharmaceutical logistics ecosystem.
Temperature Loggers Market Analysis By End Use Industry

Challenges and Opportunities

Challenges

Calibration Accuracy, Connectivity Issues, and Industry-Specific Compliance

Maintaining high-calibration accuracy for an extended period is necessary for predictable behavior at different middays, which is essential for applications ranging from Pharmaceuticals to food security and cold chain logistics, but comes at the trade of repeated recalibrations and quality checks. Another challenge might be the reliability of connectivity, for example in remote or mobile environments where maintaining data synchronization might be delayed or interrupted.

Temperature loggers have to comply with industry-specific standards such as the FDA 21 CFR Part 11, WHO GDP, or EN 12830, which can significantly drive up certification costs and also make integration challenging for smaller manufacturers.

Opportunities

Cold Chain Expansion, Real-Time Monitoring, and IoT Integration

However, the market is steadily growing owing to the grow consumption of cold chain infrastructure across the globe, especially by vaccines, biologics, and perishable food products. Temperature loggers keep logistics, manufacturing, and storage environments safe and compliant. You are also witnessing an increase in their usage for HVAC systems, environmental monitoring and industrial automation etc.

Opportunities The prospects are continuously increasing with the emerging IoT-powered loggers, wireless data transmission, and cloud-based monitoring tools. Firms are putting money into USB-based plug-and-play apparatuses, Bluetooth-appropriate loggers, and constant caution frameworks that trigger activity when temperature creeps past foreordained points of confinement.

Multi-sensor data logging, such as humidity, pressure, and location, is increasingly in demand most notably for high-value supply chains and regulatory-sensitive industries.

Country-Wise Outlook

United States

The USA dominates the global market because of its developed pharmaceutical logistics network, adherence to stringent FDA and CDC guidelines, and speedy digitization of cold-storage/refrigerated transport systems. Bluetooth and Wi-Fi-based loggers for real-time monitoring are increasingly being adopted across healthcare, food service, and aerospace sectors.

Country CAGR (2025 to 2035)
USA 5.8%

United Kingdom

In the UK, increased adoption is driven by demand for tracking temperature-sensitive medications, post-Brexit trade compliance, and digitally integrated food distribution. Automated auditing and mobile dashboard alerts, particularly for perishable goods and vaccine delivery, are the focus of companies.

Country CAGR (2025 to 2035)
UK 5.6%

European Union

EU countries are GDP compliance and temperature-intelligent products. France, Germany, and the Netherlands are spending out lots in smart warehouse technologies themselves, starting with temperature loggers extensively used in pharmaceutical, biotech, and organic food export.

Region CAGR (2025 to 2035)
EU 5.7%

Japan

Adding its own high-precision temperature logging to production and storage systems, Japan’s advanced electronics and pharmaceutical sectors Compact, programmable loggers are being employed more in biotech manufacturing, medical transport, and vaccine monitoring.

Country CAGR (2025 to 2035)
Japan 5.7%

South Korea

Multi-point and real-time monitoring solutions are in high demand due to South Korea’s booming biopharma exports, semiconductor manufacturing, and intelligent logistics infrastructure. IoT-based temperature control systems are being promoted by startups and government-backed initiatives to create an efficient supply chain.

Country CAGR (2025 to 2035)
South Korea 5.8%

Competitive Outlook

Demand for temperature loggers is surging in segments such as cold chain logistics, pharmaceuticals, food safety, and industrial process monitoring which is driving the growth of the temperature loggers market. Wireless data loggers, NFC/RFID enabled devices, and cloud-synced analytics are being spurred by the need for real-time visibility, global transport regulation compliance, and IoT integration.

As a result, companies are investing in disposable and multi-use loggers, temperature-humidity combined sensors and ultra-low temperature tracking for biologics and vaccines. Accuracy, data integrity, and connectivity continue to dominate the concerns of sensor manufacturers and supply chain technology providers.

Key Players

  • DeltaTrak Inc. - FlashTrak cloud loggers with real-time visibility and multi-sensor support
  • LogTag Recorders - Cost-effective temperature recorders with preconfigured trip profiles
  • Temptime (Zebra Technologies) - Vaccine monitoring indicators with NFC scan reporting
  • Hanwell Solutions Ltd. - Wireless environmental monitoring with long-range radio sensors
  • MadgeTech, Inc. - Data loggers for lab and industrial use with programmable alarm thresholds

Temperature Loggers Market Segmentation

By Product Type:

  • Single-Use Temperature Loggers
  • Reusable Temperature Loggers
  • Wireless/Bluetooth Temperature Loggers
  • USB Temperature Loggers
  • Real-Time GPS-Enabled Temperature Loggers

By Application Type:

  • Cold Chain Monitoring
  • Warehouse & Storage
  • In-Transit Monitoring
  • Laboratory & Freezer Monitoring
  • HVAC System Monitoring

By End-Use Industry:

  • Pharmaceuticals and Biotechnology
  • Food and Beverages
  • Chemicals
  • Logistics and Supply Chain
  • Agriculture and Floriculture
  • Electronics

By Region:

  • North America
  • Latin America
  • East Asia
  • South Asia & Pacific
  • Eastern Europe
  • Western Europe
  • Oceania
  • Middle East & Africa

Table of Content

  1. Executive Summary
    • Global Market Outlook
    • Demand-side Trends
    • Supply-side Trends
    • Technology Roadmap Analysis
    • Analysis and Recommendations
  2. Market Overview
    • Market Coverage / Taxonomy
    • Market Definition / Scope / Limitations
  3. Market Background
    • Market Dynamics
      • Drivers
      • Restraints
      • Opportunity
      • Trends
    • Scenario Forecast
      • Demand in Optimistic Scenario
      • Demand in Likely Scenario
      • Demand in Conservative Scenario
    • Opportunity Map Analysis
    • Product Life Cycle Analysis
    • Supply Chain Analysis
      • Supply Side Participants and their Roles
        • Manufacturers
        • Mid-Level Participants
        • Wholesalers and Distributors
      • Value Added and Value Created at Node in the Supply Chain
      • List of Raw Material Suppliers
      • List of Existing and Potential Buyer’s
    • Investment Feasibility Matrix
    • Value Chain Analysis
      • Profit Margin Analysis
      • Wholesalers and Distributors
      • Retailers
    • PESTLE and Porter’s Analysis
    • Regulatory Landscape
      • By Key Regions
      • By Key Countries
    • Regional Parent Market Outlook
    • Production and Consumption Statistics
    • Import and Export Statistics
  4. Global Market Analysis 2020 to 2024 and Forecast, 2025 to 2035
    • Historical Market Size Value (USD Million) & Volume (Units) Analysis, 2020 to 2024
    • Current and Future Market Size Value (USD Million) & Volume (Units) Projections, 2025 to 2035
      • Y-o-Y Growth Trend Analysis
      • Absolute $ Opportunity Analysis
  5. Global Market Pricing Analysis 2020 to 2024 and Forecast 2025 to 2035
  6. Global Market Analysis 2020 to 2024 and Forecast 2025 to 2035, By Product Type
    • Introduction / Key Findings
    • Historical Market Size Value (USD Million) & Volume (Units) Analysis By Product Type, 2020 to 2024
    • Current and Future Market Size Value (USD Million) & Volume (Units) Analysis and Forecast By Product Type, 2025 to 2035
      • Single-Use Temperature Loggers
      • Reusable Temperature Loggers
      • Wireless/Bluetooth Temperature Loggers
      • USB Temperature Loggers
      • Real-Time GPS-Enabled Temperature Loggers
    • Y-o-Y Growth Trend Analysis By Product Type, 2020 to 2024
    • Absolute $ Opportunity Analysis By Product Type, 2025 to 2035
  7. Global Market Analysis 2020 to 2024 and Forecast 2025 to 2035, By Application Type
    • Introduction / Key Findings
    • Historical Market Size Value (USD Million) & Volume (Units) Analysis By Application Type, 2020 to 2024
    • Current and Future Market Size Value (USD Million) & Volume (Units) Analysis and Forecast By Application Type, 2025 to 2035
      • Cold Chain Monitoring
      • Warehouse & Storage
      • In-Transit Monitoring
      • Laboratory & Freezer Monitoring
      • HVAC System Monitoring
    • Y-o-Y Growth Trend Analysis By Application Type, 2020 to 2024
    • Absolute $ Opportunity Analysis By Application Type, 2025 to 2035
  8. Global Market Analysis 2020 to 2024 and Forecast 2025 to 2035, By End-Use Industry
    • Introduction / Key Findings
    • Historical Market Size Value (USD Million) & Volume (Units) Analysis By End-Use Industry, 2020 to 2024
    • Current and Future Market Size Value (USD Million) & Volume (Units) Analysis and Forecast By End-Use Industry, 2025 to 2035
      • Pharmaceuticals & Biotechnology
      • Food & Beverage
      • Chemicals
      • Logistics & Supply Chain
      • Agriculture & Floriculture
      • Electronics
    • Y-o-Y Growth Trend Analysis By End-Use Industry, 2020 to 2024
    • Absolute $ Opportunity Analysis By End-Use Industry, 2025 to 2035
  9. Global Market Analysis 2020 to 2024 and Forecast 2025 to 2035, By Region
    • Introduction
    • Historical Market Size Value (USD Million) & Volume (Units) Analysis By Region, 2020 to 2024
    • Current Market Size Value (USD Million) & Volume (Units) Analysis and Forecast By Region, 2025 to 2035
      • North America
      • Latin America
      • Europe
      • East Asia
      • South Asia
      • Oceania
      • MEA
    • Market Attractiveness Analysis By Region
  10. North America Market Analysis 2020 to 2024 and Forecast 2025 to 2035, By Country
    • Historical Market Size Value (USD Million) & Volume (Units) Trend Analysis By Market Taxonomy, 2020 to 2024
    • Market Size Value (USD Million) & Volume (Units) Forecast By Market Taxonomy, 2025 to 2035
      • By Country
        • USA
        • Canada
      • By Product Type
      • By Application Type
      • By End-Use Industry
    • Market Attractiveness Analysis
      • By Country
      • By Product Type
      • By Application Type
      • By End-Use Industry
    • Key Takeaways
  11. Latin America Market Analysis 2020 to 2024 and Forecast 2025 to 2035, By Country
    • Historical Market Size Value (USD Million) & Volume (Units) Trend Analysis By Market Taxonomy, 2020 to 2024
    • Market Size Value (USD Million) & Volume (Units) Forecast By Market Taxonomy, 2025 to 2035
      • By Country
        • Brazil
        • Mexico
        • Argentina
        • Chile
        • Peru
        • Rest of Latin America
      • By Product Type
      • By Application Type
      • By End-Use Industry
    • Market Attractiveness Analysis
      • By Country
      • By Product Type
      • By Application Type
      • By End-Use Industry
    • Key Takeaways
  12. Europe Market Analysis 2020 to 2024 and Forecast 2025 to 2035, By Country
    • Historical Market Size Value (USD Million) & Volume (Units) Trend Analysis By Market Taxonomy, 2020 to 2024
    • Market Size Value (USD Million) & Volume (Units) Forecast By Market Taxonomy, 2025 to 2035
      • By Country
        • Germany
        • Italy
        • France
        • UK
        • Spain
        • Russia
        • BENELUX
        • Rest of Europe
      • By Product Type
      • By Application Type
      • By End-Use Industry
    • Market Attractiveness Analysis
      • By Country
      • By Product Type
      • By Application Type
      • By End-Use Industry
    • Key Takeaways
  13. East Asia Market Analysis 2020 to 2024 and Forecast 2025 to 2035, By Country
    • Historical Market Size Value (USD Million) & Volume (Units) Trend Analysis By Market Taxonomy, 2020 to 2024
    • Market Size Value (USD Million) & Volume (Units) Forecast By Market Taxonomy, 2025 to 2035
      • By Country
        • China
        • Japan
        • South Korea
      • By Product Type
      • By Application Type
      • By End-Use Industry
    • Market Attractiveness Analysis
      • By Country
      • By Product Type
      • By Application Type
      • By End-Use Industry
    • Key Takeaways
  14. South Asia Market Analysis 2020 to 2024 and Forecast 2025 to 2035, By Country
    • Historical Market Size Value (USD Million) & Volume (Units) Trend Analysis By Market Taxonomy, 2020 to 2024
    • Market Size Value (USD Million) & Volume (Units) Forecast By Market Taxonomy, 2025 to 2035
      • By Country
        • India
        • Thailand
        • Malaysia
        • Indonesia
        • Rest of South Asia
      • By Product Type
      • By Application Type
      • By End-Use Industry
    • Market Attractiveness Analysis
      • By Country
      • By Product Type
      • By Application Type
      • By End-Use Industry
    • Key Takeaways
  15. Oceania Market Analysis 2020 to 2024 and Forecast 2025 to 2035, By Country
    • Historical Market Size Value (USD Million) & Volume (Units) Trend Analysis By Market Taxonomy, 2020 to 2024
    • Market Size Value (USD Million) & Volume (Units) Forecast By Market Taxonomy, 2025 to 2035
      • By Country
        • Australia
        • New Zealand
      • By Product Type
      • By Application Type
      • By End-Use Industry
    • Market Attractiveness Analysis
      • By Country
      • By Product Type
      • By Application Type
      • By End-Use Industry
    • Key Takeaways
  16. MEA Market Analysis 2020 to 2024 and Forecast 2025 to 2035, By Country
    • Historical Market Size Value (USD Million) & Volume (Units) Trend Analysis By Market Taxonomy, 2020 to 2024
    • Market Size Value (USD Million) & Volume (Units) Forecast By Market Taxonomy, 2025 to 2035
      • By Country
        • GCC
        • Rest of MEA
      • By Product Type
      • By Application Type
      • By End-Use Industry
    • Market Attractiveness Analysis
      • By Country
      • By Product Type
      • By Application Type
      • By End-Use Industry
    • Key Takeaways
  17. Key Countries Market Analysis
    • USA
      • Pricing Analysis
      • Market Share Analysis, 2024
        • By Product Type
        • By Application Type
        • By End-Use Industry
    • China
      • Pricing Analysis
      • Market Share Analysis, 2024
        • By Product Type
        • By Application Type
        • By End-Use Industry
    • Japan
      • Pricing Analysis
      • Market Share Analysis, 2024
        • By Product Type
        • By Application Type
        • By End-Use Industry
    • Germany
      • Pricing Analysis
      • Market Share Analysis, 2024
        • By Product Type
        • By Application Type
        • By End-Use Industry
    • GCC
      • Pricing Analysis
      • Market Share Analysis, 2024
        • By Product Type
        • By Application Type
        • By End-Use Industry
  18. Market Structure Analysis
    • Competition Dashboard
    • Competition Benchmarking
    • Market Share Analysis of Top Players
      • By Regional
      • By Product Type
      • By Application Type
      • By End-Use Industry
  19. Competition Analysis
    • Competition Deep Dive
      • Omega Engineering Inc.
        • Overview
        • Product Portfolio
        • Profitability by Market Segments (Product/Age /Sales Channel/Region)
        • Sales Footprint
        • Strategy Overview
          • Marketing Strategy
          • Product Strategy
          • Channel Strategy
      • Testo SE & Co. KGaA
        • Overview
        • Product Portfolio
        • Profitability by Market Segments (Product/Age /Sales Channel/Region)
        • Sales Footprint
        • Strategy Overview
          • Marketing Strategy
          • Product Strategy
          • Channel Strategy
      • Onset Computer Corporation
        • Overview
        • Product Portfolio
        • Profitability by Market Segments (Product/Age /Sales Channel/Region)
        • Sales Footprint
        • Strategy Overview
          • Marketing Strategy
          • Product Strategy
          • Channel Strategy
      • Dickson Company
        • Overview
        • Product Portfolio
        • Profitability by Market Segments (Product/Age /Sales Channel/Region)
        • Sales Footprint
        • Strategy Overview
          • Marketing Strategy
          • Product Strategy
          • Channel Strategy
      • Vaisala Oyj
        • Overview
        • Product Portfolio
        • Profitability by Market Segments (Product/Age /Sales Channel/Region)
        • Sales Footprint
        • Strategy Overview
          • Marketing Strategy
          • Product Strategy
          • Channel Strategy
      • Elitech Technology Inc.
        • Overview
        • Product Portfolio
        • Profitability by Market Segments (Product/Age /Sales Channel/Region)
        • Sales Footprint
        • Strategy Overview
          • Marketing Strategy
          • Product Strategy
          • Channel Strategy
      • MadgeTech, Inc.
        • Overview
        • Product Portfolio
        • Profitability by Market Segments (Product/Age /Sales Channel/Region)
        • Sales Footprint
        • Strategy Overview
          • Marketing Strategy
          • Product Strategy
          • Channel Strategy
      • T&D Corporation
        • Overview
        • Product Portfolio
        • Profitability by Market Segments (Product/Age /Sales Channel/Region)
        • Sales Footprint
        • Strategy Overview
          • Marketing Strategy
          • Product Strategy
          • Channel Strategy
      • Sensitech Inc.
        • Overview
        • Product Portfolio
        • Profitability by Market Segments (Product/Age /Sales Channel/Region)
        • Sales Footprint
        • Strategy Overview
          • Marketing Strategy
          • Product Strategy
          • Channel Strategy
      • CAS DataLoggers
        • Overview
        • Product Portfolio
        • Profitability by Market Segments (Product/Age /Sales Channel/Region)
        • Sales Footprint
        • Strategy Overview
          • Marketing Strategy
          • Product Strategy
          • Channel Strategy
  20. Assumptions & Acronyms Used
  21. Research Methodology

List of Tables

  • Table 1: Global Market Value (USD Million) Forecast by Region, 2020-2035
  • Table 2: Global Market Volume (Units) Forecast by Region, 2020-2035
  • Table 3: Global Market Value (USD Million) Forecast by Product Type, 2020-2035
  • Table 4: Global Market Volume (Units) Forecast by Product Type, 2020-2035
  • Table 5: Global Market Value (USD Million) Forecast by Application Type, 2020-2035
  • Table 6: Global Market Volume (Units) Forecast by Application Type, 2020-2035
  • Table 7: Global Market Value (USD Million) Forecast by End-Use Industry, 2020-2035
  • Table 8: Global Market Volume (Units) Forecast by End-Use Industry, 2020-2035
  • Table 9: North America Market Value (USD Million) Forecast by Country, 2020-2035
  • Table 10: North America Market Volume (Units) Forecast by Country, 2020-2035
  • Table 11: North America Market Value (USD Million) Forecast by Product Type, 2020-2035
  • Table 12: North America Market Volume (Units) Forecast by Product Type, 2020-2035
  • Table 13: North America Market Value (USD Million) Forecast by Application Type, 2020-2035
  • Table 14: North America Market Volume (Units) Forecast by Application Type, 2020-2035
  • Table 15: North America Market Value (USD Million) Forecast by End-Use Industry, 2020-2035
  • Table 16: North America Market Volume (Units) Forecast by End-Use Industry, 2020-2035
  • Table 17: Latin America Market Value (USD Million) Forecast by Country, 2020-2035
  • Table 18: Latin America Market Volume (Units) Forecast by Country, 2020-2035
  • Table 19: Latin America Market Value (USD Million) Forecast by Product Type, 2020-2035
  • Table 20: Latin America Market Volume (Units) Forecast by Product Type, 2020-2035
  • Table 21: Latin America Market Value (USD Million) Forecast by Application Type, 2020-2035
  • Table 22: Latin America Market Volume (Units) Forecast by Application Type, 2020-2035
  • Table 23: Latin America Market Value (USD Million) Forecast by End-Use Industry, 2020-2035
  • Table 24: Latin America Market Volume (Units) Forecast by End-Use Industry, 2020-2035
  • Table 25: Europe Market Value (USD Million) Forecast by Country, 2020-2035
  • Table 26: Europe Market Volume (Units) Forecast by Country, 2020-2035
  • Table 27: Europe Market Value (USD Million) Forecast by Product Type, 2020-2035
  • Table 28: Europe Market Volume (Units) Forecast by Product Type, 2020-2035
  • Table 29: Europe Market Value (USD Million) Forecast by Application Type, 2020-2035
  • Table 30: Europe Market Volume (Units) Forecast by Application Type, 2020-2035
  • Table 31: Europe Market Value (USD Million) Forecast by End-Use Industry, 2020-2035
  • Table 32: Europe Market Volume (Units) Forecast by End-Use Industry, 2020-2035
  • Table 33: East Asia Market Value (USD Million) Forecast by Country, 2020-2035
  • Table 34: East Asia Market Volume (Units) Forecast by Country, 2020-2035
  • Table 35: East Asia Market Value (USD Million) Forecast by Product Type, 2020-2035
  • Table 36: East Asia Market Volume (Units) Forecast by Product Type, 2020-2035
  • Table 37: East Asia Market Value (USD Million) Forecast by Application Type, 2020-2035
  • Table 38: East Asia Market Volume (Units) Forecast by Application Type, 2020-2035
  • Table 39: East Asia Market Value (USD Million) Forecast by End-Use Industry, 2020-2035
  • Table 40: East Asia Market Volume (Units) Forecast by End-Use Industry, 2020-2035
  • Table 41: South Asia Market Value (USD Million) Forecast by Country, 2020-2035
  • Table 42: South Asia Market Volume (Units) Forecast by Country, 2020-2035
  • Table 43: South Asia Market Value (USD Million) Forecast by Product Type, 2020-2035
  • Table 44: South Asia Market Volume (Units) Forecast by Product Type, 2020-2035
  • Table 45: South Asia Market Value (USD Million) Forecast by Application Type, 2020-2035
  • Table 46: South Asia Market Volume (Units) Forecast by Application Type, 2020-2035
  • Table 47: South Asia Market Value (USD Million) Forecast by End-Use Industry, 2020-2035
  • Table 48: South Asia Market Volume (Units) Forecast by End-Use Industry, 2020-2035
  • Table 49: Oceania Market Value (USD Million) Forecast by Country, 2020-2035
  • Table 50: Oceania Market Volume (Units) Forecast by Country, 2020-2035
  • Table 51: Oceania Market Value (USD Million) Forecast by Product Type, 2020-2035
  • Table 52: Oceania Market Volume (Units) Forecast by Product Type, 2020-2035
  • Table 53: Oceania Market Value (USD Million) Forecast by Application Type, 2020-2035
  • Table 54: Oceania Market Volume (Units) Forecast by Application Type, 2020-2035
  • Table 55: Oceania Market Value (USD Million) Forecast by End-Use Industry, 2020-2035
  • Table 56: Oceania Market Volume (Units) Forecast by End-Use Industry, 2020-2035
  • Table 57: MEA Market Value (USD Million) Forecast by Country, 2020-2035
  • Table 58: MEA Market Volume (Units) Forecast by Country, 2020-2035
  • Table 59: MEA Market Value (USD Million) Forecast by Product Type, 2020-2035
  • Table 60: MEA Market Volume (Units) Forecast by Product Type, 2020-2035
  • Table 61: MEA Market Value (USD Million) Forecast by Application Type, 2020-2035
  • Table 62: MEA Market Volume (Units) Forecast by Application Type, 2020-2035
  • Table 63: MEA Market Value (USD Million) Forecast by End-Use Industry, 2020-2035
  • Table 64: MEA Market Volume (Units) Forecast by End-Use Industry, 2020-2035

List of Figures

  • Figure 1: Global Market Volume (Units) Forecast 2020-2035
  • Figure 2: Global Market Pricing Analysis
  • Figure 3: Global Market Value (USD Million) Forecast 2020-2035
  • Figure 4: Global Market Value Share and BPS Analysis by Product Type, 2025 and 2035
  • Figure 5: Global Market Y-o-Y Growth Comparison by Product Type, 2025-2035
  • Figure 6: Global Market Attractiveness Analysis by Product Type
  • Figure 7: Global Market Value Share and BPS Analysis by Application Type, 2025 and 2035
  • Figure 8: Global Market Y-o-Y Growth Comparison by Application Type, 2025-2035
  • Figure 9: Global Market Attractiveness Analysis by Application Type
  • Figure 10: Global Market Value Share and BPS Analysis by End-Use Industry, 2025 and 2035
  • Figure 11: Global Market Y-o-Y Growth Comparison by End-Use Industry, 2025-2035
  • Figure 12: Global Market Attractiveness Analysis by End-Use Industry
  • Figure 13: Global Market Value (USD Million) Share and BPS Analysis by Region, 2025 and 2035
  • Figure 14: Global Market Y-o-Y Growth Comparison by Region, 2025-2035
  • Figure 15: Global Market Attractiveness Analysis by Region
  • Figure 16: North America Market Incremental $ Opportunity, 2025-2035
  • Figure 17: Latin America Market Incremental $ Opportunity, 2025-2035
  • Figure 18: Europe Market Incremental $ Opportunity, 2025-2035
  • Figure 19: East Asia Market Incremental $ Opportunity, 2025-2035
  • Figure 20: South Asia Market Incremental $ Opportunity, 2025-2035
  • Figure 21: Oceania Market Incremental $ Opportunity, 2025-2035
  • Figure 22: MEA Market Incremental $ Opportunity, 2025-2035
  • Figure 23: North America Market Value Share and BPS Analysis by Country, 2025 and 2035
  • Figure 24: North America Market Value Share and BPS Analysis by Product Type, 2025 and 2035
  • Figure 25: North America Market Y-o-Y Growth Comparison by Product Type, 2025-2035
  • Figure 26: North America Market Attractiveness Analysis by Product Type
  • Figure 27: North America Market Value Share and BPS Analysis by Application Type, 2025 and 2035
  • Figure 28: North America Market Y-o-Y Growth Comparison by Application Type, 2025-2035
  • Figure 29: North America Market Attractiveness Analysis by Application Type
  • Figure 30: North America Market Value Share and BPS Analysis by End-Use Industry, 2025 and 2035
  • Figure 31: North America Market Y-o-Y Growth Comparison by End-Use Industry, 2025-2035
  • Figure 32: North America Market Attractiveness Analysis by End-Use Industry
  • Figure 33: Latin America Market Value Share and BPS Analysis by Country, 2025 and 2035
  • Figure 34: Latin America Market Value Share and BPS Analysis by Product Type, 2025 and 2035
  • Figure 35: Latin America Market Y-o-Y Growth Comparison by Product Type, 2025-2035
  • Figure 36: Latin America Market Attractiveness Analysis by Product Type
  • Figure 37: Latin America Market Value Share and BPS Analysis by Application Type, 2025 and 2035
  • Figure 38: Latin America Market Y-o-Y Growth Comparison by Application Type, 2025-2035
  • Figure 39: Latin America Market Attractiveness Analysis by Application Type
  • Figure 40: Latin America Market Value Share and BPS Analysis by End-Use Industry, 2025 and 2035
  • Figure 41: Latin America Market Y-o-Y Growth Comparison by End-Use Industry, 2025-2035
  • Figure 42: Latin America Market Attractiveness Analysis by End-Use Industry
  • Figure 43: Europe Market Value Share and BPS Analysis by Country, 2025 and 2035
  • Figure 44: Europe Market Value Share and BPS Analysis by Product Type, 2025 and 2035
  • Figure 45: Europe Market Y-o-Y Growth Comparison by Product Type, 2025-2035
  • Figure 46: Europe Market Attractiveness Analysis by Product Type
  • Figure 47: Europe Market Value Share and BPS Analysis by Application Type, 2025 and 2035
  • Figure 48: Europe Market Y-o-Y Growth Comparison by Application Type, 2025-2035
  • Figure 49: Europe Market Attractiveness Analysis by Application Type
  • Figure 50: Europe Market Value Share and BPS Analysis by End-Use Industry, 2025 and 2035
  • Figure 51: Europe Market Y-o-Y Growth Comparison by End-Use Industry, 2025-2035
  • Figure 52: Europe Market Attractiveness Analysis by End-Use Industry
  • Figure 53: East Asia Market Value Share and BPS Analysis by Country, 2025 and 2035
  • Figure 54: East Asia Market Value Share and BPS Analysis by Product Type, 2025 and 2035
  • Figure 55: East Asia Market Y-o-Y Growth Comparison by Product Type, 2025-2035
  • Figure 56: East Asia Market Attractiveness Analysis by Product Type
  • Figure 57: East Asia Market Value Share and BPS Analysis by Application Type, 2025 and 2035
  • Figure 58: East Asia Market Y-o-Y Growth Comparison by Application Type, 2025-2035
  • Figure 59: East Asia Market Attractiveness Analysis by Application Type
  • Figure 60: East Asia Market Value Share and BPS Analysis by End-Use Industry, 2025 and 2035
  • Figure 61: East Asia Market Y-o-Y Growth Comparison by End-Use Industry, 2025-2035
  • Figure 62: East Asia Market Attractiveness Analysis by End-Use Industry
  • Figure 63: South Asia Market Value Share and BPS Analysis by Country, 2025 and 2035
  • Figure 64: South Asia Market Value Share and BPS Analysis by Product Type, 2025 and 2035
  • Figure 65: South Asia Market Y-o-Y Growth Comparison by Product Type, 2025-2035
  • Figure 66: South Asia Market Attractiveness Analysis by Product Type
  • Figure 67: South Asia Market Value Share and BPS Analysis by Application Type, 2025 and 2035
  • Figure 68: South Asia Market Y-o-Y Growth Comparison by Application Type, 2025-2035
  • Figure 69: South Asia Market Attractiveness Analysis by Application Type
  • Figure 70: South Asia Market Value Share and BPS Analysis by End-Use Industry, 2025 and 2035
  • Figure 71: South Asia Market Y-o-Y Growth Comparison by End-Use Industry, 2025-2035
  • Figure 72: South Asia Market Attractiveness Analysis by End-Use Industry
  • Figure 73: Oceania Market Value Share and BPS Analysis by Country, 2025 and 2035
  • Figure 74: Oceania Market Value Share and BPS Analysis by Product Type, 2025 and 2035
  • Figure 75: Oceania Market Y-o-Y Growth Comparison by Product Type, 2025-2035
  • Figure 76: Oceania Market Attractiveness Analysis by Product Type
  • Figure 77: Oceania Market Value Share and BPS Analysis by Application Type, 2025 and 2035
  • Figure 78: Oceania Market Y-o-Y Growth Comparison by Application Type, 2025-2035
  • Figure 79: Oceania Market Attractiveness Analysis by Application Type
  • Figure 80: Oceania Market Value Share and BPS Analysis by End-Use Industry, 2025 and 2035
  • Figure 81: Oceania Market Y-o-Y Growth Comparison by End-Use Industry, 2025-2035
  • Figure 82: Oceania Market Attractiveness Analysis by End-Use Industry
  • Figure 83: MEA Market Value Share and BPS Analysis by Country, 2025 and 2035
  • Figure 84: MEA Market Value Share and BPS Analysis by Product Type, 2025 and 2035
  • Figure 85: MEA Market Y-o-Y Growth Comparison by Product Type, 2025-2035
  • Figure 86: MEA Market Attractiveness Analysis by Product Type
  • Figure 87: MEA Market Value Share and BPS Analysis by Application Type, 2025 and 2035
  • Figure 88: MEA Market Y-o-Y Growth Comparison by Application Type, 2025-2035
  • Figure 89: MEA Market Attractiveness Analysis by Application Type
  • Figure 90: MEA Market Value Share and BPS Analysis by End-Use Industry, 2025 and 2035
  • Figure 91: MEA Market Y-o-Y Growth Comparison by End-Use Industry, 2025-2035
  • Figure 92: MEA Market Attractiveness Analysis by End-Use Industry
  • Figure 93: Global Market - Tier Structure Analysis
  • Figure 94: Global Market - Company Share Analysis

Frequently Asked Questions

What was the overall size of the temperature loggers market in 2025?

The overall market size for the temperature loggers market was USD 2.2 billion in 2025.

How big is the temperature loggers market expected to be in 2035?

The temperature loggers market is expected to reach USD 3.9 billion in 2035.

What will drive the demand for the temperature loggers market during the forecast period?

The demand for temperature loggers is rising due to increasing need for real-time temperature monitoring in cold chain logistics, growing regulatory requirements in healthcare, and advancements in web-based data logger technology. The expanding medical and pharmaceutical sectors are further boosting market growth.

List the top 5 countries contributing to the temperature loggers market?

The top 5 countries driving the development of the temperature loggers market are the USA, Germany, China, Japan, and India.

Which segment in the technology and end-use type is expected to lead in the temperature loggers market?

Web-based data loggers and medical & pharma are expected to command a significant share over the assessment period.

Explore Similar Insights

Future Market Insights

Temperature Loggers Market