Time Temperature Indicator Label Industry Analysis in Western Europe Size and Share Forecast Outlook 2025 to 2035

The Time Temperature Indicator Label Industry Analysis in Western Europe is estimated to be valued at USD 271.0 million in 2025 and is projected to reach USD 427.1 million by 2035, registering a compound annual growth rate (CAGR) of 4.7% over the forecast period.
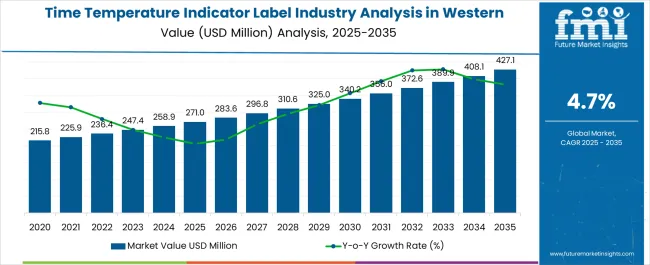
Quick Stats for Time Temperature Indicator Label Industry Analysis in Western Europe

  • Time Temperature Indicator Label Industry Analysis in Western Europe Industry Value (2025): USD 271.0 million
  • Time Temperature Indicator Label Industry Analysis in Western Europe Forecast Value (2035): USD 427.1 million
  • Time Temperature Indicator Label Industry Analysis in Western Europe Forecast CAGR: 4.7%
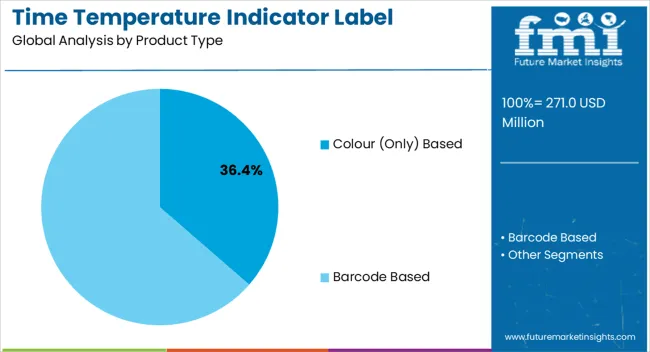
  • Leading Segment in Time Temperature Indicator Label Industry Analysis in Western Europe in 2025: Colour (Only) Based (36.4%)
  • Key Growth Region in Time Temperature Indicator Label Industry Analysis in Western Europe: North America, Asia-Pacific, Europe
  • Top Key Players in Time Temperature Indicator Label Industry Analysis in Western Europe: 3M Company, Timestrip UK LTD, CCL Industries Inc., TIP Temperature Products, Delta Trak, Phase IV Engineering, Inc., Biosynergy, Inc., Evigence Sensors, Insignia Technologies Ltd., Liberty Marking Systems

Time Temperature Indicator Label Industry Analysis In Western Europe Market Value Analysis

Metric Value
Time Temperature Indicator Label Industry Analysis in Western Europe Estimated Value in (2025 E) USD 271.0 million
Time Temperature Indicator Label Industry Analysis in Western Europe Forecast Value in (2035 F) USD 427.1 million
Forecast CAGR (2025 to 2035) 4.7%

Rationale for Segmental Growth in the Time Temperature Indicator Label Industry in Western Europe

The Time Temperature Indicator label industry in Western Europe is experiencing steady growth. Rising regulatory requirements for food safety, increasing consumer awareness regarding product freshness, and the growing adoption of smart packaging solutions are driving market expansion.

Current market dynamics are characterized by integration of advanced label technologies into perishable goods supply chains. Manufacturers are investing in innovations to enhance accuracy, durability, and readability of indicators, while stringent compliance with regional safety and quality standards is shaping adoption trends.

The future outlook is influenced by growth in the pharmaceutical and food sectors, increasing e-commerce penetration, and the need for extended shelf-life monitoring Growth rationale is based on the rising preference for real-time temperature monitoring, the integration of indicator labels into modern cold chain logistics, and the ability of industry players to deliver technologically advanced, reliable solutions that improve supply chain efficiency and product safety, collectively underpinning sustained market growth and broader regional penetration.
Segmental Analysis

Insights into the Product Type Segment

Time Temperature Indicator Label Industry Analysis In Western Europe Analysis By Product Type

The colour only based product type segment, holding 36.40% of the category, has been leading due to its simplicity, cost-effectiveness, and ease of interpretation in monitoring temperature-sensitive products. Adoption has been driven by widespread use across food, pharmaceutical, and logistics industries, where quick visual assessment is critical.

The segment’s growth is supported by high reliability, minimal training requirements, and compatibility with existing packaging formats. Production processes have been refined to ensure consistent colour change response and durability under varying storage conditions.

Regulatory adherence and validation of performance have reinforced market confidence Technological enhancements and standardization efforts are expected to sustain the segment’s market share and maintain its leadership position in the Western European region.
Insights into the Label Information Segment

Time Temperature Indicator Label Industry Analysis In Western Europe Analysis By Label Information

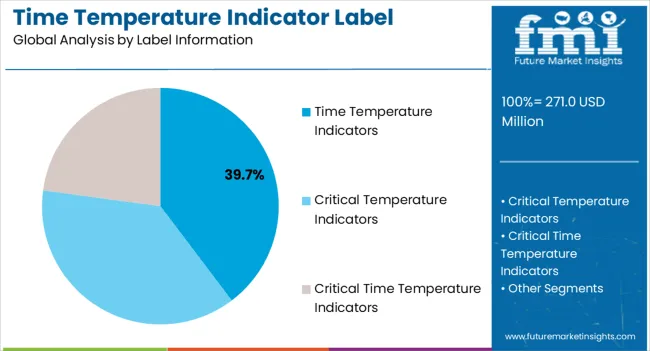
The time temperature indicators segment, representing 39.70% of the label information category, has maintained prominence due to its ability to provide accurate and actionable data on product freshness and safety. Adoption has been supported by growing regulatory mandates and increased emphasis on quality assurance in cold chain operations.

Reliability in tracking cumulative thermal exposure has reinforced preference among manufacturers and distributors. Advances in chemical and enzymatic indicator materials have improved sensitivity and precision.

Integration into automated supply chains and packaging processes has enhanced operational efficiency Ongoing innovation and compliance with European food and pharmaceutical safety standards are expected to sustain the segment’s market share and drive continued adoption in critical applications.
Insights into the Technology Segment

Time Temperature Indicator Label Industry Analysis In Western Europe Analysis By Technology

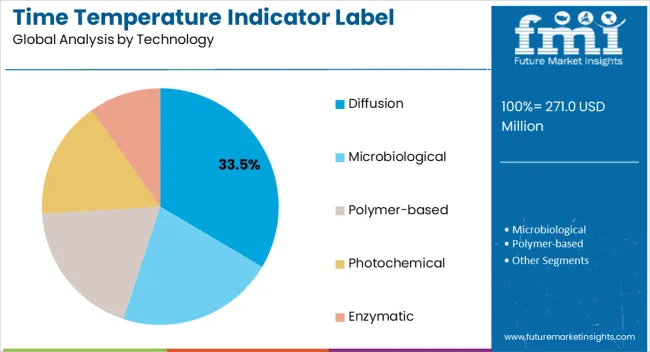
The diffusion technology segment, holding 33.50% of the technology category, has been leading due to its effectiveness in providing continuous and responsive temperature monitoring. Adoption has been driven by high accuracy, adaptability across diverse product types, and compatibility with various packaging formats.

Performance reliability under fluctuating environmental conditions has reinforced preference among end-users in food and pharmaceutical industries. Manufacturing advancements have improved indicator response times and extended functional life.

Quality assurance and validation protocols have strengthened market trust Continued technological development and integration with smart logistics systems are expected to sustain segment leadership and support broader regional penetration in Western Europe.

Trends Influencing Demand for Time Temperature Indicator Labels in Western Europe

  • Stringent standards drive demand, emphasizing compliance and product safety across pharmaceuticals, food, and logistics sectors.
  • Eco friendly labels gain traction, aligning with industry preferences for sustainable packaging solutions.
  • Innovations in label technology, such as IoT integration and enhanced accuracy, meet evolving industry needs.
  • Heightened focus on maintaining product integrity fuels demand for precise monitoring throughout supply chains.
  • Increasing applications across varied sectors like healthcare, perishable goods, and industrial segments amplify label demand for temperature sensitive products.

Time Temperature Indicator Label Industry Analysis by Top Investment Segments in Western Europe

Critical Time Temperature Indicators Cornerstone of Reliability in Western Europe Temperature Label Industry

Critical time temperature indicators dominate the Western Europe Temperature Indicator Label industry with an 85.70% industry share in 2025 due to their pivotal role in ensuring product integrity. These indicators act as crucial guardians, signalling temperature breaches in sensitive goods during storage and transit.

With precise monitoring capabilities and immediate visual alerts upon exposure to undesired conditions, CTTIs mitigate spoilage or compromised efficacy risks in pharmaceuticals, perishables, and other temperature sensitive products.

Label Information Critical Time Temperature Indicators (CTTI)
Industry Share 85.70%

Their prominence stems from the reliance of the industry on maintaining optimal conditions, making CTTIs the cornerstone of quality assurance, garnering trust across sectors, and solidifying their position as an indispensable component in safeguarding product safety and reliability.

Enzymatic Technology Leads Western Europe Label Industry

Enzymatic technology emerges as the coveted choice, commanding a substantial 36.50% industry share in the Western Europe temperature indicator label industry for 2025. Its appeal lies in unparalleled precision and versatility.

Enzymatic labels react sensitively to temperature fluctuations, delivering accurate real time data crucial for preserving product quality in pharmaceuticals, food, and logistics.

Technology Enzymatic
Industry Share 36.50%

Its adaptability across various temperature ranges, cost effectiveness, and eco-friendliness position it as the preferred solution. This industry emphasizes sustainability and stringent quality standards, enzymatic technology stands out, driving innovation and reinforcing its dominance as the go to choice for ensuring uncompromised product integrity throughout the supply chain.

Analysis of Top Countries Producing, Certifying, and Utilizing Time Temperature Indicator Labels in Western Europe

Regions Profiled CAGR from 2025 to 2035
The United Kingdom 4.90%
France 4.60%

The Evolution of Temperature Indicator Label in the United Kingdom

The United Kingdom temperature indicator label industry experiences dynamic trends, projected to maintain a CAGR of 4.90% until 2035. A prominent trend is the integration of smart technology within temperature sensitive labels. These labels now encompass IoT enabled sensors, offering real time monitoring and data transmission, enhancing supply chain visibility and product safety.

Advancements in eco-friendly materials and sustainable label production techniques mark a shift towards environmentally conscious solutions, aligning with global sustainability goals. Trends highlight customized solutions tailored for specific industries.

Labels designed for pharmaceuticals, perishables, and vaccines exhibit precise monitoring capabilities, meeting stringent regulatory requirements and ensuring product efficacy. The emergence of nanotechnology has enabled the creation of ultra sensitive labels, expanding their application range.

Strategic collaborations between key industry players and research institutions foster innovation, driving the industry towards enhanced functionality and reliability. This landscape evolution places emphasis on compliance, efficiency, and sustainability, reshaping the future trajectory of temperature indicator labels in the United Kingdom industry.

Redefining Temperature Control in France Label Industry

In France, the temperature indicator label industry presents a promising landscape with a projected CAGR of 4.60% until 2035. This robust growth trajectory signifies abundant opportunities within the industry.

As industries like pharmaceuticals, food, and logistics increasingly prioritize product integrity and safety, the demand for precise temperature monitoring escalates. Its strong regulatory environment regarding product safety standards creates an environment conducive to innovation and adoption of advanced labeling technologies.

Opportunities abound for companies specializing in temperature indicator labels to expand their presence in France. Catering to these industries stringent requirements for quality control and compliance opens avenues for innovative label solutions.

The rising focus on sustainable practices creates opportunities for labels incorporating eco-friendly material and recyclability. Collaborations, research partnerships, and investments in research and development to develop more efficient, cost effective, and adaptable temperature indicator labels are also avenues to capitalize on the burgeoning industry demand.
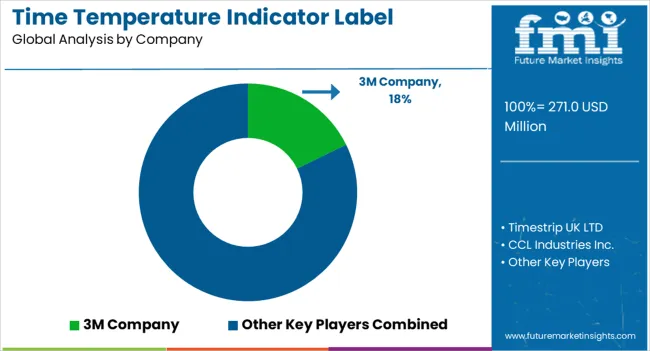
Competitive Landscape of the Time Temperature Indicator Label Market in Western Europe

Time Temperature Indicator Label Industry Analysis In Western Europe Analysis By Company

The Western Europe temperature indicator label industry thrives in a competitive landscape, populated by key players like Timestrip UK LTD, 3M Company, and CCL Industries Inc. These industry leaders continually innovate, offering advanced monitoring solutions for temperature sensitive products across pharmaceuticals, food, and logistics.

Competition drives technological advancements, fostering the creation of precise, cost effective labels. Emerging players contribute with niche specific solutions, intensifying rivalry. Quality, accuracy, and adaptability in label design and functionality set benchmarks. Industry dynamics, stringent regulations, and the pursuit of sustainable practices fuel this competitive arena, pushing companies to elevate standards, expand offerings, and establish strategic partnerships to maintain industry leadership.

Product Portfolio

  • Timestrip UK LTD offers an innovative range of time temperature indicator label. Their portfolio includes cost effective solutions ensuring product integrity throughout the supply chain, catering to industries like pharmaceuticals, food, and logistics.
  • 3M Company provides cutting edge time temperature indicator labels. Their portfolio boasts high performance labels engineered for precise monitoring, guaranteeing quality preservation in sectors like healthcare, food services, and transportation logistics.
  • CCL Industries Inc. presents a diverse collection of time temperature indicator labels. Their portfolio features industry leading labels designed for accuracy, enhancing product safety and compliance within pharmaceuticals, perishable goods, and industrial sectors.

Leading Companies Providing Time Temperature Indicator Labels in Western Europe

  • Timestrip UK LTD
  • 3M Company
  • CCL Industries Inc.
  • TIP Temperature Products
  • Delta Trak
  • Phase IV Engineering, Inc.
  • Biosynergy, Inc.
  • Evigence Sensors
  • Insignia Technologies Ltd.
  • Liberty Marking Systems

Scope and Coverage of the Time Temperature Indicator Label Market Report in Western Europe

Attribute Details
Estimated Industry Size in 2025 USD 271.0 million
Projected Industry Size in 2035 USD 427.1 million
Attributed CAGR between 2025 and 2035 4.7%
Historical Analysis of Demand for Time Temperature Indicator Label in Western Europe Countries 2020 to 2025
Forecast Period 2025 to 2035
Report Coverage Industry size, industry trends, analysis of key factors influencing Time Temperature Indicator Label in Western Europe insights on global players and their industry strategy in Western Europe ecosystem analysis of local and regional Western Europe providers.
Key Countries within Western Europe Analyzed while Studying Opportunities for Time Temperature Indicator Label in Western Europe The United Kingdom, Germany, Italy, France, Spain, Rest of Western Europe
Key Companies Profiled Timestrip UK LTD; 3M Company; CCL Industries Inc.; TIP Temperature Products; Delta Trak; Phase IV Engineering, Inc.; Biosynergy, Inc.; Evigence Sensors; Insignia Technologies Ltd.; Liberty Marking Systems

Top Segments Studied in the Time Temperature Indicator Label Market Report in Western Europe

By Product Type:

  • Colour (Only) Based
    • Irreversible
    • Reversible
  • Barcode Based

By Label Information:

  • Critical Temperature Indicators
  • Time Temperature Indicators
  • Critical Time Temperature Indicators

By Technology:

  • Microbiological
  • Diffusion
  • Polymer-based
  • Photochemical
  • Enzymatic

By End Use Industry:

  • Pharmaceutical
  • Food & Beverage
  • Chemical & Fertilizers

By Country:

  • United Kingdom
  • Germany
  • Italy
  • France
  • Spain
  • Rest of Western Europe

Frequently Asked Questions

How big is the time temperature indicator label industry analysis in Western Europe in 2025?

The global time temperature indicator label industry analysis in Western Europe is estimated to be valued at USD 271.0 million in 2025.

What will be the size of time temperature indicator label industry analysis in Western Europe in 2035?

The market size for the time temperature indicator label industry analysis in Western Europe is projected to reach USD 428.2 million by 2035.

How much will be the time temperature indicator label industry analysis in Western Europe growth between 2025 and 2035?

The time temperature indicator label industry analysis in Western Europe is expected to grow at a 4.7% CAGR between 2025 and 2035.

What are the key product types in the time temperature indicator label industry analysis in western europe?

The key product types in time temperature indicator label industry analysis in Western Europe are colour (only) based, _irreversible, _reversible and barcode based.

Which label information segment to contribute significant share in the time temperature indicator label industry analysis in Western Europe in 2025?

In terms of label information, time temperature indicators segment to command 39.7% share in the time temperature indicator label industry analysis in Western Europe in 2025.

Table of Content

  1. Executive Summary
    • Global Market Outlook
    • Demand-side Trends
    • Supply-side Trends
    • Technology Roadmap Analysis
    • Analysis and Recommendations
  2. Market Overview
    • Market Coverage / Taxonomy
    • Market Definition / Scope / Limitations
  3. Market Background
    • Market Dynamics
      • Drivers
      • Restraints
      • Opportunity
      • Trends
    • Scenario Forecast
      • Demand in Optimistic Scenario
      • Demand in Likely Scenario
      • Demand in Conservative Scenario
    • Opportunity Map Analysis
    • Product Life Cycle Analysis
    • Supply Chain Analysis
    • Investment Feasibility Matrix
    • Value Chain Analysis
    • PESTLE and Porter’s Analysis
    • Regulatory Landscape
    • Regional Parent Market Outlook
    • Production and Consumption Statistics
    • Import and Export Statistics
  4. Global Time Temperature Indicator Label Industry Analysis in Western Europe Analysis 2020-2024 and Forecast, 2025-2035
    • Historical Market Size Value (USD Mn) Analysis, 2020-2024
    • Current and Future Market Size Value (USD Mn) Projections, 2025-2035
      • Y-o-Y Growth Trend Analysis
      • Absolute $ Opportunity Analysis
  5. Global Time Temperature Indicator Label Industry Analysis in Western Europe Pricing Analysis 2020-2024 and Forecast 2025-2035
  6. Global Time Temperature Indicator Label Industry Analysis in Western Europe Analysis 2020-2024 and Forecast 2025-2035, By Product Type
    • Introduction / Key Findings
    • Historical Market Size Value (USD Mn) Analysis By Product Type , 2020-2024
    • Current and Future Market Size Value (USD Mn) Analysis and Forecast By Product Type , 2025-2035
      • Colour (Only) Based
        • Irreversible
        • Reversible
      • Barcode Based
    • Y-o-Y Growth Trend Analysis By Product Type , 2020-2024
    • Absolute $ Opportunity Analysis By Product Type , 2025-2035
  7. Global Time Temperature Indicator Label Industry Analysis in Western Europe Analysis 2020-2024 and Forecast 2025-2035, By Label Information
    • Introduction / Key Findings
    • Historical Market Size Value (USD Mn) Analysis By Label Information, 2020-2024
    • Current and Future Market Size Value (USD Mn) Analysis and Forecast By Label Information, 2025-2035
      • Time Temperature Indicators
      • Critical Temperature Indicators
      • Critical Time Temperature Indicators
    • Y-o-Y Growth Trend Analysis By Label Information, 2020-2024
    • Absolute $ Opportunity Analysis By Label Information, 2025-2035
  8. Global Time Temperature Indicator Label Industry Analysis in Western Europe Analysis 2020-2024 and Forecast 2025-2035, By Technology
    • Introduction / Key Findings
    • Historical Market Size Value (USD Mn) Analysis By Technology, 2020-2024
    • Current and Future Market Size Value (USD Mn) Analysis and Forecast By Technology, 2025-2035
      • Diffusion
      • Microbiological
      • Polymer-based
      • Photochemical
      • Enzymatic
    • Y-o-Y Growth Trend Analysis By Technology, 2020-2024
    • Absolute $ Opportunity Analysis By Technology, 2025-2035
  9. Global Time Temperature Indicator Label Industry Analysis in Western Europe Analysis 2020-2024 and Forecast 2025-2035, By End Use Industry
    • Introduction / Key Findings
    • Historical Market Size Value (USD Mn) Analysis By End Use Industry, 2020-2024
    • Current and Future Market Size Value (USD Mn) Analysis and Forecast By End Use Industry, 2025-2035
      • Food & Beverage
      • Pharmaceutical
      • Chemical & Fertilizers
    • Y-o-Y Growth Trend Analysis By End Use Industry, 2020-2024
    • Absolute $ Opportunity Analysis By End Use Industry, 2025-2035
  10. Global Time Temperature Indicator Label Industry Analysis in Western Europe Analysis 2020-2024 and Forecast 2025-2035, By Region
    • Introduction
    • Historical Market Size Value (USD Mn) Analysis By Region, 2020-2024
    • Current Market Size Value (USD Mn) Analysis and Forecast By Region, 2025-2035
      • North America
      • Latin America
      • Western Europe
      • Eastern Europe
      • East Asia
      • South Asia and Pacific
      • Middle East & Africa
    • Market Attractiveness Analysis By Region
  11. North America Time Temperature Indicator Label Industry Analysis in Western Europe Analysis 2020-2024 and Forecast 2025-2035, By Country
    • Historical Market Size Value (USD Mn) Trend Analysis By Market Taxonomy, 2020-2024
    • Market Size Value (USD Mn) Forecast By Market Taxonomy, 2025-2035
      • By Country
        • USA
        • Canada
        • Mexico
      • By Product Type
      • By Label Information
      • By Technology
      • By End Use Industry
    • Market Attractiveness Analysis
      • By Country
      • By Product Type
      • By Label Information
      • By Technology
      • By End Use Industry
    • Key Takeaways
  12. Latin America Time Temperature Indicator Label Industry Analysis in Western Europe Analysis 2020-2024 and Forecast 2025-2035, By Country
    • Historical Market Size Value (USD Mn) Trend Analysis By Market Taxonomy, 2020-2024
    • Market Size Value (USD Mn) Forecast By Market Taxonomy, 2025-2035
      • By Country
        • Brazil
        • Chile
        • Rest of Latin America
      • By Product Type
      • By Label Information
      • By Technology
      • By End Use Industry
    • Market Attractiveness Analysis
      • By Country
      • By Product Type
      • By Label Information
      • By Technology
      • By End Use Industry
    • Key Takeaways
  13. Western Europe Time Temperature Indicator Label Industry Analysis in Western Europe Analysis 2020-2024 and Forecast 2025-2035, By Country
    • Historical Market Size Value (USD Mn) Trend Analysis By Market Taxonomy, 2020-2024
    • Market Size Value (USD Mn) Forecast By Market Taxonomy, 2025-2035
      • By Country
        • Germany
        • UK
        • Italy
        • Spain
        • France
        • Nordic
        • BENELUX
        • Rest of Western Europe
      • By Product Type
      • By Label Information
      • By Technology
      • By End Use Industry
    • Market Attractiveness Analysis
      • By Country
      • By Product Type
      • By Label Information
      • By Technology
      • By End Use Industry
    • Key Takeaways
  14. Eastern Europe Time Temperature Indicator Label Industry Analysis in Western Europe Analysis 2020-2024 and Forecast 2025-2035, By Country
    • Historical Market Size Value (USD Mn) Trend Analysis By Market Taxonomy, 2020-2024
    • Market Size Value (USD Mn) Forecast By Market Taxonomy, 2025-2035
      • By Country
        • Russia
        • Poland
        • Hungary
        • Balkan & Baltic
        • Rest of Eastern Europe
      • By Product Type
      • By Label Information
      • By Technology
      • By End Use Industry
    • Market Attractiveness Analysis
      • By Country
      • By Product Type
      • By Label Information
      • By Technology
      • By End Use Industry
    • Key Takeaways
  15. East Asia Time Temperature Indicator Label Industry Analysis in Western Europe Analysis 2020-2024 and Forecast 2025-2035, By Country
    • Historical Market Size Value (USD Mn) Trend Analysis By Market Taxonomy, 2020-2024
    • Market Size Value (USD Mn) Forecast By Market Taxonomy, 2025-2035
      • By Country
        • China
        • Japan
        • South Korea
      • By Product Type
      • By Label Information
      • By Technology
      • By End Use Industry
    • Market Attractiveness Analysis
      • By Country
      • By Product Type
      • By Label Information
      • By Technology
      • By End Use Industry
    • Key Takeaways
  16. South Asia and Pacific Time Temperature Indicator Label Industry Analysis in Western Europe Analysis 2020-2024 and Forecast 2025-2035, By Country
    • Historical Market Size Value (USD Mn) Trend Analysis By Market Taxonomy, 2020-2024
    • Market Size Value (USD Mn) Forecast By Market Taxonomy, 2025-2035
      • By Country
        • India
        • ASEAN
        • Australia & New Zealand
        • Rest of South Asia and Pacific
      • By Product Type
      • By Label Information
      • By Technology
      • By End Use Industry
    • Market Attractiveness Analysis
      • By Country
      • By Product Type
      • By Label Information
      • By Technology
      • By End Use Industry
    • Key Takeaways
  17. Middle East & Africa Time Temperature Indicator Label Industry Analysis in Western Europe Analysis 2020-2024 and Forecast 2025-2035, By Country
    • Historical Market Size Value (USD Mn) Trend Analysis By Market Taxonomy, 2020-2024
    • Market Size Value (USD Mn) Forecast By Market Taxonomy, 2025-2035
      • By Country
        • Kingdom of Saudi Arabia
        • Other GCC Countries
        • Turkiye
        • South Africa
        • Other African Union
        • Rest of Middle East & Africa
      • By Product Type
      • By Label Information
      • By Technology
      • By End Use Industry
    • Market Attractiveness Analysis
      • By Country
      • By Product Type
      • By Label Information
      • By Technology
      • By End Use Industry
    • Key Takeaways
  18. Key Countries Time Temperature Indicator Label Industry Analysis in Western Europe Analysis
    • USA
      • Pricing Analysis
      • Market Share Analysis, 2024
        • By Product Type
        • By Label Information
        • By Technology
        • By End Use Industry
    • Canada
      • Pricing Analysis
      • Market Share Analysis, 2024
        • By Product Type
        • By Label Information
        • By Technology
        • By End Use Industry
    • Mexico
      • Pricing Analysis
      • Market Share Analysis, 2024
        • By Product Type
        • By Label Information
        • By Technology
        • By End Use Industry
    • Brazil
      • Pricing Analysis
      • Market Share Analysis, 2024
        • By Product Type
        • By Label Information
        • By Technology
        • By End Use Industry
    • Chile
      • Pricing Analysis
      • Market Share Analysis, 2024
        • By Product Type
        • By Label Information
        • By Technology
        • By End Use Industry
    • Germany
      • Pricing Analysis
      • Market Share Analysis, 2024
        • By Product Type
        • By Label Information
        • By Technology
        • By End Use Industry
    • UK
      • Pricing Analysis
      • Market Share Analysis, 2024
        • By Product Type
        • By Label Information
        • By Technology
        • By End Use Industry
    • Italy
      • Pricing Analysis
      • Market Share Analysis, 2024
        • By Product Type
        • By Label Information
        • By Technology
        • By End Use Industry
    • Spain
      • Pricing Analysis
      • Market Share Analysis, 2024
        • By Product Type
        • By Label Information
        • By Technology
        • By End Use Industry
    • France
      • Pricing Analysis
      • Market Share Analysis, 2024
        • By Product Type
        • By Label Information
        • By Technology
        • By End Use Industry
    • India
      • Pricing Analysis
      • Market Share Analysis, 2024
        • By Product Type
        • By Label Information
        • By Technology
        • By End Use Industry
    • ASEAN
      • Pricing Analysis
      • Market Share Analysis, 2024
        • By Product Type
        • By Label Information
        • By Technology
        • By End Use Industry
    • Australia & New Zealand
      • Pricing Analysis
      • Market Share Analysis, 2024
        • By Product Type
        • By Label Information
        • By Technology
        • By End Use Industry
    • China
      • Pricing Analysis
      • Market Share Analysis, 2024
        • By Product Type
        • By Label Information
        • By Technology
        • By End Use Industry
    • Japan
      • Pricing Analysis
      • Market Share Analysis, 2024
        • By Product Type
        • By Label Information
        • By Technology
        • By End Use Industry
    • South Korea
      • Pricing Analysis
      • Market Share Analysis, 2024
        • By Product Type
        • By Label Information
        • By Technology
        • By End Use Industry
    • Russia
      • Pricing Analysis
      • Market Share Analysis, 2024
        • By Product Type
        • By Label Information
        • By Technology
        • By End Use Industry
    • Poland
      • Pricing Analysis
      • Market Share Analysis, 2024
        • By Product Type
        • By Label Information
        • By Technology
        • By End Use Industry
    • Hungary
      • Pricing Analysis
      • Market Share Analysis, 2024
        • By Product Type
        • By Label Information
        • By Technology
        • By End Use Industry
    • Kingdom of Saudi Arabia
      • Pricing Analysis
      • Market Share Analysis, 2024
        • By Product Type
        • By Label Information
        • By Technology
        • By End Use Industry
    • Turkiye
      • Pricing Analysis
      • Market Share Analysis, 2024
        • By Product Type
        • By Label Information
        • By Technology
        • By End Use Industry
    • South Africa
      • Pricing Analysis
      • Market Share Analysis, 2024
        • By Product Type
        • By Label Information
        • By Technology
        • By End Use Industry
  19. Market Structure Analysis
    • Competition Dashboard
    • Competition Benchmarking
    • Market Share Analysis of Top Players
      • By Regional
      • By Product Type
      • By Label Information
      • By Technology
      • By End Use Industry
  20. Competition Analysis
    • Competition Deep Dive
      • 3M Company
        • Overview
        • Product Portfolio
        • Profitability by Market Segments (Product/Age /Sales Channel/Region)
        • Sales Footprint
        • Strategy Overview
          • Marketing Strategy
          • Product Strategy
          • Channel Strategy
      • Timestrip UK LTD
      • CCL Industries Inc.
      • TIP Temperature Products
      • Delta Trak
      • Phase IV Engineering, Inc.
      • Biosynergy, Inc.
      • Evigence Sensors
      • Insignia Technologies Ltd.
      • Liberty Marking Systems
  21. Assumptions & Acronyms Used
  22. Research Methodology

List of Tables

  • Table 1: Global Time Temperature Indicator Label Industry Analysis in Western Europe Value (USD Mn) Forecast by Region, 2020-2035
  • Table 2: Global Time Temperature Indicator Label Industry Analysis in Western Europe Value (USD Mn) Forecast by Product Type , 2020-2035
  • Table 3: Global Time Temperature Indicator Label Industry Analysis in Western Europe Value (USD Mn) Forecast by Label Information, 2020-2035
  • Table 4: Global Time Temperature Indicator Label Industry Analysis in Western Europe Value (USD Mn) Forecast by Technology, 2020-2035
  • Table 5: Global Time Temperature Indicator Label Industry Analysis in Western Europe Value (USD Mn) Forecast by End Use Industry, 2020-2035
  • Table 6: North America Time Temperature Indicator Label Industry Analysis in Western Europe Value (USD Mn) Forecast by Country, 2020-2035
  • Table 7: North America Time Temperature Indicator Label Industry Analysis in Western Europe Value (USD Mn) Forecast by Product Type , 2020-2035
  • Table 8: North America Time Temperature Indicator Label Industry Analysis in Western Europe Value (USD Mn) Forecast by Label Information, 2020-2035
  • Table 9: North America Time Temperature Indicator Label Industry Analysis in Western Europe Value (USD Mn) Forecast by Technology, 2020-2035
  • Table 10: North America Time Temperature Indicator Label Industry Analysis in Western Europe Value (USD Mn) Forecast by End Use Industry, 2020-2035
  • Table 11: Latin America Time Temperature Indicator Label Industry Analysis in Western Europe Value (USD Mn) Forecast by Country, 2020-2035
  • Table 12: Latin America Time Temperature Indicator Label Industry Analysis in Western Europe Value (USD Mn) Forecast by Product Type , 2020-2035
  • Table 13: Latin America Time Temperature Indicator Label Industry Analysis in Western Europe Value (USD Mn) Forecast by Label Information, 2020-2035
  • Table 14: Latin America Time Temperature Indicator Label Industry Analysis in Western Europe Value (USD Mn) Forecast by Technology, 2020-2035
  • Table 15: Latin America Time Temperature Indicator Label Industry Analysis in Western Europe Value (USD Mn) Forecast by End Use Industry, 2020-2035
  • Table 16: Western Europe Time Temperature Indicator Label Industry Analysis in Western Europe Value (USD Mn) Forecast by Country, 2020-2035
  • Table 17: Western Europe Time Temperature Indicator Label Industry Analysis in Western Europe Value (USD Mn) Forecast by Product Type , 2020-2035
  • Table 18: Western Europe Time Temperature Indicator Label Industry Analysis in Western Europe Value (USD Mn) Forecast by Label Information, 2020-2035
  • Table 19: Western Europe Time Temperature Indicator Label Industry Analysis in Western Europe Value (USD Mn) Forecast by Technology, 2020-2035
  • Table 20: Western Europe Time Temperature Indicator Label Industry Analysis in Western Europe Value (USD Mn) Forecast by End Use Industry, 2020-2035
  • Table 21: Eastern Europe Time Temperature Indicator Label Industry Analysis in Western Europe Value (USD Mn) Forecast by Country, 2020-2035
  • Table 22: Eastern Europe Time Temperature Indicator Label Industry Analysis in Western Europe Value (USD Mn) Forecast by Product Type , 2020-2035
  • Table 23: Eastern Europe Time Temperature Indicator Label Industry Analysis in Western Europe Value (USD Mn) Forecast by Label Information, 2020-2035
  • Table 24: Eastern Europe Time Temperature Indicator Label Industry Analysis in Western Europe Value (USD Mn) Forecast by Technology, 2020-2035
  • Table 25: Eastern Europe Time Temperature Indicator Label Industry Analysis in Western Europe Value (USD Mn) Forecast by End Use Industry, 2020-2035
  • Table 26: East Asia Time Temperature Indicator Label Industry Analysis in Western Europe Value (USD Mn) Forecast by Country, 2020-2035
  • Table 27: East Asia Time Temperature Indicator Label Industry Analysis in Western Europe Value (USD Mn) Forecast by Product Type , 2020-2035
  • Table 28: East Asia Time Temperature Indicator Label Industry Analysis in Western Europe Value (USD Mn) Forecast by Label Information, 2020-2035
  • Table 29: East Asia Time Temperature Indicator Label Industry Analysis in Western Europe Value (USD Mn) Forecast by Technology, 2020-2035
  • Table 30: East Asia Time Temperature Indicator Label Industry Analysis in Western Europe Value (USD Mn) Forecast by End Use Industry, 2020-2035
  • Table 31: South Asia and Pacific Time Temperature Indicator Label Industry Analysis in Western Europe Value (USD Mn) Forecast by Country, 2020-2035
  • Table 32: South Asia and Pacific Time Temperature Indicator Label Industry Analysis in Western Europe Value (USD Mn) Forecast by Product Type , 2020-2035
  • Table 33: South Asia and Pacific Time Temperature Indicator Label Industry Analysis in Western Europe Value (USD Mn) Forecast by Label Information, 2020-2035
  • Table 34: South Asia and Pacific Time Temperature Indicator Label Industry Analysis in Western Europe Value (USD Mn) Forecast by Technology, 2020-2035
  • Table 35: South Asia and Pacific Time Temperature Indicator Label Industry Analysis in Western Europe Value (USD Mn) Forecast by End Use Industry, 2020-2035
  • Table 36: Middle East & Africa Time Temperature Indicator Label Industry Analysis in Western Europe Value (USD Mn) Forecast by Country, 2020-2035
  • Table 37: Middle East & Africa Time Temperature Indicator Label Industry Analysis in Western Europe Value (USD Mn) Forecast by Product Type , 2020-2035
  • Table 38: Middle East & Africa Time Temperature Indicator Label Industry Analysis in Western Europe Value (USD Mn) Forecast by Label Information, 2020-2035
  • Table 39: Middle East & Africa Time Temperature Indicator Label Industry Analysis in Western Europe Value (USD Mn) Forecast by Technology, 2020-2035
  • Table 40: Middle East & Africa Time Temperature Indicator Label Industry Analysis in Western Europe Value (USD Mn) Forecast by End Use Industry, 2020-2035

List of Figures

  • Figure 1: Global Time Temperature Indicator Label Industry Analysis in Western Europe Pricing Analysis
  • Figure 2: Global Time Temperature Indicator Label Industry Analysis in Western Europe Value (USD Mn) Forecast 2020–2035
  • Figure 3: Global Time Temperature Indicator Label Industry Analysis in Western Europe Value Share and BPS Analysis by Product Type , 2025 and 2035
  • Figure 4: Global Time Temperature Indicator Label Industry Analysis in Western Europe Y-o-Y Growth Comparison by Product Type , 2025–2035
  • Figure 5: Global Time Temperature Indicator Label Industry Analysis in Western Europe Attractiveness Analysis by Product Type
  • Figure 6: Global Time Temperature Indicator Label Industry Analysis in Western Europe Value Share and BPS Analysis by Label Information, 2025 and 2035
  • Figure 7: Global Time Temperature Indicator Label Industry Analysis in Western Europe Y-o-Y Growth Comparison by Label Information, 2025–2035
  • Figure 8: Global Time Temperature Indicator Label Industry Analysis in Western Europe Attractiveness Analysis by Label Information
  • Figure 9: Global Time Temperature Indicator Label Industry Analysis in Western Europe Value Share and BPS Analysis by Technology, 2025 and 2035
  • Figure 10: Global Time Temperature Indicator Label Industry Analysis in Western Europe Y-o-Y Growth Comparison by Technology, 2025–2035
  • Figure 11: Global Time Temperature Indicator Label Industry Analysis in Western Europe Attractiveness Analysis by Technology
  • Figure 12: Global Time Temperature Indicator Label Industry Analysis in Western Europe Value Share and BPS Analysis by End Use Industry, 2025 and 2035
  • Figure 13: Global Time Temperature Indicator Label Industry Analysis in Western Europe Y-o-Y Growth Comparison by End Use Industry, 2025–2035
  • Figure 14: Global Time Temperature Indicator Label Industry Analysis in Western Europe Attractiveness Analysis by End Use Industry
  • Figure 15: Global Time Temperature Indicator Label Industry Analysis in Western Europe Value (USD Mn) Share and BPS Analysis by Region, 2025 and 2035
  • Figure 16: Global Time Temperature Indicator Label Industry Analysis in Western Europe Y-o-Y Growth Comparison by Region, 2025–2035
  • Figure 17: Global Time Temperature Indicator Label Industry Analysis in Western Europe Attractiveness Analysis by Region
  • Figure 18: North America Time Temperature Indicator Label Industry Analysis in Western Europe Incremental Dollar Opportunity, 2025–2035
  • Figure 19: Latin America Time Temperature Indicator Label Industry Analysis in Western Europe Incremental Dollar Opportunity, 2025–2035
  • Figure 20: Western Europe Time Temperature Indicator Label Industry Analysis in Western Europe Incremental Dollar Opportunity, 2025–2035
  • Figure 21: Eastern Europe Time Temperature Indicator Label Industry Analysis in Western Europe Incremental Dollar Opportunity, 2025–2035
  • Figure 22: East Asia Time Temperature Indicator Label Industry Analysis in Western Europe Incremental Dollar Opportunity, 2025–2035
  • Figure 23: South Asia and Pacific Time Temperature Indicator Label Industry Analysis in Western Europe Incremental Dollar Opportunity, 2025–2035
  • Figure 24: Middle East & Africa Time Temperature Indicator Label Industry Analysis in Western Europe Incremental Dollar Opportunity, 2025–2035
  • Figure 25: North America Time Temperature Indicator Label Industry Analysis in Western Europe Value Share and BPS Analysis by Country, 2025 and 2035
  • Figure 26: North America Time Temperature Indicator Label Industry Analysis in Western Europe Value Share and BPS Analysis by Product Type , 2025 and 2035
  • Figure 27: North America Time Temperature Indicator Label Industry Analysis in Western Europe Y-o-Y Growth Comparison by Product Type , 2025–2035
  • Figure 28: North America Time Temperature Indicator Label Industry Analysis in Western Europe Attractiveness Analysis by Product Type
  • Figure 29: North America Time Temperature Indicator Label Industry Analysis in Western Europe Value Share and BPS Analysis by Label Information, 2025 and 2035
  • Figure 30: North America Time Temperature Indicator Label Industry Analysis in Western Europe Y-o-Y Growth Comparison by Label Information, 2025–2035
  • Figure 31: North America Time Temperature Indicator Label Industry Analysis in Western Europe Attractiveness Analysis by Label Information
  • Figure 32: North America Time Temperature Indicator Label Industry Analysis in Western Europe Value Share and BPS Analysis by Technology, 2025 and 2035
  • Figure 33: North America Time Temperature Indicator Label Industry Analysis in Western Europe Y-o-Y Growth Comparison by Technology, 2025–2035
  • Figure 34: North America Time Temperature Indicator Label Industry Analysis in Western Europe Attractiveness Analysis by Technology
  • Figure 35: North America Time Temperature Indicator Label Industry Analysis in Western Europe Value Share and BPS Analysis by End Use Industry, 2025 and 2035
  • Figure 36: North America Time Temperature Indicator Label Industry Analysis in Western Europe Y-o-Y Growth Comparison by End Use Industry, 2025–2035
  • Figure 37: North America Time Temperature Indicator Label Industry Analysis in Western Europe Attractiveness Analysis by End Use Industry
  • Figure 38: Latin America Time Temperature Indicator Label Industry Analysis in Western Europe Value Share and BPS Analysis by Country, 2025 and 2035
  • Figure 39: Latin America Time Temperature Indicator Label Industry Analysis in Western Europe Value Share and BPS Analysis by Product Type , 2025 and 2035
  • Figure 40: Latin America Time Temperature Indicator Label Industry Analysis in Western Europe Y-o-Y Growth Comparison by Product Type , 2025–2035
  • Figure 41: Latin America Time Temperature Indicator Label Industry Analysis in Western Europe Attractiveness Analysis by Product Type
  • Figure 42: Latin America Time Temperature Indicator Label Industry Analysis in Western Europe Value Share and BPS Analysis by Label Information, 2025 and 2035
  • Figure 43: Latin America Time Temperature Indicator Label Industry Analysis in Western Europe Y-o-Y Growth Comparison by Label Information, 2025–2035
  • Figure 44: Latin America Time Temperature Indicator Label Industry Analysis in Western Europe Attractiveness Analysis by Label Information
  • Figure 45: Latin America Time Temperature Indicator Label Industry Analysis in Western Europe Value Share and BPS Analysis by Technology, 2025 and 2035
  • Figure 46: Latin America Time Temperature Indicator Label Industry Analysis in Western Europe Y-o-Y Growth Comparison by Technology, 2025–2035
  • Figure 47: Latin America Time Temperature Indicator Label Industry Analysis in Western Europe Attractiveness Analysis by Technology
  • Figure 48: Latin America Time Temperature Indicator Label Industry Analysis in Western Europe Value Share and BPS Analysis by End Use Industry, 2025 and 2035
  • Figure 49: Latin America Time Temperature Indicator Label Industry Analysis in Western Europe Y-o-Y Growth Comparison by End Use Industry, 2025–2035
  • Figure 50: Latin America Time Temperature Indicator Label Industry Analysis in Western Europe Attractiveness Analysis by End Use Industry
  • Figure 51: Western Europe Time Temperature Indicator Label Industry Analysis in Western Europe Value Share and BPS Analysis by Country, 2025 and 2035
  • Figure 52: Western Europe Time Temperature Indicator Label Industry Analysis in Western Europe Value Share and BPS Analysis by Product Type , 2025 and 2035
  • Figure 53: Western Europe Time Temperature Indicator Label Industry Analysis in Western Europe Y-o-Y Growth Comparison by Product Type , 2025–2035
  • Figure 54: Western Europe Time Temperature Indicator Label Industry Analysis in Western Europe Attractiveness Analysis by Product Type
  • Figure 55: Western Europe Time Temperature Indicator Label Industry Analysis in Western Europe Value Share and BPS Analysis by Label Information, 2025 and 2035
  • Figure 56: Western Europe Time Temperature Indicator Label Industry Analysis in Western Europe Y-o-Y Growth Comparison by Label Information, 2025–2035
  • Figure 57: Western Europe Time Temperature Indicator Label Industry Analysis in Western Europe Attractiveness Analysis by Label Information
  • Figure 58: Western Europe Time Temperature Indicator Label Industry Analysis in Western Europe Value Share and BPS Analysis by Technology, 2025 and 2035
  • Figure 59: Western Europe Time Temperature Indicator Label Industry Analysis in Western Europe Y-o-Y Growth Comparison by Technology, 2025–2035
  • Figure 60: Western Europe Time Temperature Indicator Label Industry Analysis in Western Europe Attractiveness Analysis by Technology
  • Figure 61: Western Europe Time Temperature Indicator Label Industry Analysis in Western Europe Value Share and BPS Analysis by End Use Industry, 2025 and 2035
  • Figure 62: Western Europe Time Temperature Indicator Label Industry Analysis in Western Europe Y-o-Y Growth Comparison by End Use Industry, 2025–2035
  • Figure 63: Western Europe Time Temperature Indicator Label Industry Analysis in Western Europe Attractiveness Analysis by End Use Industry
  • Figure 64: Eastern Europe Time Temperature Indicator Label Industry Analysis in Western Europe Value Share and BPS Analysis by Country, 2025 and 2035
  • Figure 65: Eastern Europe Time Temperature Indicator Label Industry Analysis in Western Europe Value Share and BPS Analysis by Product Type , 2025 and 2035
  • Figure 66: Eastern Europe Time Temperature Indicator Label Industry Analysis in Western Europe Y-o-Y Growth Comparison by Product Type , 2025–2035
  • Figure 67: Eastern Europe Time Temperature Indicator Label Industry Analysis in Western Europe Attractiveness Analysis by Product Type
  • Figure 68: Eastern Europe Time Temperature Indicator Label Industry Analysis in Western Europe Value Share and BPS Analysis by Label Information, 2025 and 2035
  • Figure 69: Eastern Europe Time Temperature Indicator Label Industry Analysis in Western Europe Y-o-Y Growth Comparison by Label Information, 2025–2035
  • Figure 70: Eastern Europe Time Temperature Indicator Label Industry Analysis in Western Europe Attractiveness Analysis by Label Information
  • Figure 71: Eastern Europe Time Temperature Indicator Label Industry Analysis in Western Europe Value Share and BPS Analysis by Technology, 2025 and 2035
  • Figure 72: Eastern Europe Time Temperature Indicator Label Industry Analysis in Western Europe Y-o-Y Growth Comparison by Technology, 2025–2035
  • Figure 73: Eastern Europe Time Temperature Indicator Label Industry Analysis in Western Europe Attractiveness Analysis by Technology
  • Figure 74: Eastern Europe Time Temperature Indicator Label Industry Analysis in Western Europe Value Share and BPS Analysis by End Use Industry, 2025 and 2035
  • Figure 75: Eastern Europe Time Temperature Indicator Label Industry Analysis in Western Europe Y-o-Y Growth Comparison by End Use Industry, 2025–2035
  • Figure 76: Eastern Europe Time Temperature Indicator Label Industry Analysis in Western Europe Attractiveness Analysis by End Use Industry
  • Figure 77: East Asia Time Temperature Indicator Label Industry Analysis in Western Europe Value Share and BPS Analysis by Country, 2025 and 2035
  • Figure 78: East Asia Time Temperature Indicator Label Industry Analysis in Western Europe Value Share and BPS Analysis by Product Type , 2025 and 2035
  • Figure 79: East Asia Time Temperature Indicator Label Industry Analysis in Western Europe Y-o-Y Growth Comparison by Product Type , 2025–2035
  • Figure 80: East Asia Time Temperature Indicator Label Industry Analysis in Western Europe Attractiveness Analysis by Product Type
  • Figure 81: East Asia Time Temperature Indicator Label Industry Analysis in Western Europe Value Share and BPS Analysis by Label Information, 2025 and 2035
  • Figure 82: East Asia Time Temperature Indicator Label Industry Analysis in Western Europe Y-o-Y Growth Comparison by Label Information, 2025–2035
  • Figure 83: East Asia Time Temperature Indicator Label Industry Analysis in Western Europe Attractiveness Analysis by Label Information
  • Figure 84: East Asia Time Temperature Indicator Label Industry Analysis in Western Europe Value Share and BPS Analysis by Technology, 2025 and 2035
  • Figure 85: East Asia Time Temperature Indicator Label Industry Analysis in Western Europe Y-o-Y Growth Comparison by Technology, 2025–2035
  • Figure 86: East Asia Time Temperature Indicator Label Industry Analysis in Western Europe Attractiveness Analysis by Technology
  • Figure 87: East Asia Time Temperature Indicator Label Industry Analysis in Western Europe Value Share and BPS Analysis by End Use Industry, 2025 and 2035
  • Figure 88: East Asia Time Temperature Indicator Label Industry Analysis in Western Europe Y-o-Y Growth Comparison by End Use Industry, 2025–2035
  • Figure 89: East Asia Time Temperature Indicator Label Industry Analysis in Western Europe Attractiveness Analysis by End Use Industry
  • Figure 90: South Asia and Pacific Time Temperature Indicator Label Industry Analysis in Western Europe Value Share and BPS Analysis by Country, 2025 and 2035
  • Figure 91: South Asia and Pacific Time Temperature Indicator Label Industry Analysis in Western Europe Value Share and BPS Analysis by Product Type , 2025 and 2035
  • Figure 92: South Asia and Pacific Time Temperature Indicator Label Industry Analysis in Western Europe Y-o-Y Growth Comparison by Product Type , 2025–2035
  • Figure 93: South Asia and Pacific Time Temperature Indicator Label Industry Analysis in Western Europe Attractiveness Analysis by Product Type
  • Figure 94: South Asia and Pacific Time Temperature Indicator Label Industry Analysis in Western Europe Value Share and BPS Analysis by Label Information, 2025 and 2035
  • Figure 95: South Asia and Pacific Time Temperature Indicator Label Industry Analysis in Western Europe Y-o-Y Growth Comparison by Label Information, 2025–2035
  • Figure 96: South Asia and Pacific Time Temperature Indicator Label Industry Analysis in Western Europe Attractiveness Analysis by Label Information
  • Figure 97: South Asia and Pacific Time Temperature Indicator Label Industry Analysis in Western Europe Value Share and BPS Analysis by Technology, 2025 and 2035
  • Figure 98: South Asia and Pacific Time Temperature Indicator Label Industry Analysis in Western Europe Y-o-Y Growth Comparison by Technology, 2025–2035
  • Figure 99: South Asia and Pacific Time Temperature Indicator Label Industry Analysis in Western Europe Attractiveness Analysis by Technology
  • Figure 100: South Asia and Pacific Time Temperature Indicator Label Industry Analysis in Western Europe Value Share and BPS Analysis by End Use Industry, 2025 and 2035
  • Figure 101: South Asia and Pacific Time Temperature Indicator Label Industry Analysis in Western Europe Y-o-Y Growth Comparison by End Use Industry, 2025–2035
  • Figure 102: South Asia and Pacific Time Temperature Indicator Label Industry Analysis in Western Europe Attractiveness Analysis by End Use Industry
  • Figure 103: Middle East & Africa Time Temperature Indicator Label Industry Analysis in Western Europe Value Share and BPS Analysis by Country, 2025 and 2035
  • Figure 104: Middle East & Africa Time Temperature Indicator Label Industry Analysis in Western Europe Value Share and BPS Analysis by Product Type , 2025 and 2035
  • Figure 105: Middle East & Africa Time Temperature Indicator Label Industry Analysis in Western Europe Y-o-Y Growth Comparison by Product Type , 2025–2035
  • Figure 106: Middle East & Africa Time Temperature Indicator Label Industry Analysis in Western Europe Attractiveness Analysis by Product Type
  • Figure 107: Middle East & Africa Time Temperature Indicator Label Industry Analysis in Western Europe Value Share and BPS Analysis by Label Information, 2025 and 2035
  • Figure 108: Middle East & Africa Time Temperature Indicator Label Industry Analysis in Western Europe Y-o-Y Growth Comparison by Label Information, 2025–2035
  • Figure 109: Middle East & Africa Time Temperature Indicator Label Industry Analysis in Western Europe Attractiveness Analysis by Label Information
  • Figure 110: Middle East & Africa Time Temperature Indicator Label Industry Analysis in Western Europe Value Share and BPS Analysis by Technology, 2025 and 2035
  • Figure 111: Middle East & Africa Time Temperature Indicator Label Industry Analysis in Western Europe Y-o-Y Growth Comparison by Technology, 2025–2035
  • Figure 112: Middle East & Africa Time Temperature Indicator Label Industry Analysis in Western Europe Attractiveness Analysis by Technology
  • Figure 113: Middle East & Africa Time Temperature Indicator Label Industry Analysis in Western Europe Value Share and BPS Analysis by End Use Industry, 2025 and 2035
  • Figure 114: Middle East & Africa Time Temperature Indicator Label Industry Analysis in Western Europe Y-o-Y Growth Comparison by End Use Industry, 2025–2035
  • Figure 115: Middle East & Africa Time Temperature Indicator Label Industry Analysis in Western Europe Attractiveness Analysis by End Use Industry
  • Figure 116: Global Time Temperature Indicator Label Industry Analysis in Western Europe – Tier Structure Analysis
  • Figure 117: Global Time Temperature Indicator Label Industry Analysis in Western Europe – Company Share Analysis
Dashboard
Dashboard
Dashboard
Dashboard
Dashboard
Dashboard

Full Research Suite comprises of:

Market outlook & trends analysis

Market outlook & trends analysis

Interviews & case studies

Interviews & case studies

Strategic recommendations

Strategic recommendations

Vendor profiles & capabilities analysis

Vendor profiles & capabilities analysis

5-year forecasts

5-year forecasts

8 regions and 60+ country-level data splits

8 regions and 60+ country-level data splits

Market segment data splits

Market segment data splits

12 months of continuous data updates

12 months of continuous data updates

DELIVERED AS:

PDF EXCEL ONLINE

Full Research Suite


$5000

$7500

$10000

Buy Report Now
Similar Industry Reports

Similar Industry Reports

Time Switch Market
Time Switch Market

Time Switch Market Analysis Size and Share Forecast Outlook 2025 to 2035

Time Of Flight Cameras Market

Time Of Flight Cameras Market Size and Share Forecast Outlook 2025 to 2035

Time of Flight (ToF) Sensor Market

Time of Flight (ToF) Sensor Market Insights - Growth & Forecast 2025 to 2035

Time Sensitive Networking TSN Market

Time Sensitive Networking TSN Market Size and Share Forecast Outlook 2025 to 2035

Time Temperature Indicator Labels Market

Time Temperature Indicator Labels Market Size and Share Forecast Outlook 2025 to 2035

Time Temperature Indicator Labels Market Share Analysis

Evaluating Time Temperature Indicator Labels Market Share & Provider Insights

Antimetabolite Drugs Market

Antimetabolite Drugs Market Size and Share Forecast Outlook 2025 to 2035

Altimeter Market
Altimeter Market

Altimeter Market

Multimedia Projectors Market

Multimedia Projectors Market Analysis – Growth & Industry Trends 2023-2033

Sentiment Analytics Software Market

Sentiment Analytics Software Market

Maritime Satellite Communication Market

Maritime Satellite Communication Market Size and Share Forecast Outlook 2025 to 2035

Maritime Cybersecurity Market

Maritime Cybersecurity Market Size and Share Forecast Outlook 2025 to 2035

Maritime Patrol Aircraft Market

Maritime Patrol Aircraft Market Size and Share Forecast Outlook 2025 to 2035

Maritime Patrol Naval Vessels Market

Maritime Patrol Naval Vessels Market Growth - Trends & Forecast 2025 to 2035

Real-time Bioprocess Raman Analyzer Market

Real-time Bioprocess Raman Analyzer Market Analysis - Size, Share, and Forecast Outlook 2025 to 2035

Real-Time E-Healthcare System Market

Real-Time E-Healthcare System Market Analysis - Trends & Forecast 2025 to 2035

Real Time Location System (RTLS) Market

RTLS Market – IoT & Asset Tracking Innovations

Real Time Parking System Market

Real Time Parking System Market Growth - Trends & Forecast 2025 to 2035

Real-time Bidding Market

Real-time Bidding Market Insights – Growth & Forecast through 2034

Real Time Continuous Microbiological Monitoring Systems Market

Real Time Continuous Microbiological Monitoring Systems Market

Future Market Insights

Time Temperature Indicator Label Industry Analysis in Western Europe

Chat With MaRIA

Chat With

MaRIA

Hi There, I am MaRIA, Your Market Research Intelligence Assistant. How may I help you?