Time Switch Market Size and Share Forecast Outlook 2025 to 2035

The global time switch market is estimated to grow from USD 2.65 billion in 2025 to USD 4.23 billion by 2035, marking an absolute value addition of USD 1.58 billion, which reflects a total growth of 59.6% over the decade. This translates into a compound annual growth rate (CAGR) of 4.8%, with the market expected to expand nearly 1.6X between 2025 and 2035.
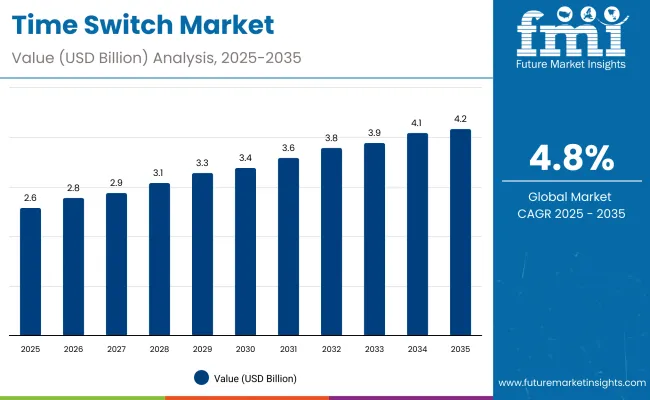
Quick Stats for Time Switch Market

  • Industry Value (2025): USD 2.65 billion
  • Forecast Value (2035): USD 4.23 billion
  • Forecast CAGR: 4.8%
  • Leading Product Type (2025): Digital Time Switches (48% share)
  • Key Growth Application: Lighting Control (34% share)
  • Top Key Players: Schneider Electric, Intermatic, Hager, Theben, ABB Ltd.

Time Switch Market

Metric Value
Industry Size (2025E) USD 2.65 billion
Industry Size (2035F) USD 4.23 billion
CAGR (2025 to 2035) 4.8%

During the initial forecast window from 2025 to 2030, the market is anticipated to increase from USD 2.65 billion to USD 3.49 billion, resulting in an incremental gain of USD 840 million. Growth in this period will likely be driven by heightened adoption of programmable and IoT-enabled time switches for energy management in commercial buildings, automated HVAC systems, and lighting control. The proliferation of smart grid infrastructure and retrofitting activities in developed markets is expected to support upgrades from legacy mechanical timers to digital programmable modules.

Between 2030 and 2035, the market is forecast to scale further from USD 3.49 billion to USD 4.23 billion, adding approximately USD 740 million in value. Demand during this phase will be influenced by deeper penetration of energy efficiency mandates, adoption of wireless and remote-control features, and growing integration of time-based automation in industrial equipment. Manufacturers are likely to emphasize modular designs compatible with DIN rail, panel, and plug-in configurations, especially across Asia Pacific and Latin America.

Between 2020 and 2025, the global time switch market expanded steadily from USD 2.23 billion to USD 2.65 billion, registering an absolute increase of USD 420 million, equivalent to a growth of 18.8% over the five-year period. This translates into a compound annual growth rate (CAGR) of 3.5%. The market demonstrated resilience amid global supply chain disruptions, supported by sustained infrastructure investments, retrofitting initiatives, and energy efficiency programs in developed economies.

Growth during this phase was primarily driven by

  • Accelerated shift from mechanical to digital time switches, particularly in HVAC and outdoor lighting automation across North America and Western Europe.
  • Increased demand for 24-hour and 7-day programmable timers in industrial facilities and commercial buildings, enhancing process efficiency and power scheduling.
  • Compliance with regional energy conservation mandates, including the EU’s EcoDesign Directive and USA DOE efficiency standards, pushing manufacturers to offer high-accuracy, programmable switching modules.
  • Expansion of smart city pilot projects, which required distributed control of streetlights, public signage, and water pumps, creating new avenues for digital time switch installations.

Leading players introduced compact, modular designs with increased relay capacity and DIN rail compatibility. Adoption was particularly strong in retrofitting projects, where older electromechanical timers were replaced by programmable switches with LCD displays and memory backup. By 2025, the market had reached a baseline of USD 2.65 billion, setting the stage for accelerated adoption of IoT-enabled and cloud-synced solutions in the years ahead.

Why the Time Switch Market is Growing?

The time switch market is witnessing sustained growth due to the convergence of energy efficiency demands, smart building integration, and automation-driven infrastructure modernization. As global industries move toward energy-conscious operations, programmable time switches are being adopted widely to minimize unnecessary power consumption by automating lighting, HVAC, and motor operations.

One of the most prominent drivers has been the need for precise load control in commercial and residential buildings, where time switches are integrated into circuit panels to automate indoor and outdoor lighting schedules. Utilities and facility managers increasingly rely on programmable time-based systems to reduce manual interventions, streamline operations, and meet stringent efficiency targets.

The growing penetration of IoT-enabled devices and the shift toward connected infrastructure is also enhancing the relevance of digital time switches. Manufacturers are embedding wireless connectivity, app-based controls, and programmable logic into their devices, allowing real-time remote configuration, time synchronization, and energy monitoring.

Urban expansion and renovation of aging electrical infrastructure in Europe and North America have created new opportunities for time switch retrofits. In parallel, industrial automation trends in Asia-Pacific are boosting the deployment of programmable switches in pump control, conveyor systems, and fan operations.

Regulatory push for daylight harvesting, load shedding, and peak demand control further supports adoption. Programmable astronomical timers are gaining traction as they adjust automatically based on sunrise and sunset, aligning with sustainability goals and reducing energy waste.

Segmentation Overview

The market is segmented by product type into digital and analog variants, offering varied control precision and programming capabilities. Functional classifications include astronomical, cycle, and countdown timers, each serving different use cases in lighting, HVAC, and process automation. Connectivity options are categorized into standalone and IoT-enabled systems, reflecting varying degrees of integration with smart infrastructure. Installation modes span DIN rail, panel mount, plug-in, and wall-mount configurations, enabling use across residential, commercial, and industrial setups.

Based on operation, both manual and automated time switches are available, catering to different user control preferences. Applications cover a broad range, including lighting control, HVAC systems, water pumps, industrial motors, and appliances. This segmentation supports targeted deployment across utility, building automation, and energy management environments.
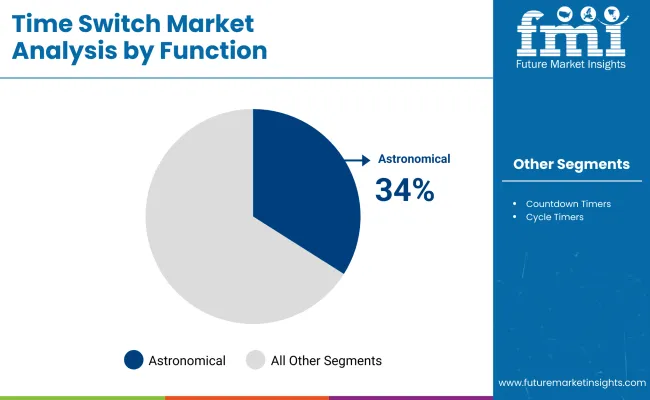
Astronomical Switches Drive Growth in Function-Based Segmentation

Time Switch Market By Function

Astronomical time switches are estimated to hold 34% of the market share in 2025 and are projected to grow steadily through 2035. Their popularity stems from their ability to automatically adjust switching times based on sunrise and sunset, eliminating the need for manual seasonal changes. This feature supports energy efficiency and simplifies outdoor lighting control, especially in commercial and municipal environments. Adoption is increasing in street lighting, signage, and parking lot applications, where consistent and automated light operation is essential.
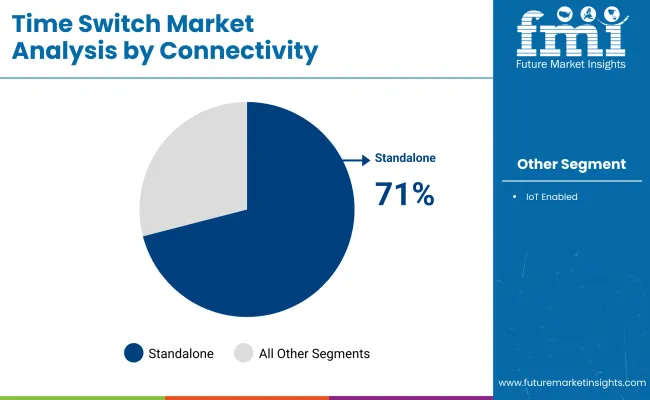
Standalone Time Switches Dominate Connectivity Preferences

Time Switch Market By Connectivity

Standalone time switches are projected to account for 71% of total demand in 2025, reflecting a strong preference for simple, reliable, and cost-effective solutions. These units operate independently without network connectivity, making them ideal for retrofitting in legacy electrical systems or in regions with limited IoT infrastructure. Their widespread use spans residential, commercial, and industrial settings, where basic automation suffices, and minimal maintenance is preferred. Their affordability and ease of installation continue to fuel volume consumption globally.
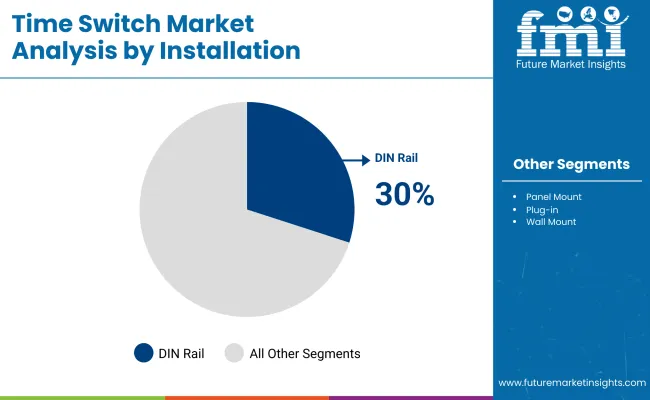
DIN Rail Installation Preferred in Industrial and Panel-Based Systems

Time Switch Market By Installation

DIN rail installation is expected to contribute 30% to total market share in 2025, driven by its compatibility with modular electrical panels and ease of integration in industrial control systems. These switches are commonly used in manufacturing, utilities, and large-scale building automation setups. Their standardized dimensions and secure mounting reduce setup time and allow flexible reconfiguration of electrical enclosures. Adoption remains strong across both OEM panel builders and retrofitting markets.
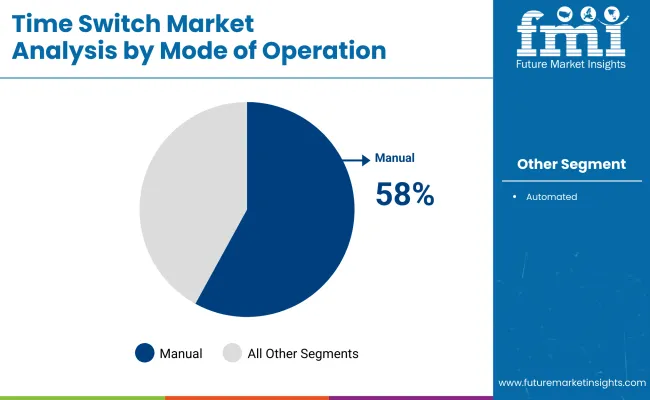
Manual Time Switches Remain Widely Adopted for Simplicity

Time Switch Market By Mode Of Operation

Manual time switches are estimated to represent 58% of market revenue in 2025, driven by their ease of use, lower cost, and suitability for low-complexity applications. These switches are especially favored in residential and small commercial applications where programmable automation is not necessary. Users appreciate their tactile feedback and simple dial or push-button controls. Despite the growing availability of automated alternatives, manual models continue to serve customers prioritizing reliability over digital functionality.

Lighting Control Applications Lead Time Switch Deployment

Lighting control is projected to represent 34% of the total time switch market by 2025, supported by widespread use in both indoor and outdoor lighting systems. These include commercial buildings, homes, street lighting, signage, and architectural illumination setups. Time switches help reduce energy usage by automating on-off cycles based on user-defined schedules or astronomical events. The growing emphasis on energy-efficient infrastructure upgrades and smart lighting retrofits continues to support the segment’s growth across urban and semi-urban regions.
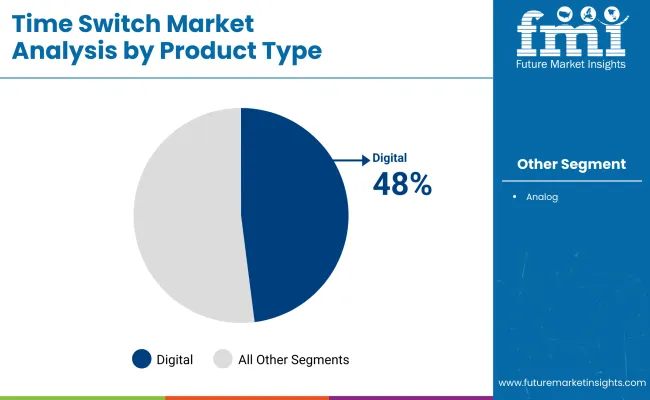
Digital Time Switches Lead Product Type Preferences

Time Switch Market By Product Type

Digital time switches are estimated to hold 48% of the market share in 2025, driven by their precision, flexibility, and advanced scheduling capabilities. These products enable users to program multiple on-off cycles with greater accuracy, suiting commercial and industrial applications. Features such as LCD displays, memory backup, and programmability through mobile apps or keypads contribute to their broad utility. As demand for smart, programmable controls rises, digital variants continue to replace analog counterparts in retrofit and new-build installations.

Key Trends Shaping the Time Switch Market

Growth in the time switch market continues to be steered by automation-centric upgrades across residential, commercial, and industrial segments. Demand patterns are increasingly influenced by energy efficiency mandates, digitalization of infrastructure, and product innovations aimed at connectivity, safety, and ease of use.

Rising Adoption in Smart Infrastructure Projects

Government-led and private smart building initiatives have significantly boosted the adoption of time switches for lighting and HVAC automation. These devices are being deployed to schedule appliance operations, thereby reducing idle energy consumption and extending equipment lifespan. Urban infrastructure projects in Europe, India, and the Middle East are promoting programmable time switches to align with low-carbon and green building certifications.

Shift from Analog to Digital Systems

A clear trend is emerging toward replacing traditional analog time switches with advanced digital variants. Digital systems allow users to set complex programming schedules, integrate daylight savings adjustments, and operate multiple circuits through a single device. This transition is being accelerated by smart grid deployments and greater availability of programmable logic-based controllers in industrial control panels.

Growth of IoT-Enabled Devices in Energy Management

IoT-enabled time switches with wireless communication capabilities are redefining energy scheduling. Integration with building automation systems (BAS), mobile apps, and cloud dashboards allows real-time monitoring, remote scheduling, and predictive maintenance. These smart time switches are being adopted by commercial property developers and facility managers for distributed lighting and appliance control.

Expansion in Utility and Outdoor Applications

The use of astronomical and countdown timers is expanding across street lighting, water pumps, and outdoor signage. Municipalities and facility managers are investing in these systems to automate dusk-to-dawn lighting and irrigation schedules. Battery backup, tamper resistance, and auto-adjust features are becoming standard across high-volume outdoor time switch deployments.
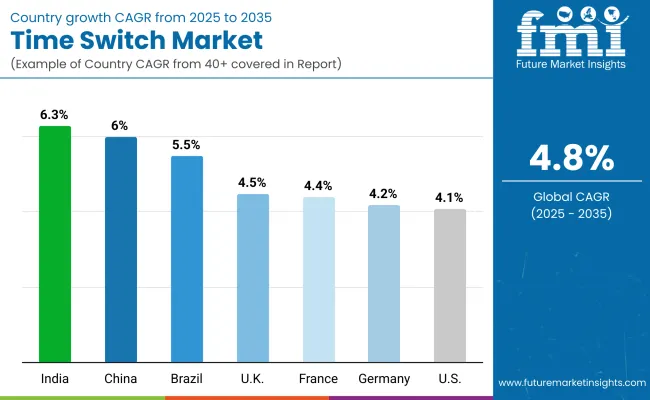
Europe Market Split by Country

Country Wise Analysis Time Switch Market

The time switch market across Europe is projected to expand from USD 660.4 million in 2025 to USD 994.5 million by 2035, reflecting a compound annual growth rate (CAGR) of 4.2%. Germany is expected to retain its market dominance, accounting for 25% of the regional market in both 2025 and 2035. France, the UK, and Italy follow closely, each representing over 11% of the share, driven by consistent upgrades in building automation systems and energy compliance policies.

The Rest of Europe is expected to hold a stable contribution of over 22%, indicating rising demand in Central and Eastern European nations. Spain’s share is projected to rise slightly from 8.0% to 8.4%, supported by demand for smart irrigation and outdoor lighting time switches.

Key Countries Growth Outlook

India to Lead Time Switch Market Growth Through 2035

India is expected to exhibit the fastest growth among major economies, with a CAGR of 6.3% during the forecast period. Rapid expansion of infrastructure, rising smart city deployments, and increased integration of automated HVAC, lighting, and pumping systems across commercial and residential sectors are driving demand for programmable and IoT-enabled time switches.

  • Surge in infrastructure development projects and smart buildings
  • Government-led energy efficiency and automation initiatives
  • Strong growth in commercial real estate and metro rail networks
  • Adoption of water pumping automation in agriculture and housing

China Poised for Strong Adoption of Smart Time Switches

China’s time switch market is forecast to grow at 6.0% CAGR through 2035. Industrial automation, grid modernization, and rapid urban expansion are enabling strong adoption of time control devices, especially in manufacturing hubs and smart city zones.

  • Uptake of programmable time switches in smart manufacturing zones
  • Strong demand from metro, tunnel, and highway lighting systems
  • Policies mandating energy-saving devices in construction
  • Local production of digital and Wi-Fi time switches rising

Brazil Gaining Momentum with Building Automation

Brazil is projected to record a 5.5% CAGR, driven by the increasing penetration of automation in commercial and industrial buildings. Demand is rising for smart control of lighting, security, and HVAC systems in mid-sized urban centers.

  • Construction of energy-efficient buildings in urban areas
  • Rising demand for weather-resistant outdoor timer switches
  • Supportive green building regulations in select states
  • Growing presence of regional distributors and smart switch brands

UK Sees Growth in Smart Building Renovations

The UK is set to expand at a CAGR of 4.5%, supported by retrofitting of older infrastructure with smart control systems. Time switches are increasingly used in lighting, signage, and heating control in both private and public buildings.

  • Focus on energy compliance in historical building retrofits
  • Use of astronomical and IoT-based timers in outdoor applications
  • High replacement demand in residential sector
  • Growth in Wi-Fi-based programmable switch adoption

France Maintains Stable Growth in Building Automation

France is anticipated to register a 4.4% CAGR. Automation of residential heating systems and increasing usage of DIN rail time switches in multi-dwelling units are the main contributors to this steady expansion.

  • Growth in demand for heating and hot water control
  • Steady rollout of smart metering and energy saving devices
  • Preference for compact, programmable DIN-mount switches
  • Increased replacement of legacy mechanical units

Germany Continues Upgrades in Industrial and Municipal Projects

Germany’s time switch market is projected to grow at 4.2% CAGR. Expansion in industrial automation, paired with large-scale municipal lighting programs, continues to generate demand for both panel-mount and plug-in time switches.

  • Adoption of programmable timers in factory environments
  • Integration into smart street lighting and public infrastructure
  • Retrofitting initiatives in energy-intensive sectors
  • Strong preference for durable, certified switchgear

USA Benefits from Smart Home Integration

The USA market is forecast to grow at 4.1% CAGR. Growth is influenced by the continued integration of programmable time switches into smart home systems, particularly in lighting and outdoor applications.

  • High demand for smart-enabled outdoor timer controls
  • Integration with voice assistants and home automation hubs
  • Growing adoption in irrigation, pool, and security systems
  • Focus on energy-efficient lighting in residential retrofits

Japan: Digital Time Switches to Gain Traction

In Japan, analog time switches currently hold a marginal lead, accounting for 52.0% of the total market value in 2025, translating to approximately USD 75.8 million out of the total USD 145.8 million. However, digital variants are steadily gaining popularity and represent 48.0% of the market. The transition is being supported by increased adoption across commercial lighting, HVAC control, and IoT-enabled appliances, where digital flexibility and precision are preferred. Government energy efficiency mandates are also encouraging facility operators to shift from legacy analog setups to programmable digital alternatives, especially in high-density residential zones.

Key Highlights:

  • Analog time switches dominate marginally, but digital is fast catching up.
  • Facility automation in lighting and HVAC drives digital adoption.
  • Retrofit installations in aging infrastructure support dual-format compatibility.

South Korea: Countdown Timers Lead Functional Adoption

In South Korea, countdown timers dominate the functional segmentation of the time switch market in 2025 with a 41.0% share, amounting to nearly USD 34.8 million of the total USD 84.8 million market. Astronomical timers follow at 32.0%, while cycle timers hold a 27.0% share. Countdown timers are widely integrated in residential buildings, consumer appliances, and low-voltage industrial setups due to their ease of installation and user-configurable scheduling. Astronomical timers are preferred in smart city infrastructure and commercial lighting owing to their automatic dusk-to-dawn operation.
  • Countdown timers remain the most adopted function due to cost efficiency and usability.
  • Astronomical timers benefit from smart grid deployments and city-wide lighting control.
  • South Korea’s smart infrastructure policies are accelerating functional diversification.

Competition Outlook

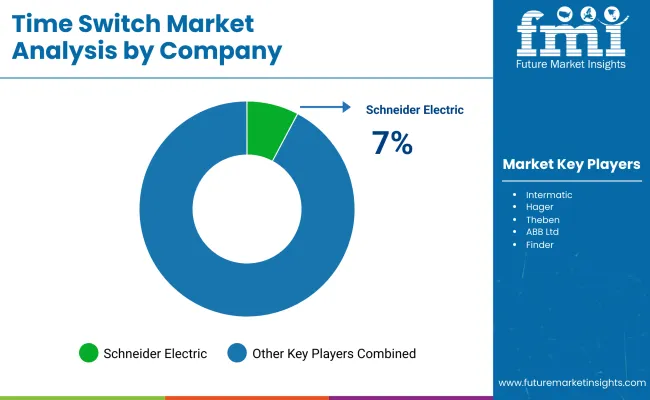
Time Switch Market By Company

Competition in the time switch market is being shaped by the introduction of versatile, energy-efficient, and programmable solutions. Companies are focusing on devices that integrate astronomical timing functions, multi-output scheduling, and automation capabilities to enhance operational efficiency across lighting, HVAC, and industrial systems. The landscape is increasingly competitive as manufacturers emphasize user-friendly interfaces, customization options, and smart scheduling to meet commercial and residential energy management needs.

  • In June 2024, Timeguard introduced the Micro Astro time switch, combining an astronomical timing function with daily program settings to offer energy-efficient control for lighting and heating systems.
  • In July 2023, Qwatt Technologies launched a multi-programmable 4-output time switch, designed to automate signboard lighting and industrial equipment operations. The product allows users to configure multiple schedules for energy optimization.

Companies

  • Schneider Electric
  • Intermatic
  • Hager
  • Theben
  • ABB Ltd.
  • Finder
  • Legrand
  • NSi Industries
  • ORBIS
  • Havells

Scope of the Report

Item Inclusions
Quantitative Units Market Value (USD Billion), Market Volume (Units)
By Product Type Digital, Analog
By Function Astronomical, Cycle Timers, Countdown Timers
By Connectivity Standalone, IoT Enabled
By Installation DIN Rail, Panel Mount, Plug-in, Wall Mount
By Mode of Operation Manual, Automated
By Application Lighting Control, HVAC Systems, Water Pumps, Industrial Motors, Security Systems, Appliance Controls, Open/Close Systems, Others
By Regions North America, Latin America, Eastern Europe, Western Europe, East Asia, South Asia & Pacific, Middle East & Africa
Key Countries USA, Canada, Mexico, Brazil, Germany, Italy, France, UK, Spain, BENELUX, Nordics, Russia, Hungary, Poland, India, China, Japan, South Korea, Turkiye, South Africa, GCC Countries

Key Segments

By Product Type:

  • Digital
  • Analog

By Function:

  • Astronomical
  • Cycle Timers
  • Countdown Timers

By Connectivity:

  • Standalone
  • IoT Enabled

By Installation:

  • DIN Rail
  • Panel Mount
  • Plug-in
  • Wall Mount

By Mode of Operation:

  • Manual
  • Automated

By Application:

  • Lighting Control
  • HVAC Systems
  • Water Pumps
  • Industrial Motors
  • Security Systems
  • Appliance Controls
  • Open/Close Systems
  • Others

By Region:

  • North America
  • Latin America
  • Western Europe
  • Eastern Europe
  • East Asia
  • South Asia and Pacific
  • Middle East & Africa

Table of Content

  1. Executive Summary
    • Global Market Outlook
    • Demand-side Trends
    • Supply-side Trends
    • Technology Roadmap Analysis
    • Analysis and Recommendations
  2. Market Overview
    • Market Coverage / Taxonomy
    • Market Definition / Scope / Limitations
  3. Market Background
    • Market Dynamics
      • Drivers
      • Restraints
      • Opportunity
      • Trends
    • Scenario Forecast
      • Demand in Optimistic Scenario
      • Demand in Likely Scenario
      • Demand in Conservative Scenario
    • Opportunity Map Analysis
    • Product Life Cycle Analysis
    • Supply Chain Analysis
    • Investment Feasibility Matrix
    • Value Chain Analysis
    • PESTLE and Porter’s Analysis
    • Regulatory Landscape
    • Regional Parent Market Outlook
  4. Global Market Analysis 2020 to 2024 and Forecast, 2025 to 2035
    • Historical Market Size Value (USD Million) Analysis, 2020 to 2024
    • Current and Future Market Size Value (USD Million) Projections, 2025 to 2035
      • Y-o-Y Growth Trend Analysis
      • Absolute $ Opportunity Analysis
  5. Global Market Pricing Analysis 2020 to 2024 and Forecast 2025 to 2035
  6. Global Market Analysis 2020 to 2024 and Forecast 2025 to 2035, By Product Type
    • Introduction / Key Findings
    • Historical Market Size Value (USD Million) Analysis By Product Type, 2020 to 2024
    • Current and Future Market Size Value (USD Million) Analysis and Forecast By Product Type, 2025 to 2035
      • Digital
      • Analog
    • Y-o-Y Growth Trend Analysis By Product Type, 2020 to 2024
    • Absolute $ Opportunity Analysis By Product Type, 2025 to 2035
  7. Global Market Analysis 2020 to 2024 and Forecast 2025 to 2035, By Function
    • Introduction / Key Findings
    • Historical Market Size Value (USD Million) Analysis By Function, 2020 to 2024
    • Current and Future Market Size Value (USD Million) Analysis and Forecast By Function, 2025 to 2035
      • Astronomical
      • Cycle Timers
      • Countdown Timers
    • Y-o-Y Growth Trend Analysis By Function, 2020 to 2024
    • Absolute $ Opportunity Analysis By Function, 2025 to 2035
  8. Global Market Analysis 2020 to 2024 and Forecast 2025 to 2035, By Connectivity
    • Introduction / Key Findings
    • Historical Market Size Value (USD Million) Analysis By Connectivity, 2020 to 2024
    • Current and Future Market Size Value (USD Million) Analysis and Forecast By Connectivity, 2025 to 2035
      • Standalone
      • IoT Enabled
    • Y-o-Y Growth Trend Analysis By Connectivity, 2020 to 2024
    • Absolute $ Opportunity Analysis By Connectivity, 2025 to 2035
  9. Global Market Analysis 2020 to 2024 and Forecast 2025 to 2035, By Installation
    • Introduction / Key Findings
    • Historical Market Size Value (USD Million) Analysis By Installation, 2020 to 2024
    • Current and Future Market Size Value (USD Million) Analysis and Forecast By Installation, 2025 to 2035
      • DIN Rail
      • Panel Mount
      • Plug-in
      • Wall Mount
    • Y-o-Y Growth Trend Analysis By Installation, 2020 to 2024
    • Absolute $ Opportunity Analysis By Installation, 2025 to 2035
  10. Global Market Analysis 2020 to 2024 and Forecast 2025 to 2035, By Mode of Operation
    • Introduction / Key Findings
    • Historical Market Size Value (USD Million) Analysis By Mode of Operation, 2020 to 2024
    • Current and Future Market Size Value (USD Million) Analysis and Forecast By Mode of Operation, 2025 to 2035
      • Manual
      • Automated
    • Y-o-Y Growth Trend Analysis By Mode of Operation, 2020 to 2024
    • Absolute $ Opportunity Analysis By Mode of Operation, 2025 to 2035
  11. Global Market Analysis 2020 to 2024 and Forecast 2025 to 2035, By Application
    • Introduction / Key Findings
    • Historical Market Size Value (USD Million) Analysis By Application, 2020 to 2024
    • Current and Future Market Size Value (USD Million) Analysis and Forecast By Application, 2025 to 2035
      • Lighting Control
      • HVAC Systems
      • Water Pumps
      • Industrial Motors
      • Security Systems
      • Appliance Controls
      • Open/Close Systems
      • Others
    • Y-o-Y Growth Trend Analysis By Application, 2020 to 2024
    • Absolute $ Opportunity Analysis By Application, 2025 to 2035
  12. Global Market Analysis 2020 to 2024 and Forecast 2025 to 2035, By Region
    • Introduction
    • Historical Market Size Value (USD Million) Analysis By Region, 2020 to 2024
    • Current Market Size Value (USD Million) Analysis and Forecast By Region, 2025 to 2035
      • North America
      • Latin America
      • Western Europe
      • Eastern Europe
      • East Asia
      • South Asia and Pacific
      • Middle East & Africa
    • Market Attractiveness Analysis By Region
  13. North America Market Analysis 2020 to 2024 and Forecast 2025 to 2035, By Country
    • Historical Market Size Value (USD Million) Trend Analysis By Market Taxonomy, 2020 to 2024
    • Market Size Value (USD Million) Forecast By Market Taxonomy, 2025 to 2035
      • By Country
        • USA
        • Canada
        • Mexico
      • By Product Type
      • By Function
      • By Connectivity
      • By Installation
      • By Mode of Operation
      • By Application
    • Market Attractiveness Analysis
      • By Country
      • By Product Type
      • By Function
      • By Connectivity
      • By Installation
      • By Mode of Operation
      • By Application
    • Key Takeaways
  14. Latin America Market Analysis 2020 to 2024 and Forecast 2025 to 2035, By Country
    • Historical Market Size Value (USD Million) Trend Analysis By Market Taxonomy, 2020 to 2024
    • Market Size Value (USD Million) Forecast By Market Taxonomy, 2025 to 2035
      • By Country
        • Brazil
        • Chile
        • Rest of Latin America
      • By Product Type
      • By Function
      • By Connectivity
      • By Installation
      • By Mode of Operation
      • By Application
    • Market Attractiveness Analysis
      • By Country
      • By Product Type
      • By Function
      • By Connectivity
      • By Installation
      • By Mode of Operation
      • By Application
    • Key Takeaways
  15. Western Europe Market Analysis 2020 to 2024 and Forecast 2025 to 2035, By Country
    • Historical Market Size Value (USD Million) Trend Analysis By Market Taxonomy, 2020 to 2024
    • Market Size Value (USD Million) Forecast By Market Taxonomy, 2025 to 2035
      • By Country
        • Germany
        • UK
        • Italy
        • Spain
        • France
        • Nordic
        • BENELUX
        • Rest of Western Europe
      • By Product Type
      • By Function
      • By Connectivity
      • By Installation
      • By Mode of Operation
      • By Application
    • Market Attractiveness Analysis
      • By Country
      • By Product Type
      • By Function
      • By Connectivity
      • By Installation
      • By Mode of Operation
      • By Application
    • Key Takeaways
  16. Eastern Europe Market Analysis 2020 to 2024 and Forecast 2025 to 2035, By Country
    • Historical Market Size Value (USD Million) Trend Analysis By Market Taxonomy, 2020 to 2024
    • Market Size Value (USD Million) Forecast By Market Taxonomy, 2025 to 2035
      • By Country
        • Russia
        • Poland
        • Hungary
        • Balkan & Baltic
        • Rest of Eastern Europe
      • By Product Type
      • By Function
      • By Connectivity
      • By Installation
      • By Mode of Operation
      • By Application
    • Market Attractiveness Analysis
      • By Country
      • By Product Type
      • By Function
      • By Connectivity
      • By Installation
      • By Mode of Operation
      • By Application
    • Key Takeaways
  17. East Asia Market Analysis 2020 to 2024 and Forecast 2025 to 2035, By Country
    • Historical Market Size Value (USD Million) Trend Analysis By Market Taxonomy, 2020 to 2024
    • Market Size Value (USD Million) Forecast By Market Taxonomy, 2025 to 2035
      • By Country
        • China
        • Japan
        • South Korea
      • By Product Type
      • By Function
      • By Connectivity
      • By Installation
      • By Mode of Operation
      • By Application
    • Market Attractiveness Analysis
      • By Country
      • By Product Type
      • By Function
      • By Connectivity
      • By Installation
      • By Mode of Operation
      • By Application
    • Key Takeaways
  18. South Asia and Pacific Market Analysis 2020 to 2024 and Forecast 2025 to 2035, By Country
    • Historical Market Size Value (USD Million) Trend Analysis By Market Taxonomy, 2020 to 2024
    • Market Size Value (USD Million) Forecast By Market Taxonomy, 2025 to 2035
      • By Country
        • India
        • ASEAN
        • Australia & New Zealand
        • Rest of South Asia and Pacific
      • By Product Type
      • By Function
      • By Connectivity
      • By Installation
      • By Mode of Operation
      • By Application
    • Market Attractiveness Analysis
      • By Country
      • By Product Type
      • By Function
      • By Connectivity
      • By Installation
      • By Mode of Operation
      • By Application
    • Key Takeaways
  19. Middle East & Africa Market Analysis 2020 to 2024 and Forecast 2025 to 2035, By Country
    • Historical Market Size Value (USD Million) Trend Analysis By Market Taxonomy, 2020 to 2024
    • Market Size Value (USD Million) Forecast By Market Taxonomy, 2025 to 2035
      • By Country
        • Kingdom of Saudi Arabia
        • Other GCC Countries
        • Turkiye
        • South Africa
        • Other African Union
        • Rest of Middle East & Africa
      • By Product Type
      • By Function
      • By Connectivity
      • By Installation
      • By Mode of Operation
      • By Application
    • Market Attractiveness Analysis
      • By Country
      • By Product Type
      • By Function
      • By Connectivity
      • By Installation
      • By Mode of Operation
      • By Application
    • Key Takeaways
  20. Key Countries Market Analysis
    • USA
      • Pricing Analysis
      • Market Share Analysis, 2024
        • By Product Type
        • By Function
        • By Connectivity
        • By Installation
        • By Mode of Operation
        • By Application
    • Canada
      • Pricing Analysis
      • Market Share Analysis, 2024
        • By Product Type
        • By Function
        • By Connectivity
        • By Installation
        • By Mode of Operation
        • By Application
    • Mexico
      • Pricing Analysis
      • Market Share Analysis, 2024
        • By Product Type
        • By Function
        • By Connectivity
        • By Installation
        • By Mode of Operation
        • By Application
    • Brazil
      • Pricing Analysis
      • Market Share Analysis, 2024
        • By Product Type
        • By Function
        • By Connectivity
        • By Installation
        • By Mode of Operation
        • By Application
    • Chile
      • Pricing Analysis
      • Market Share Analysis, 2024
        • By Product Type
        • By Function
        • By Connectivity
        • By Installation
        • By Mode of Operation
        • By Application
    • Germany
      • Pricing Analysis
      • Market Share Analysis, 2024
        • By Product Type
        • By Function
        • By Connectivity
        • By Installation
        • By Mode of Operation
        • By Application
    • UK
      • Pricing Analysis
      • Market Share Analysis, 2024
        • By Product Type
        • By Function
        • By Connectivity
        • By Installation
        • By Mode of Operation
        • By Application
    • Italy
      • Pricing Analysis
      • Market Share Analysis, 2024
        • By Product Type
        • By Function
        • By Connectivity
        • By Installation
        • By Mode of Operation
        • By Application
    • Spain
      • Pricing Analysis
      • Market Share Analysis, 2024
        • By Product Type
        • By Function
        • By Connectivity
        • By Installation
        • By Mode of Operation
        • By Application
    • France
      • Pricing Analysis
      • Market Share Analysis, 2024
        • By Product Type
        • By Function
        • By Connectivity
        • By Installation
        • By Mode of Operation
        • By Application
    • India
      • Pricing Analysis
      • Market Share Analysis, 2024
        • By Product Type
        • By Function
        • By Connectivity
        • By Installation
        • By Mode of Operation
        • By Application
    • ASEAN
      • Pricing Analysis
      • Market Share Analysis, 2024
        • By Product Type
        • By Function
        • By Connectivity
        • By Installation
        • By Mode of Operation
        • By Application
    • Australia & New Zealand
      • Pricing Analysis
      • Market Share Analysis, 2024
        • By Product Type
        • By Function
        • By Connectivity
        • By Installation
        • By Mode of Operation
        • By Application
    • China
      • Pricing Analysis
      • Market Share Analysis, 2024
        • By Product Type
        • By Function
        • By Connectivity
        • By Installation
        • By Mode of Operation
        • By Application
    • Japan
      • Pricing Analysis
      • Market Share Analysis, 2024
        • By Product Type
        • By Function
        • By Connectivity
        • By Installation
        • By Mode of Operation
        • By Application
    • South Korea
      • Pricing Analysis
      • Market Share Analysis, 2024
        • By Product Type
        • By Function
        • By Connectivity
        • By Installation
        • By Mode of Operation
        • By Application
    • Russia
      • Pricing Analysis
      • Market Share Analysis, 2024
        • By Product Type
        • By Function
        • By Connectivity
        • By Installation
        • By Mode of Operation
        • By Application
    • Poland
      • Pricing Analysis
      • Market Share Analysis, 2024
        • By Product Type
        • By Function
        • By Connectivity
        • By Installation
        • By Mode of Operation
        • By Application
    • Hungary
      • Pricing Analysis
      • Market Share Analysis, 2024
        • By Product Type
        • By Function
        • By Connectivity
        • By Installation
        • By Mode of Operation
        • By Application
    • Kingdom of Saudi Arabia
      • Pricing Analysis
      • Market Share Analysis, 2024
        • By Product Type
        • By Function
        • By Connectivity
        • By Installation
        • By Mode of Operation
        • By Application
    • Turkiye
      • Pricing Analysis
      • Market Share Analysis, 2024
        • By Product Type
        • By Function
        • By Connectivity
        • By Installation
        • By Mode of Operation
        • By Application
    • South Africa
      • Pricing Analysis
      • Market Share Analysis, 2024
        • By Product Type
        • By Function
        • By Connectivity
        • By Installation
        • By Mode of Operation
        • By Application
  21. Market Structure Analysis
    • Competition Dashboard
    • Competition Benchmarking
    • Market Share Analysis of Top Players
      • By Regional
      • By Product Type
      • By Function
      • By Connectivity
      • By Installation
      • By Mode of Operation
      • By Application
  22. Competition Analysis
    • Competition Deep Dive
      • Schneider Electric
        • Overview
        • Product Portfolio
        • Profitability by Market Segments (Product/Age /Sales Channel/Region)
        • Sales Footprint
        • Strategy Overview
        • Intermatic
        • Hager
        • Theben
        • ABB Ltd.
        • Finder
        • Legrand
        • NSi Industries
        • ORBIS
        • Havells
    • Assumptions & Acronyms Used
    • Research Methodology

List of Tables

  • Table 1: Global Market Value (USD Million) Forecast by Region, 2020-2035
  • Table 2: Global Market Value (USD Million) Forecast by Product Type, 2020-2035
  • Table 3: Global Market Value (USD Million) Forecast by Function, 2020-2035
  • Table 4: Global Market Value (USD Million) Forecast by Connectivity, 2020-2035
  • Table 5: Global Market Value (USD Million) Forecast by Installation, 2020-2035
  • Table 6: Global Market Value (USD Million) Forecast by Mode of Operation, 2020-2035
  • Table 7: Global Market Value (USD Million) Forecast by Application, 2020-2035
  • Table 8: North America Market Value (USD Million) Forecast by Country, 2020-2035
  • Table 9: North America Market Value (USD Million) Forecast by Product Type, 2020-2035
  • Table 10: North America Market Value (USD Million) Forecast by Function, 2020-2035
  • Table 11: North America Market Value (USD Million) Forecast by Connectivity, 2020-2035
  • Table 12: North America Market Value (USD Million) Forecast by Installation, 2020-2035
  • Table 13: North America Market Value (USD Million) Forecast by Mode of Operation, 2020-2035
  • Table 14: North America Market Value (USD Million) Forecast by Application, 2020-2035
  • Table 15: Latin America Market Value (USD Million) Forecast by Country, 2020-2035
  • Table 16: Latin America Market Value (USD Million) Forecast by Product Type, 2020-2035
  • Table 17: Latin America Market Value (USD Million) Forecast by Function, 2020-2035
  • Table 18: Latin America Market Value (USD Million) Forecast by Connectivity, 2020-2035
  • Table 19: Latin America Market Value (USD Million) Forecast by Installation, 2020-2035
  • Table 20: Latin America Market Value (USD Million) Forecast by Mode of Operation, 2020-2035
  • Table 21: Latin America Market Value (USD Million) Forecast by Application, 2020-2035
  • Table 22: Western Europe Market Value (USD Million) Forecast by Country, 2020-2035
  • Table 23: Western Europe Market Value (USD Million) Forecast by Product Type, 2020-2035
  • Table 24: Western Europe Market Value (USD Million) Forecast by Function, 2020-2035
  • Table 25: Western Europe Market Value (USD Million) Forecast by Connectivity, 2020-2035
  • Table 26: Western Europe Market Value (USD Million) Forecast by Installation, 2020-2035
  • Table 27: Western Europe Market Value (USD Million) Forecast by Mode of Operation, 2020-2035
  • Table 28: Western Europe Market Value (USD Million) Forecast by Application, 2020-2035
  • Table 29: Eastern Europe Market Value (USD Million) Forecast by Country, 2020-2035
  • Table 30: Eastern Europe Market Value (USD Million) Forecast by Product Type, 2020-2035
  • Table 31: Eastern Europe Market Value (USD Million) Forecast by Function, 2020-2035
  • Table 32: Eastern Europe Market Value (USD Million) Forecast by Connectivity, 2020-2035
  • Table 33: Eastern Europe Market Value (USD Million) Forecast by Installation, 2020-2035
  • Table 34: Eastern Europe Market Value (USD Million) Forecast by Mode of Operation, 2020-2035
  • Table 35: Eastern Europe Market Value (USD Million) Forecast by Application, 2020-2035
  • Table 36: East Asia Market Value (USD Million) Forecast by Country, 2020-2035
  • Table 37: East Asia Market Value (USD Million) Forecast by Product Type, 2020-2035
  • Table 38: East Asia Market Value (USD Million) Forecast by Function, 2020-2035
  • Table 39: East Asia Market Value (USD Million) Forecast by Connectivity, 2020-2035
  • Table 40: East Asia Market Value (USD Million) Forecast by Installation, 2020-2035
  • Table 41: East Asia Market Value (USD Million) Forecast by Mode of Operation, 2020-2035
  • Table 42: East Asia Market Value (USD Million) Forecast by Application, 2020-2035
  • Table 43: South Asia and Pacific Market Value (USD Million) Forecast by Country, 2020-2035
  • Table 44: South Asia and Pacific Market Value (USD Million) Forecast by Product Type, 2020-2035
  • Table 45: South Asia and Pacific Market Value (USD Million) Forecast by Function, 2020-2035
  • Table 46: South Asia and Pacific Market Value (USD Million) Forecast by Connectivity, 2020-2035
  • Table 47: South Asia and Pacific Market Value (USD Million) Forecast by Installation, 2020-2035
  • Table 48: South Asia and Pacific Market Value (USD Million) Forecast by Mode of Operation, 2020-2035
  • Table 49: South Asia and Pacific Market Value (USD Million) Forecast by Application, 2020-2035
  • Table 50: Middle East & Africa Market Value (USD Million) Forecast by Country, 2020-2035
  • Table 51: Middle East & Africa Market Value (USD Million) Forecast by Product Type, 2020-2035
  • Table 52: Middle East & Africa Market Value (USD Million) Forecast by Function, 2020-2035
  • Table 53: Middle East & Africa Market Value (USD Million) Forecast by Connectivity, 2020-2035
  • Table 54: Middle East & Africa Market Value (USD Million) Forecast by Installation, 2020-2035
  • Table 55: Middle East & Africa Market Value (USD Million) Forecast by Mode of Operation, 2020-2035
  • Table 56: Middle East & Africa Market Value (USD Million) Forecast by Application, 2020-2035

List of Figures

  • Figure 1: Global Market Pricing Analysis
  • Figure 2: Global Market Value (USD Million) Forecast 2020-2035
  • Figure 3: Global Market Value Share and BPS Analysis by Product Type, 2025 and 2035
  • Figure 4: Global Market Y-o-Y Growth Comparison by Product Type, 2025-2035
  • Figure 5: Global Market Attractiveness Analysis by Product Type
  • Figure 6: Global Market Value Share and BPS Analysis by Function, 2025 and 2035
  • Figure 7: Global Market Y-o-Y Growth Comparison by Function, 2025-2035
  • Figure 8: Global Market Attractiveness Analysis by Function
  • Figure 9: Global Market Value Share and BPS Analysis by Connectivity, 2025 and 2035
  • Figure 10: Global Market Y-o-Y Growth Comparison by Connectivity, 2025-2035
  • Figure 11: Global Market Attractiveness Analysis by Connectivity
  • Figure 12: Global Market Value Share and BPS Analysis by Installation, 2025 and 2035
  • Figure 13: Global Market Y-o-Y Growth Comparison by Installation, 2025-2035
  • Figure 14: Global Market Attractiveness Analysis by Installation
  • Figure 15: Global Market Value Share and BPS Analysis by Mode of Operation, 2025 and 2035
  • Figure 16: Global Market Y-o-Y Growth Comparison by Mode of Operation, 2025-2035
  • Figure 17: Global Market Attractiveness Analysis by Mode of Operation
  • Figure 18: Global Market Value Share and BPS Analysis by Application, 2025 and 2035
  • Figure 19: Global Market Y-o-Y Growth Comparison by Application, 2025-2035
  • Figure 20: Global Market Attractiveness Analysis by Application
  • Figure 21: Global Market Value (USD Million) Share and BPS Analysis by Region, 2025 and 2035
  • Figure 22: Global Market Y-o-Y Growth Comparison by Region, 2025-2035
  • Figure 23: Global Market Attractiveness Analysis by Region
  • Figure 24: North America Market Incremental $ Opportunity, 2025-2035
  • Figure 25: Latin America Market Incremental $ Opportunity, 2025-2035
  • Figure 26: Western Europe Market Incremental $ Opportunity, 2025-2035
  • Figure 27: Eastern Europe Market Incremental $ Opportunity, 2025-2035
  • Figure 28: East Asia Market Incremental $ Opportunity, 2025-2035
  • Figure 29: South Asia and Pacific Market Incremental $ Opportunity, 2025-2035
  • Figure 30: Middle East & Africa Market Incremental $ Opportunity, 2025-2035
  • Figure 31: North America Market Value Share and BPS Analysis by Country, 2025 and 2035
  • Figure 32: North America Market Value Share and BPS Analysis by Product Type, 2025 and 2035
  • Figure 33: North America Market Y-o-Y Growth Comparison by Product Type, 2025-2035
  • Figure 34: North America Market Attractiveness Analysis by Product Type
  • Figure 35: North America Market Value Share and BPS Analysis by Function, 2025 and 2035
  • Figure 36: North America Market Y-o-Y Growth Comparison by Function, 2025-2035
  • Figure 37: North America Market Attractiveness Analysis by Function
  • Figure 38: North America Market Value Share and BPS Analysis by Connectivity, 2025 and 2035
  • Figure 39: North America Market Y-o-Y Growth Comparison by Connectivity, 2025-2035
  • Figure 40: North America Market Attractiveness Analysis by Connectivity
  • Figure 41: North America Market Value Share and BPS Analysis by Installation, 2025 and 2035
  • Figure 42: North America Market Y-o-Y Growth Comparison by Installation, 2025-2035
  • Figure 43: North America Market Attractiveness Analysis by Installation
  • Figure 44: North America Market Value Share and BPS Analysis by Mode of Operation, 2025 and 2035
  • Figure 45: North America Market Y-o-Y Growth Comparison by Mode of Operation, 2025-2035
  • Figure 46: North America Market Attractiveness Analysis by Mode of Operation
  • Figure 47: North America Market Value Share and BPS Analysis by Application, 2025 and 2035
  • Figure 48: North America Market Y-o-Y Growth Comparison by Application, 2025-2035
  • Figure 49: North America Market Attractiveness Analysis by Application
  • Figure 50: Latin America Market Value Share and BPS Analysis by Country, 2025 and 2035
  • Figure 51: Latin America Market Value Share and BPS Analysis by Product Type, 2025 and 2035
  • Figure 52: Latin America Market Y-o-Y Growth Comparison by Product Type, 2025-2035
  • Figure 53: Latin America Market Attractiveness Analysis by Product Type
  • Figure 54: Latin America Market Value Share and BPS Analysis by Function, 2025 and 2035
  • Figure 55: Latin America Market Y-o-Y Growth Comparison by Function, 2025-2035
  • Figure 56: Latin America Market Attractiveness Analysis by Function
  • Figure 57: Latin America Market Value Share and BPS Analysis by Connectivity, 2025 and 2035
  • Figure 58: Latin America Market Y-o-Y Growth Comparison by Connectivity, 2025-2035
  • Figure 59: Latin America Market Attractiveness Analysis by Connectivity
  • Figure 60: Latin America Market Value Share and BPS Analysis by Installation, 2025 and 2035
  • Figure 61: Latin America Market Y-o-Y Growth Comparison by Installation, 2025-2035
  • Figure 62: Latin America Market Attractiveness Analysis by Installation
  • Figure 63: Latin America Market Value Share and BPS Analysis by Mode of Operation, 2025 and 2035
  • Figure 64: Latin America Market Y-o-Y Growth Comparison by Mode of Operation, 2025-2035
  • Figure 65: Latin America Market Attractiveness Analysis by Mode of Operation
  • Figure 66: Latin America Market Value Share and BPS Analysis by Application, 2025 and 2035
  • Figure 67: Latin America Market Y-o-Y Growth Comparison by Application, 2025-2035
  • Figure 68: Latin America Market Attractiveness Analysis by Application
  • Figure 69: Western Europe Market Value Share and BPS Analysis by Country, 2025 and 2035
  • Figure 70: Western Europe Market Value Share and BPS Analysis by Product Type, 2025 and 2035
  • Figure 71: Western Europe Market Y-o-Y Growth Comparison by Product Type, 2025-2035
  • Figure 72: Western Europe Market Attractiveness Analysis by Product Type
  • Figure 73: Western Europe Market Value Share and BPS Analysis by Function, 2025 and 2035
  • Figure 74: Western Europe Market Y-o-Y Growth Comparison by Function, 2025-2035
  • Figure 75: Western Europe Market Attractiveness Analysis by Function
  • Figure 76: Western Europe Market Value Share and BPS Analysis by Connectivity, 2025 and 2035
  • Figure 77: Western Europe Market Y-o-Y Growth Comparison by Connectivity, 2025-2035
  • Figure 78: Western Europe Market Attractiveness Analysis by Connectivity
  • Figure 79: Western Europe Market Value Share and BPS Analysis by Installation, 2025 and 2035
  • Figure 80: Western Europe Market Y-o-Y Growth Comparison by Installation, 2025-2035
  • Figure 81: Western Europe Market Attractiveness Analysis by Installation
  • Figure 82: Western Europe Market Value Share and BPS Analysis by Mode of Operation, 2025 and 2035
  • Figure 83: Western Europe Market Y-o-Y Growth Comparison by Mode of Operation, 2025-2035
  • Figure 84: Western Europe Market Attractiveness Analysis by Mode of Operation
  • Figure 85: Western Europe Market Value Share and BPS Analysis by Application, 2025 and 2035
  • Figure 86: Western Europe Market Y-o-Y Growth Comparison by Application, 2025-2035
  • Figure 87: Western Europe Market Attractiveness Analysis by Application
  • Figure 88: Eastern Europe Market Value Share and BPS Analysis by Country, 2025 and 2035
  • Figure 89: Eastern Europe Market Value Share and BPS Analysis by Product Type, 2025 and 2035
  • Figure 90: Eastern Europe Market Y-o-Y Growth Comparison by Product Type, 2025-2035
  • Figure 91: Eastern Europe Market Attractiveness Analysis by Product Type
  • Figure 92: Eastern Europe Market Value Share and BPS Analysis by Function, 2025 and 2035
  • Figure 93: Eastern Europe Market Y-o-Y Growth Comparison by Function, 2025-2035
  • Figure 94: Eastern Europe Market Attractiveness Analysis by Function
  • Figure 95: Eastern Europe Market Value Share and BPS Analysis by Connectivity, 2025 and 2035
  • Figure 96: Eastern Europe Market Y-o-Y Growth Comparison by Connectivity, 2025-2035
  • Figure 97: Eastern Europe Market Attractiveness Analysis by Connectivity
  • Figure 98: Eastern Europe Market Value Share and BPS Analysis by Installation, 2025 and 2035
  • Figure 99: Eastern Europe Market Y-o-Y Growth Comparison by Installation, 2025-2035
  • Figure 100: Eastern Europe Market Attractiveness Analysis by Installation
  • Figure 101: Eastern Europe Market Value Share and BPS Analysis by Mode of Operation, 2025 and 2035
  • Figure 102: Eastern Europe Market Y-o-Y Growth Comparison by Mode of Operation, 2025-2035
  • Figure 103: Eastern Europe Market Attractiveness Analysis by Mode of Operation
  • Figure 104: Eastern Europe Market Value Share and BPS Analysis by Application, 2025 and 2035
  • Figure 105: Eastern Europe Market Y-o-Y Growth Comparison by Application, 2025-2035
  • Figure 106: Eastern Europe Market Attractiveness Analysis by Application
  • Figure 107: East Asia Market Value Share and BPS Analysis by Country, 2025 and 2035
  • Figure 108: East Asia Market Value Share and BPS Analysis by Product Type, 2025 and 2035
  • Figure 109: East Asia Market Y-o-Y Growth Comparison by Product Type, 2025-2035
  • Figure 110: East Asia Market Attractiveness Analysis by Product Type
  • Figure 111: East Asia Market Value Share and BPS Analysis by Function, 2025 and 2035
  • Figure 112: East Asia Market Y-o-Y Growth Comparison by Function, 2025-2035
  • Figure 113: East Asia Market Attractiveness Analysis by Function
  • Figure 114: East Asia Market Value Share and BPS Analysis by Connectivity, 2025 and 2035
  • Figure 115: East Asia Market Y-o-Y Growth Comparison by Connectivity, 2025-2035
  • Figure 116: East Asia Market Attractiveness Analysis by Connectivity
  • Figure 117: East Asia Market Value Share and BPS Analysis by Installation, 2025 and 2035
  • Figure 118: East Asia Market Y-o-Y Growth Comparison by Installation, 2025-2035
  • Figure 119: East Asia Market Attractiveness Analysis by Installation
  • Figure 120: East Asia Market Value Share and BPS Analysis by Mode of Operation, 2025 and 2035
  • Figure 121: East Asia Market Y-o-Y Growth Comparison by Mode of Operation, 2025-2035
  • Figure 122: East Asia Market Attractiveness Analysis by Mode of Operation
  • Figure 123: East Asia Market Value Share and BPS Analysis by Application, 2025 and 2035
  • Figure 124: East Asia Market Y-o-Y Growth Comparison by Application, 2025-2035
  • Figure 125: East Asia Market Attractiveness Analysis by Application
  • Figure 126: South Asia and Pacific Market Value Share and BPS Analysis by Country, 2025 and 2035
  • Figure 127: South Asia and Pacific Market Value Share and BPS Analysis by Product Type, 2025 and 2035
  • Figure 128: South Asia and Pacific Market Y-o-Y Growth Comparison by Product Type, 2025-2035
  • Figure 129: South Asia and Pacific Market Attractiveness Analysis by Product Type
  • Figure 130: South Asia and Pacific Market Value Share and BPS Analysis by Function, 2025 and 2035
  • Figure 131: South Asia and Pacific Market Y-o-Y Growth Comparison by Function, 2025-2035
  • Figure 132: South Asia and Pacific Market Attractiveness Analysis by Function
  • Figure 133: South Asia and Pacific Market Value Share and BPS Analysis by Connectivity, 2025 and 2035
  • Figure 134: South Asia and Pacific Market Y-o-Y Growth Comparison by Connectivity, 2025-2035
  • Figure 135: South Asia and Pacific Market Attractiveness Analysis by Connectivity
  • Figure 136: South Asia and Pacific Market Value Share and BPS Analysis by Installation, 2025 and 2035
  • Figure 137: South Asia and Pacific Market Y-o-Y Growth Comparison by Installation, 2025-2035
  • Figure 138: South Asia and Pacific Market Attractiveness Analysis by Installation
  • Figure 139: South Asia and Pacific Market Value Share and BPS Analysis by Mode of Operation, 2025 and 2035
  • Figure 140: South Asia and Pacific Market Y-o-Y Growth Comparison by Mode of Operation, 2025-2035
  • Figure 141: South Asia and Pacific Market Attractiveness Analysis by Mode of Operation
  • Figure 142: South Asia and Pacific Market Value Share and BPS Analysis by Application, 2025 and 2035
  • Figure 143: South Asia and Pacific Market Y-o-Y Growth Comparison by Application, 2025-2035
  • Figure 144: South Asia and Pacific Market Attractiveness Analysis by Application
  • Figure 145: Middle East & Africa Market Value Share and BPS Analysis by Country, 2025 and 2035
  • Figure 146: Middle East & Africa Market Value Share and BPS Analysis by Product Type, 2025 and 2035
  • Figure 147: Middle East & Africa Market Y-o-Y Growth Comparison by Product Type, 2025-2035
  • Figure 148: Middle East & Africa Market Attractiveness Analysis by Product Type
  • Figure 149: Middle East & Africa Market Value Share and BPS Analysis by Function, 2025 and 2035
  • Figure 150: Middle East & Africa Market Y-o-Y Growth Comparison by Function, 2025-2035
  • Figure 151: Middle East & Africa Market Attractiveness Analysis by Function
  • Figure 152: Middle East & Africa Market Value Share and BPS Analysis by Connectivity, 2025 and 2035
  • Figure 153: Middle East & Africa Market Y-o-Y Growth Comparison by Connectivity, 2025-2035
  • Figure 154: Middle East & Africa Market Attractiveness Analysis by Connectivity
  • Figure 155: Middle East & Africa Market Value Share and BPS Analysis by Installation, 2025 and 2035
  • Figure 156: Middle East & Africa Market Y-o-Y Growth Comparison by Installation, 2025-2035
  • Figure 157: Middle East & Africa Market Attractiveness Analysis by Installation
  • Figure 158: Middle East & Africa Market Value Share and BPS Analysis by Mode of Operation, 2025 and 2035
  • Figure 159: Middle East & Africa Market Y-o-Y Growth Comparison by Mode of Operation, 2025-2035
  • Figure 160: Middle East & Africa Market Attractiveness Analysis by Mode of Operation
  • Figure 161: Middle East & Africa Market Value Share and BPS Analysis by Application, 2025 and 2035
  • Figure 162: Middle East & Africa Market Y-o-Y Growth Comparison by Application, 2025-2035
  • Figure 163: Middle East & Africa Market Attractiveness Analysis by Application
  • Figure 164: Global Market - Tier Structure Analysis
  • Figure 165: Global Market - Company Share Analysis

Frequently Asked Questions

What are the key product types in the time switch market?

The market is broadly segmented into Digital and Analog time switches, with digital models favored for smart automation and programmability.

Which function type leads the market?

Astronomical time switches hold the largest share (~34%) due to their ability to automate based on sunrise and sunset, while cycle and countdown timers serve repetitive and event-based needs.

How is connectivity evolving in time switches?

Connectivity options include Standalone and IoT-enabled switches. IoT-enabled devices allow remote monitoring, smart scheduling, and integration into building automation systems.

What installation types are available?

Common installation types are DIN Rail, Panel Mount, Plug-in, and Wall Mount, selected based on industrial, commercial, or residential applications.

What are the modes of operation?

Time switches operate either Manually or Automatically, with automated solutions providing higher energy efficiency and operational convenience.

Which applications are driving demand?

Leading applications include Lighting Control, HVAC Systems, Water Pumps, Industrial Motors, Security Systems, Appliance Controls, and Open/Close Systems, reflecting growing automation across residential, commercial, and industrial sectors.

Explore Similar Insights

Future Market Insights

Time Switch Market