Time Temperature Indicator Labels Market
Find Out with FMI How the Global Food, Pharmaceutical, and Medical Sectors are Driving Sales of Time Temperature Indicator Labels in the United States, the United Kingdom, Japan, Korea, & 30+ Countries!
Time Temperature Indicator Labels Market by Label Information, Product Type, End-use Industry, Technology & Region | Forecast 2023 to 2033
Time Temperature Indicator Labels Market Outlook (2023 to 2033)
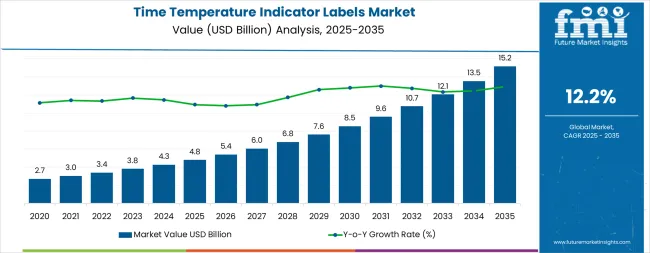
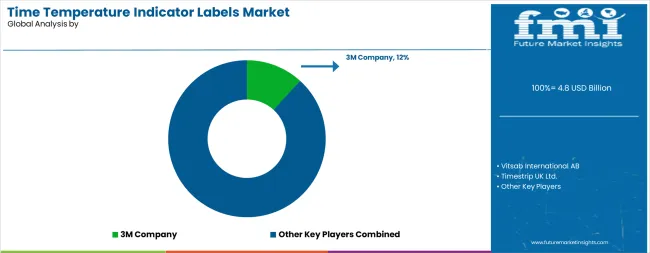
The global time temperature indicator labels market is expected to account for US$ 917.6 million in 2023. It is slated to further expand at a positive CAGR of 6.5% from 2023 to 2033, which would increase its valuation to US$ 1,715.6 million in 2033. Right now, the top 5 companies are estimated to hold around 25 to 30% of the global market.
The time temperature indicator labels are expected to hold around 2 to 3% of the global labels market in 2023. According to Future Market Insights (FMI) analysis, the valuation of the market for time temperature indicator labels was around US$ 862.7 million in 2022. Skyrocketing demand for time temperature indicator labels from the global pharmaceutical sector is poised to drive market acceleration in the coming years. The anticipated expansion of the global market between 2023 and 2033 is projected to create an absolute incremental growth opportunity of US$ 779.8 million.
Time temperature indicator (TTI) labels are used to determine products’ accumulated time-temperature histories. They are predominantly utilized across the medical, pharmaceutical, and food sectors for indicating products’ exposures to excessive temperatures along with the times during which they were exposed.
Buyers of time temperature indicator labels can pick from a variety of products featuring different technologies. For instance, certain time temperature indicator labels work on the basis of dye migration through filter papers. Certain other labels feature pouches containing bacterial fluids, which change color based on pre-specified combinations of time and temperature. Digital temperature data loggers are available as well, and these devices are used for calculating the probability of spoilage and shelf life loss.
For food, pharmaceutical, and medical products dependent on controlled temperature environment, use of time temperature indicator labels is imperative. Their use can significantly reduce food waste and ensure food products’ cool chain, i.e., the series of equipment and action applied for maintaining specified low-temperature range for products from production/harvest to consumption.
However, despite the promise of a bright future, the global time temperature indicator labels market is set to be restrained by certain factors. For instance, the use of time temperature indicator labels is regulated for particular medical products by the World Health Organization (WHO). In the United States, the use of time temperature indicator labels is regulated by the Food and Drug Administration (FDA) on the country’s seafood products.
Attribute |
Key Insights |
Estimated Time Temperature Indicator Labels Market Value (2023) |
~US$ 917.6 million |
Projected Market Value (2033) |
~US$ 1,715.6 million |
Value-based CAGR (2023 to 2033) |
~6.5% |
Top Players Share in 2023 |
~25 to 30% |
Let us know your requirement to get
100% FREE customization
2015 to 2022 Time Temperature Indicator Labels Market Outlook Compared to Demand Forecast for 2023 to 2033
The global time temperature indicator labels market witnessed a steady CAGR of 5.8% from 2015 to 2022. This increased the market value from US$ 592.9 million in 2015 to US$ 862.7 million in 2022.
Time temperature indicator adhesive labels are among the smart gadgets capable of gathering recent data on both time and temperature. Food products spoil before their expiration dates as a result of enzymatic, microbiological, chemical, and physical reactions. The primary purpose of time temperature indicators, as their name suggests, is to diagnose product degradation and notify users via alerts. The availability of real-time information could help to reduce health risks among consumers.
Time temperature indicator labels are used in various industries such as food, beverages, pharmaceutical, healthcare and retail. There is a high demand for irreversible color-based time temperature indicator labels for their accuracy and ease of application.
Comparative Analysis of Time Temperature Indicator Labels Markets
Time Temperature Indicator Labels Market:
Differentiating Aspects |
Time Temperature Indicator Labels Market |
CAGR in 2023 to 2033 |
6.5% |
Current Valuation in 2023 |
US$ 917.6 million |
Projected Valuation in 2033 |
US$ 1,715.6 million |
Demand Drivers |
|
Labels Market:
Differentiating Aspects |
Labels Market |
CAGR in 2023 to 2033 |
4.8% |
Current Valuation in 2023 |
US$ 39.8 billion |
Projected Valuation in 2033 |
US$ 63.7 billion |
Demand Drivers |
|
Blood Temperature Indicator Market:
Differentiating Aspects |
Blood Temperature Indicator Market |
CAGR in 2023 to 2033 |
12% |
Current Valuation in 2023 |
US$ 235 million |
Projected Valuation in 2033 |
US$ 600 million |
Demand Drivers |
|
Find your sweet spots for generating winning opportunities in this market.
Talk to AnalystHow are Technological Advancements Impacting the Time Temperature Indicator Labels Demand?
Technological Advancements for Improving Safety and Temperature Monitoring to Boost Market Demand
On the back of technological advancements, active packaging has started to gain more traction compared to passive packaging. The prominent players are offering shippers equipped with temperature and time loggers’ labels, which immediately detect if any container has been opened during transportation. Thermochromic labels are also becoming increasingly popular. These labels change their colors to provide visual verification that shippers are ready to pack.
For instance, Pelican’s reusable shipper and Sofrigam’s Elite cooling box come equipped with these sensors. It is also becoming more popular and affordable to use data loggers with temperature sensors and USB connectivity. These loggers, which resemble labels, are easy to attach to packaging. They can continuously monitor temperature conditions and offer a comprehensive summary of time and temperature data.
Country-wise insights
How is the United States Pharmaceutical Industry Bolstering the Time Temperature Indicator Labels Sales?
New Heat Resistant Drugs and Medicines to Drive Demand for Time Temperature Indicator Labels in the United States
The United States is estimated to hold around 1/4th of the global market for time temperature indicator labels owing to the presence of prominent companies such as 3M and CCL Industries. These companies are striving to expand their business through acquisitions and consolidation and successfully integrating their acquired businesses.
Apart from these trends, players in the United States market are expected to increase their market share through product innovations, effective branding, and following customer trends to make their offerings attractive. The growing innovation and development of new medicines and heat resistant drugs are expected to boost the sales of time temperature indicator labels.
According to the United States Food & Drug Administration (FDA), a new drug has been added to FDA’s Center for Drug Evaluation and Research (CDER). The CDER explains to drug manufacturers the necessary aspects of research design and other information required in the drug application to support a thorough and in-depth evaluation.
How will Expansion of Food & Beverages Industry in Germany Affect the Time Temperature Indicator Labels Sales?
Lucrative Opportunities in Germany Food & Beverage Industry to Surge Time Temperature Indicator Label Sales
The expansion of Germany market for time temperature indicator labels is set to be impacted by the country’s accelerating food & beverage industry. The economies of scale, which can be established if the production and other operations achieve efficiency, are another significant factor poised to contribute to market expansion.
With the growing alternative of online delivery, there is a huge impact on the distribution network of food service. For instance, Austrian drink Giant Red Bull and fruit juice manufacturer Rauch have shifted their manufacturing plants to Germany to enhance their capabilities in the German market.
The total sales across all subsectors in 2021 amounted to US$ 201.3 billion, down 1.6 percent from the previous year, according to the USA Department of Agriculture. This decline was slightly reduced by a little increase in prices and increasing exports, and most German food service companies anticipate higher sales of food and beverage items in the coming years. According to FMI, Germany is likely to have an 11.8% share in the global market for time temperature indicator labels in 2033.
Which Countries in Asia Pacific will Emerge as Remunerative Markets for Time Temperature Indicator Labels?
India, China, and Japan to Lead the Way in Asia Pacific Market for Time Temperature Indicator Labels
In Asia Pacific, China, India, and Japan are expected to be the most lucrative markets for devices such as time temperature indicator labels and data logger market labels from 2023 to 2033. China is estimated to hold a 6.8% share in the global market in 2023, while India and Japan’s shares are anticipated to reach 5.9% and 18.4% respectively.
Across Japan and India, the respective countries’ food & beverage, pharmaceutical, and medical sectors are expected to expand significantly between 2023 and 2033. This is poised to increase India’s global market share to 6.1% in 2033, while Japan’s global market share is estimated to rise to 20.8% in 2033. China market’s share in the global market is poised to decrease to 5.9% owing to the likelihood of emergence of market restraints.

A unified Market Research Subscription Platform, built for today's disparate research needs.
Category-wise Insights
Which Technology will be the Most Preferred for Time Temperature Indicator Labels?
Enzymatic Technology to Gain Preference for Its Advantages over Other Technologies
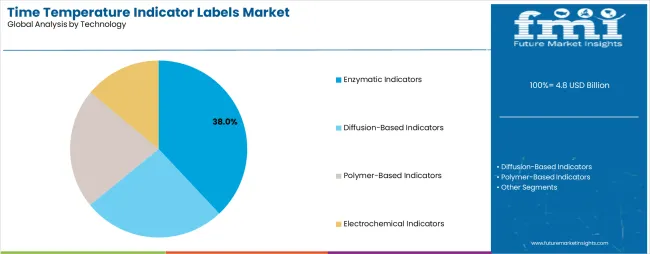
The enzymatic technology is the most preferred technology among buyers of time temperature indicator labels. It is estimated to generate sales of US$ 631 million between 2023 and 2033 due to the increasing adoption of various intelligent packaging solutions for food systems with specific kinetic energies and activation minimizing the risk of thermal abuse.
This technology is also used in the pharmaceutical industry to provide label packaging for particular medicines that are reactive to sunlight and heat. Enzymatic technology is anticipated to generate an absolute incremental growth opportunity of US$ 323.4 million from 2023 to 2033 at a positive CAGR of 6.8%.
Which is the Leading End Use Industry for Time Temperature Indicator Labels?
Pharmaceutical Industry to Generate Maximum Demand for Time Temperature Indicator Labels
The pharmaceutical industry holds the largest market value share of 63.9% for worldwide market for time temperature indicator labels owing to the growing use of time temperature indicator labels for storage of pharmaceutical products. Pharmaceutical products need attention and care when it comes to storing them. They also need to be kept away from sunlight.
Time temperature indicator labels can maintain the temperature of pharmaceutical products as per their specific requirements throughout transportation and storage. The pharmaceutical industry is projected to create an absolute incremental opportunity of US$ 539.4 million for market for time temperature indicator labels from 2023 to 2033.
Competitive Landscape
The key players in the time temperature indicator labels market are aiming to boost their sales and revenues by expanding their production capacities to satisfy growing demands. Prominent players are attempting to implement merger and acquisition strategies to increase their resources, and they are also creating new products with convenient features.
For instance:
- In October 2022, DeltaTrak, a leading developer of supply chain management and cold chain solutions, announced a partnership with London-based technology startup Optimiz. This partnership is aimed at ensuring safe product transportation and seamless customer experiences.
- In July 2022, Timestrip launched a new time temperature indicator label that is capable of highly versatile operations at low costs.
Scope of Report
Attribute |
Details |
Estimated Market Size (2023) |
US$ 917.6 million |
Projected Market Size (2033) |
US$ 1,715.6 million |
Anticipated Growth Rate (2023 to 2033) |
6.5% |
Forecast Period |
2023 to 2033 |
Historical Data Available for |
2015 to 2022 |
Market Analysis |
US$ million for Value |
Key Regions Covered |
North America, Latin America, East Asia, South Asia & Pacific, Western Europe, Eastern Europe, Central Asia, Russia & Belarus, Balkan Countries , Baltic Countries, & Middle East and Africa |
Key Countries Covered |
The United States, Canada, Brazil, Mexico, Argentina, Korea, China, Japan, India, ASEAN, Australia & New Zealand, Germany, France, Spain, Italy, BENELUX, Nordics, the United Kingdom, Poland, Hungary, Romania, Czech Republic, GCC Countries, Türkiye, Northern Africa, South Africa, Israel, & Saudi Arabia |
Key Segments Covered |
Product Type, Label Information, Technology, End-use, & Region |
Key Companies Profiled |
|
Report Coverage |
Market Forecast, Company Share Analysis, Competition Intelligence, Drivers, Restraints, Opportunities, and Threats Analysis, Market Dynamics and Challenges, and Strategic Growth Initiatives |
Time Temperature Indicator Labels Industry by Category
By Product Type:
- Color (Only) Based
- Irreversible
- Reversible
- Barcode Based
By Label Information:
- Critical Temperature Indicators (CTI)
- Time Temperature Indicators (TTI)
- Critical Time Temperature Indicators (CTTI)
By Technology:
- Microbiological
- Diffusion
- Polymer-based
- Photochemical
- Enzymatic
By End-use Industry:
- Pharmaceutical
- Food & Beverage
- Chemical & Fertilizers
By Region:
- North America
- Latin America
- East Asia
- South Asia & Pacific
- Western Europe
- Eastern Europe
- Central Asia
- Russia & Belarus
- Balkan Countries
- Baltic Countries
- Middle East and Africa
Frequently Asked Questions
What was the size of the global market for time temperature indicator labels reported by FMI in 2022?
In 2022, the value of the global market for time temperature indicator labels was US$ 862.7 million.
What value is the global market for time temperature indicator labels estimated to reach in 2023?
The global market for time temperature indicator labels is expected to reach a value of US$ 917.6 million in 2023.
What is the expected valuation for the global market for time temperature indicator labels in 2033?
The market for global time temperature indicator labels is expected to reach a valuation of US$ 1,715.6 million in 2033.
What value CAGR did the market for time temperature indicator labels exhibit over the last 4 years?
The global market for time temperature indicator labels witnessed a steady CAGR of 5% from 2019 to 2023.
What is the projected CAGR for the market for time temperature indicator labels from 2023 to 2033?
Between 2023 and 2033, the market for time temperature indicator labels is anticipated to expand at a healthy CAGR of 6.5%.
Which label information type will garner significant value share in 2023?
The CTTI label information is estimated to hold a share of 83% in the global market in 2023.
Which product type is predicted to expand rapidly between 2023 and 2033?
The reversible color based segment is projected to expand 2.1 times between 2023 and 2033.
Table of Content
1. Executive Summary | Time Temperature Indicator Labels Market 1.1. Global Market Outlook 1.2. Demand–side Trends 1.3. Supply–side Trends 1.4. Technology Roadmap Analysis 1.5. Analysis and Recommendations 2. Market Overview 2.1. Market Coverage / Taxonomy 2.2. Market Definition / Scope / Limitations 3. Market Background 3.1. Market Dynamics 3.1.1. Drivers 3.1.2. Restraints 3.1.3. Opportunity 3.1.4. Trends 3.2. Cased-based Scenario 3.2.1. Demand in Optimistic Scenario 3.2.2. Demand in Likely Scenario 3.2.3. Demand in Conservative Scenario 3.3. Macro Factors and Forecast Factors 3.4. Value Chain Analysis 3.4.1. Profit Margin Analysis 3.4.2. Raw Label Information Suppliers 3.4.3. Manufacturers, Wholesalers and Distributors 3.4.4. End–user/ Customers 3.5. Regional Parent Market Outlook 3.6. Production and Consumption Statistics 3.7. Global Average Pricing Analysis Benchmark 4. Global Market Analysis 2015 to 2022 and Forecast 2023 to 2033 4.1. Historical Market Size Value (US$ million) & Volume (Units) Analysis, 2015 to 2022 4.2. Current and Future Market Size Value (US$ million) & Volume (Units) Projections, 2023 to 2033 4.2.1. Y–o–Y Growth Trend Analysis 4.2.2. Absolute $ Opportunity Analysis 5. Global Market Analysis 2015 to 2022 and Forecast 2023 to 2033, by Product Type 5.1. Introduction / Key Findings 5.2. Historical Market Size Value (US$ million) & Volume (Units) Analysis by Product Type, 2015 to 2022 5.3. Current and Future Market Size Value (US$ million) & Volume (Units) Analysis and Forecast by Product Type, 2023 to 2033 5.3.1. Color (Only) Based 5.3.1.1. Irreversible 5.3.1.2. Reversible 5.3.2. Barcode Based 5.4. Y–o–Y Growth Trend Analysis by Product Type, 2015 to 2022 5.5. Absolute $ Opportunity Analysis by Product Type, 2023 to 2033 6. Global Market Analysis 2015 to 2022 and Forecast 2023 to 2033, by Label Information 6.1. Introduction / Key Findings 6.2. Historical Market Size Value (US$ million) & Volume (Units) Analysis by Label Information, 2015 to 2022 6.3. Current and Future Market Size Value (US$ million) & Volume (Units) Analysis and Forecast by Label Information, 2023 to 2033 6.3.1. Critical Temperature Indicators (CTI) 6.3.2. Critical Time Temperature Indicators (CTTI) 6.3.3. Time Temperature Indicators (TTI) 6.4. Y–o–Y Growth Trend Analysis by Label Information, 2015 to 2022 6.5. Absolute $ Opportunity Analysis by Label Information, 2023 to 2033 7. Global Market Analysis 2015 to 2022 and Forecast 2023 to 2033, by Technology 7.1. Introduction / Key Findings 7.2. Historical Market Size Value (US$ million) & Volume (Units) Analysis by Technology, 2015 to 2022 7.3. Current and Future Market Size Value (US$ million) & Volume (Units) Analysis and Forecast by Technology, 2023 to 2033 7.3.1. Microbiological 7.3.2. Diffusion 7.3.3. Polymer-based 7.3.4. Photochemical 7.3.5. Enzymatic 7.4. Y–o–Y Growth Trend Analysis by Technology, 2015 to 2022 7.5. Absolute $ Opportunity Analysis by Technology, 2023 to 2033 8. Global Market Analysis 2015 to 2022 and Forecast 2023 to 2033, by End Use Industry 8.1. Introduction / Key Findings 8.2. Historical Market Size Value (US$ million) & Volume (Units) Analysis by Technology, 2015 to 2022 8.3. Current and Future Market Size Value (US$ million) & Volume (Units) Analysis and Forecast by Technology, 2023 to 2033 8.3.1. Pharmaceutical 8.3.2. Food & Beverage 8.3.3. Chemical & Fertilizers 8.4. Y–o–Y Growth Trend Analysis by Technology, 2015 to 2022 8.5. Absolute $ Opportunity Analysis by Technology, 2023 to 2033 9. Global Market Analysis 2015 to 2022 and Forecast 2023 to 2033, by Region 9.1. Introduction / Key Findings 9.2. Historical Market Size Value (US$ million) & Volume (Units) Analysis by Region, 2015 to 2022 9.3. Current and Future Market Size Value (US$ million) & Volume (Units) Analysis and Forecast by Region, 2023 to 2033 9.3.1. North America 9.3.2. Latin America 9.3.3. East Asia 9.3.4. South Asia & Pacific 9.3.5. Western Europe 9.3.6. Eastern Europe 9.3.7. Central Asia 9.3.8. Russia & Belarus 9.3.9. Balkan Countries 9.3.10. Baltic Countries 9.3.11. Middle East and Africa 9.4. Market Attractiveness Analysis, by Region 10. North America Market Analysis 2015 to 2022 and Forecast 2023 to 2033, by Country 10.1. Historical Market Size Value (US$ million) & Volume (Units) Trend Analysis by Market Taxonomy, 2015 to 2022 10.2. Market Size Value (US$ million) & Volume (Units) Forecast by Market Taxonomy, 2023 to 2033 10.2.1. by Country 10.2.1.1. The United States 10.2.1.2. Canada 10.2.2. by Product Type 10.2.3. by Label Information 10.2.4. by Technology 10.2.5. by End Use Industry 10.3. Market Attractiveness Analysis 10.3.1. by Country 10.3.2. by Product Type 10.3.3. by Label Information 10.3.4. by Technology 10.3.5. by End Use Industry 10.4. Key Takeaways 11. Latin America Market Analysis 2015 to 2022 and Forecast 2023 to 2033, by Country 11.1. Historical Market Size Value (US$ million) & Volume (Units) Trend Analysis by Market Taxonomy, 2015 to 2022 11.2. Market Size Value (US$ million) & Volume (Units) Forecast by Market Taxonomy, 2023 to 2033 11.2.1. by Country 11.2.1.1. Brazil 11.2.1.2. Mexico 11.2.1.3. Argentina 11.2.1.4. Rest of Latin America 11.2.2. by Product Type 11.2.3. by Label Information 11.2.4. by Technology 11.2.5. by End Use Industry 11.3. Market Attractiveness Analysis 11.3.1. by Country 11.3.2. by Product Type 11.3.3. by Label Information 11.3.4. by Technology 11.3.5. by End Use Industry 11.4. Key Takeaways 12. East Asia Market Analysis 2015 to 2022 and Forecast 2023 to 2033, by Country 12.1. Historical Market Size Value (US$ million) & Volume (Units) Trend Analysis by Market Taxonomy, 2015 to 2022 12.2. Market Size Value (US$ million) & Volume (Units) Forecast by Market Taxonomy, 2023 to 2033 12.2.1. by Country 12.2.1.1. China 12.2.1.2. Japan 12.2.1.3. Korea 12.2.2. by Product Type 12.2.3. by Label Information 12.2.4. by Technology 12.2.5. by End Use Industry 12.3. Market Attractiveness Analysis 12.3.1. by Country 12.3.2. by Product Type 12.3.3. by Label Information 12.3.4. by Technology 12.3.5. by End Use Industry 12.4. Key Takeaways 13. South Asia & Pacific Market Analysis 2015 to 2022 and Forecast 2023 to 2033, by Country 13.1. Historical Market Size Value (US$ million) & Volume (Units) Trend Analysis by Market Taxonomy, 2015 to 2022 13.2. Market Size Value (US$ million) & Volume (Units) Forecast by Market Taxonomy, 2023 to 2033 13.2.1. by Country 13.2.1.1. India 13.2.1.2. ASEAN 13.2.1.3. Australia & New Zealand 13.2.2. by Product Type 13.2.3. by Label Information 13.2.4. by Technology 13.2.5. by End Use Industry 13.3. Market Attractiveness Analysis 13.3.1. by Country 13.3.2. by Product Type 13.3.3. by Label Information 13.3.4. by Technology 13.3.5. by End Use Industry 13.4. Key Takeaways 14. Western Europe Market Analysis 2015 to 2022 and Forecast 2023 to 2033, by Country 14.1. Historical Market Size Value (US$ million) & Volume (Units) Trend Analysis by Market Taxonomy, 2015 to 2022 14.2. Market Size Value (US$ million) & Volume (Units) Forecast by Market Taxonomy, 2023 to 2033 14.2.1. by Country 14.2.1.1. Germany 14.2.1.2. Italy 14.2.1.3. France 14.2.1.4. The United Kingdom 14.2.1.5. Spain 14.2.1.6. BENELUX 14.2.1.7. Nordic 14.2.1.8. Rest of Europe 14.2.2. by Product Type 14.2.3. by Label Information 14.2.4. by Technology 14.2.5. by End Use Industry 14.3. Market Attractiveness Analysis 14.3.1. by Country 14.3.2. by Product Type 14.3.3. by Label Information 14.3.4. by Technology 14.3.5. by End Use Industry 14.4. Key Takeaways 15. Eastern Europe Market Analysis 2015 to 2022 and Forecast 2023 to 2033, by Country 15.1. Historical Market Size Value (US$ million) & Volume (Units) Trend Analysis by Market Taxonomy, 2015 to 2022 15.2. Market Size Value (US$ million) & Volume (Units) Forecast by Market Taxonomy, 2023 to 2033 15.2.1. by Country 15.2.1.1. Poland 15.2.1.2. Hungary 15.2.1.3. Romania 15.2.1.4. Czech Republic 15.2.1.5. Rest of Eastern Europe 15.2.2. by Product Type 15.2.3. by Label Information 15.2.4. by Technology 15.2.5. by End Use Industry 15.3. Market Attractiveness Analysis 15.3.1. by Country 15.3.2. by Product Type 15.3.3. by Label Information 15.3.4. by Technology 15.3.5. by End Use Industry 15.4. Key Takeaways 16. Central Asia Market Analysis 2015 to 2022 and Forecast 2023 to 2033, by Country 16.1. Historical Market Size Value (US$ million) & Volume (Units) Trend Analysis by Market Taxonomy, 2015 to 2022 16.2. Market Size Value (US$ million) & Volume (Units) Forecast by Market Taxonomy, 2023 to 2033 16.2.1. by Country 16.2.2. by Product Type 16.2.3. by Label Information 16.2.4. by Technology 16.2.5. by End Use Industry 16.3. Market Attractiveness Analysis 16.3.1. by Country 16.3.2. by Product Type 16.3.3. by Label Information 16.3.4. by Technology 16.3.5. by End Use Industry 16.4. Key Takeaways 17. Russia & Belarus Market Analysis 2015 to 2022 and Forecast 2023 to 2033, by Country 17.1. Historical Market Size Value (US$ million) & Volume (Units) Trend Analysis by Market Taxonomy, 2015 to 2022 17.2. Market Size Value (US$ million) & Volume (Units) Forecast by Market Taxonomy, 2023 to 2033 17.2.1. by Country 17.2.2. by Product Type 17.2.3. by Label Information 17.2.4. by Technology 17.2.5. by End Use Industry 17.3. Market Attractiveness Analysis 17.3.1. by Country 17.3.2. by Product Type 17.3.3. by Label Information 17.3.4. by Technology 17.3.5. by End Use Industry 17.4. Key Takeaways 18. Balkan Countries Market Analysis 2015 to 2022 and Forecast 2023 to 2033, by Country 18.1. Historical Market Size Value (US$ million) & Volume (Units) Trend Analysis by Market Taxonomy, 2015 to 2022 18.2. Market Size Value (US$ million) & Volume (Units) Forecast by Market Taxonomy, 2023 to 2033 18.2.1. by Country 18.2.2. by Product Type 18.2.3. by Label Information 18.2.4. by Technology 18.2.5. by End Use Industry 18.3. Market Attractiveness Analysis 18.3.1. by Country 18.3.2. by Product Type 18.3.3. by Label Information 18.3.4. by Technology 18.3.5. by End Use Industry 18.4. Key Takeaways 19. Baltic Countries Market Analysis 2015 to 2022 and Forecast 2023 to 2033, by Country 19.1. Historical Market Size Value (US$ million) & Volume (Units) Trend Analysis by Market Taxonomy, 2015 to 2022 19.2. Market Size Value (US$ million) & Volume (Units) Forecast by Market Taxonomy, 2023 to 2033 19.2.1. by Country 19.2.2. by Product Type 19.2.3. by Label Information 19.2.4. by Technology 19.2.5. by End Use Industry 19.3. Market Attractiveness Analysis 19.3.1. by Country 19.3.2. by Product Type 19.3.3. by Label Information 19.3.4. by Technology 19.3.5. by End Use Industry 19.4. Key Takeaways 20. Middle East and Africa Market Analysis 2015 to 2022 and Forecast 2023 to 2033, by Country 20.1. Historical Market Size Value (US$ million) & Volume (Units) Trend Analysis by Market Taxonomy, 2015 to 2022 20.2. Market Size Value (US$ million) & Volume (Units) Forecast by Market Taxonomy, 2023 to 2033 20.2.1. by Country 20.2.1.1. GCC Countries 20.2.1.2. Türkiye 20.2.1.3. Northern Africa 20.2.1.4. South Africa 20.2.1.5. Rest of Middle East and Africa 20.2.2. by Product Type 20.2.3. by Label Information 20.2.4. by Technology 20.2.5. by End Use Industry 20.3. Market Attractiveness Analysis 20.3.1. by Country 20.3.2. by Product Type 20.3.3. by Label Information 20.3.4. by Technology 20.3.5. by End Use Industry 20.4. Key Takeaways 21. Country wise Market Analysis 21.1. The United States 21.1.1. Market Share Analysis, 2023 21.1.2. by Product Type 21.1.3. by Label Information 21.1.4. by Technology 21.1.5. by End Use Industry 21.2. Canada 21.2.1. Market Share Analysis, 2023 21.2.2. by Product Type 21.2.3. by Label Information 21.2.4. by Technology 21.2.5. by End Use Industry 21.3. Brazil 21.3.1. Market Share Analysis, 2023 21.3.2. by Product Type 21.3.3. by Label Information 21.3.4. by Technology 21.3.5. by End Use Industry 21.4. Mexico 21.4.1. Market Share Analysis, 2023 21.4.2. by Product Type 21.4.3. by Label Information 21.4.4. by Technology 21.4.5. by End Use Industry 21.5. Germany 21.5.1. Market Share Analysis, 2023 21.5.2. by Product Type 21.5.3. by Label Information 21.5.4. by Technology 21.5.5. by End Use Industry 21.6. Italy 21.6.1. Market Share Analysis, 2023 21.6.2. by Product Type 21.6.3. by Label Information 21.6.4. by Technology 21.6.5. by End Use Industry 21.7. France 21.7.1. Market Share Analysis, 2023 21.7.2. by Product Type 21.7.3. by Label Information 21.7.4. by Technology 21.7.5. by End Use Industry 21.8. Spain 21.8.1. Market Share Analysis, 2023 21.8.2. by Product Type 21.8.3. by Label Information 21.8.4. by Technology 21.8.5. by End Use Industry 21.9. The United Kingdom 21.9.1. Market Share Analysis, 2023 21.9.2. by Product Type 21.9.3. by Label Information 21.9.4. by Technology 21.9.5. by End Use Industry 21.10. China 21.10.1. Market Share Analysis, 2023 21.10.2. by Product Type 21.10.3. by Label Information 21.10.4. by Technology 21.10.5. by End Use Industry 21.11. Japan 21.11.1. Market Share Analysis, 2023 21.11.2. by Product Type 21.11.3. by Label Information 21.11.4. by Technology 21.11.5. by End Use Industry 21.12. India 21.12.1. Market Share Analysis, 2023 21.12.2. by Product Type 21.12.3. by Label Information 21.12.4. by Technology 21.12.5. by End Use Industry 21.13. Australia & New Zealand 21.13.1. Market Share Analysis, 2023 21.13.2. by Product Type 21.13.3. by Label Information 21.13.4. by Technology 21.13.5. by End Use Industry 21.14. GCC Countries 21.14.1. Market Share Analysis, 2023 21.14.2. by Product Type 21.14.3. by Label Information 21.14.4. by Technology 21.14.5. by End Use Industry 21.15. South Africa 21.15.1. Market Share Analysis, 2023 21.15.2. by Product Type 21.15.3. by Label Information 21.15.4. by Technology 21.15.5. by End Use Industry 22. Market Structure Analysis 22.1. Competition Dashboard 22.2. Competition Benchmarking 22.3. Market Share Analysis of Top Players 22.3.1. by Region 22.3.2. by Product Portfolio 23. Competition Analysis 23.1. Competition Deep Dive 23.1.1. 3M Company 23.1.1.1. Overview 23.1.1.2. Product Portfolio 23.1.1.3. Profitability by Market Segments (Product/Channel/Region) 23.1.1.4. Sales Footprint 23.1.1.5. Strategy Overview 23.1.1.5.1. Marketing Strategy 23.1.1.5.2. Product Strategy 23.1.1.5.3. Channel Strategy 23.1.2. CCL Industries Inc. 23.1.2.1. Overview 23.1.2.2. Product Portfolio 23.1.2.3. Profitability by Market Segments (Product/Channel/Region) 23.1.2.4. Sales Footprint 23.1.2.5. Strategy Overview 23.1.2.5.1. Marketing Strategy 23.1.2.5.2. Product Strategy 23.1.2.5.3. Channel Strategy 23.1.3. TIP Temperature Products 23.1.3.1. Overview 23.1.3.2. Product Portfolio 23.1.3.3. Profitability by Market Segments (Product/Channel/Region) 23.1.3.4. Sales Footprint 23.1.3.5. Strategy Overview 23.1.3.5.1. Marketing Strategy 23.1.3.5.2. Product Strategy 23.1.3.5.3. Channel Strategy 23.1.4. Delta Trak 23.1.4.1. Overview 23.1.4.2. Product Portfolio 23.1.4.3. Profitability by Market Segments (Product/Channel/Region) 23.1.4.4. Sales Footprint 23.1.4.5. Strategy Overview 23.1.4.5.1. Marketing Strategy 23.1.4.5.2. Product Strategy 23.1.4.5.3. Channel Strategy 23.1.5. Phase IV Engineering, Inc. 23.1.5.1. Overview 23.1.5.2. Product Portfolio 23.1.5.3. Profitability by Market Segments (Product/Channel/Region) 23.1.5.4. Sales Footprint 23.1.5.5. Strategy Overview 23.1.5.5.1. Marketing Strategy 23.1.5.5.2. Product Strategy 23.1.5.5.3. Channel Strategy 23.1.6. Biosynergy, Inc. 23.1.6.1. Overview 23.1.6.2. Product Portfolio 23.1.6.3. Profitability by Market Segments (Product/Channel/Region) 23.1.6.4. Sales Footprint 23.1.6.5. Strategy Overview 23.1.6.5.1. Marketing Strategy 23.1.6.5.2. Product Strategy 23.1.6.5.3. Channel Strategy 23.1.7. Evigence Sensors 23.1.7.1. Overview 23.1.7.2. Product Portfolio 23.1.7.3. Profitability by Market Segments (Product/Channel/Region) 23.1.7.4. Sales Footprint 23.1.7.5. Strategy Overview 23.1.7.5.1. Marketing Strategy 23.1.7.5.2. Product Strategy 23.1.7.5.3. Channel Strategy 23.1.8. Insignia Technologies Ltd. 23.1.8.1. Overview 23.1.8.2. Product Portfolio 23.1.8.3. Profitability by Market Segments (Product/Channel/Region) 23.1.8.4. Sales Footprint 23.1.8.5. Strategy Overview 23.1.8.5.1. Marketing Strategy 23.1.8.5.2. Product Strategy 23.1.8.5.3. Channel Strategy 23.1.9. Liberty Marking Systems 23.1.9.1. Overview 23.1.9.2. Product Portfolio 23.1.9.3. Profitability by Market Segments (Product/Channel/Region) 23.1.9.4. Sales Footprint 23.1.9.5. Strategy Overview 23.1.9.5.1. Marketing Strategy 23.1.9.5.2. Product Strategy 23.1.9.5.3. Channel Strategy 23.1.10. Timestrip UK LTD 23.1.10.1. Overview 23.1.10.2. Product Portfolio 23.1.10.3. Profitability by Market Segments (Product/Channel/Region) 23.1.10.4. Sales Footprint 23.1.10.5. Strategy Overview 23.1.10.5.1. Marketing Strategy 23.1.10.5.2. Product Strategy 23.1.10.5.3. Channel Strategy 23.1.11. Testo SE & Co. KGaA 23.1.11.1. Overview 23.1.11.2. Product Portfolio 23.1.11.3. Profitability by Market Segments (Product/Channel/Region) 23.1.11.4. Sales Footprint 23.1.11.5. Strategy Overview 23.1.11.5.1. Marketing Strategy 23.1.11.5.2. Product Strategy 23.1.11.5.3. Channel Strategy 23.1.12. American thermal instruments 23.1.12.1. Overview 23.1.12.2. Product Portfolio 23.1.12.3. Profitability by Market Segments (Product/Channel/Region) 23.1.12.4. Sales Footprint 23.1.12.5. Strategy Overview 23.1.12.5.1. Marketing Strategy 23.1.12.5.2. Product Strategy 23.1.12.5.3. Channel Strategy 23.1.13. Vanprob Solutions 23.1.13.1. Overview 23.1.13.2. Product Portfolio 23.1.13.3. Profitability by Market Segments (Product/Channel/Region) 23.1.13.4. Sales Footprint 23.1.13.5. Strategy Overview 23.1.13.5.1. Marketing Strategy 23.1.13.5.2. Product Strategy 23.1.13.5.3. Channel Strategy 23.1.14. SRV Controls 23.1.14.1. Overview 23.1.14.2. Product Portfolio 23.1.14.3. Profitability by Market Segments (Product/Channel/Region) 23.1.14.4. Sales Footprint 23.1.14.5. Strategy Overview 23.1.14.5.1. Marketing Strategy 23.1.14.5.2. Product Strategy 23.1.14.5.3. Channel Strategy 23.1.15. R.R. Donnelley & Sons Company 23.1.15.1. Overview 23.1.15.2. Product Portfolio 23.1.15.3. Profitability by Market Segments (Product/Channel/Region) 23.1.15.4. Sales Footprint 23.1.15.5. Strategy Overview 23.1.15.5.1. Marketing Strategy 23.1.15.5.2. Product Strategy 23.1.15.5.3. Channel Strategy 23.1.16. Temperature Indicators Ltd 23.1.16.1. Overview 23.1.16.2. Product Portfolio 23.1.16.3. Profitability by Market Segments (Product/Channel/Region) 23.1.16.4. Sales Footprint 23.1.16.5. Strategy Overview 23.1.16.5.1. Marketing Strategy 23.1.16.5.2. Product Strategy 23.1.16.5.3. Channel Strategy 23.1.17. Omega Engineering, Inc. 23.1.17.1. Overview 23.1.17.2. Product Portfolio 23.1.17.3. Profitability by Market Segments (Product/Channel/Region) 23.1.17.4. Sales Footprint 23.1.17.5. Strategy Overview 23.1.17.5.1. Marketing Strategy 23.1.17.5.2. Product Strategy 23.1.17.5.3. Channel Strategy 23.1.18. Brady Corporation 23.1.18.1. Overview 23.1.18.2. Product Portfolio 23.1.18.3. Profitability by Market Segments (Product/Channel/Region) 23.1.18.4. Sales Footprint 23.1.18.5. Strategy Overview 23.1.18.5.1. Marketing Strategy 23.1.18.5.2. Product Strategy 23.1.18.5.3. Channel Strategy 23.1.19. Labelmaster 23.1.19.1. Overview 23.1.19.2. Product Portfolio 23.1.19.3. Profitability by Market Segments (Product/Channel/Region) 23.1.19.4. Sales Footprint 23.1.19.5. Strategy Overview 23.1.19.5.1. Marketing Strategy 23.1.19.5.2. Product Strategy 23.1.19.5.3. Channel Strategy 23.1.20. STREAM PEAK INTERNATIONAL. 23.1.20.1. Overview 23.1.20.2. Product Portfolio 23.1.20.3. Profitability by Market Segments (Product/Channel/Region) 23.1.20.4. Sales Footprint 23.1.20.5. Strategy Overview 23.1.20.5.1. Marketing Strategy 23.1.20.5.2. Product Strategy 23.1.20.5.3. Channel Strategy 23.1.21. Temperature Sensors 23.1.21.1. Overview 23.1.21.2. Product Portfolio 23.1.21.3. Profitability by Market Segments (Product/Channel/Region) 23.1.21.4. Sales Footprint 23.1.21.5. Strategy Overview 23.1.21.5.1. Marketing Strategy 23.1.21.5.2. Product Strategy 23.1.21.5.3. Channel Strategy 23.1.22. Thermometer Site. 23.1.22.1. Overview 23.1.22.2. Product Portfolio 23.1.22.3. Profitability by Market Segments (Product/Channel/Region) 23.1.22.4. Sales Footprint 23.1.22.5. Strategy Overview 23.1.22.5.1. Marketing Strategy 23.1.22.5.2. Product Strategy 23.1.22.5.3. Channel Strategy 23.1.23. Precision Dynamics Corporation 23.1.23.1. Overview 23.1.23.2. Product Portfolio 23.1.23.3. Profitability by Market Segments (Product/Channel/Region) 23.1.23.4. Sales Footprint 23.1.23.5. Strategy Overview 23.1.23.5.1. Marketing Strategy 23.1.23.5.2. Product Strategy 23.1.23.5.3. Channel Strategy 23.1.24. PAPER THERMOMETER™ Company. 23.1.24.1. Overview 23.1.24.2. Product Portfolio 23.1.24.3. Profitability by Market Segments (Product/Channel/Region) 23.1.24.4. Sales Footprint 23.1.24.5. Strategy Overview 23.1.24.5.1. Marketing Strategy 23.1.24.5.2. Product Strategy 23.1.24.5.3. Channel Strategy 24. Assumptions and Acronyms Used 25. Research Methodology
Let us know your requirement to get
100% FREE customization
List of Tables
Table 01: Global Market Value (US$ million) Forecast by Region, 2015 to 2033 Table 02: Global Market Volume (Units) Forecast by Region, 2015 to 2033 Table 03: Global Market Value (US$ million) Forecast by Product Type, 2015 to 2033 Table 04: Global Market Volume (Units) Forecast by Product Type, 2015 to 2033 Table 05: Global Market Value (US$ million) Forecast by Label Information, 2015 to 2033 Table 06: Global Market Volume (Units) Forecast by Label Information, 2015 to 2033 Table 07: Global Market Value (US$ million) Forecast by Technology, 2015 to 2033 Table 08: Global Market Volume (Units) Forecast by Technology, 2015 to 2033 Table 09: Global Market Value (US$ million) Forecast by End Use Industry, 2015 to 2033 Table 10: Global Market Volume (Units) Forecast by End Use Industry, 2015 to 2033 Table 11: North America Market Value (US$ million) Forecast by Country, 2015 to 2033 Table 12: North America Market Volume (Units) Forecast by Country, 2015 to 2033 Table 13: North America Market Value (US$ million) Forecast by Product Type, 2015 to 2033 Table 14: North America Market Volume (Units) Forecast by Product Type, 2015 to 2033 Table 15: North America Market Value (US$ million) Forecast by Label Information, 2015 to 2033 Table 16: North America Market Volume (Units) Forecast by Label Information, 2015 to 2033 Table 17: North America Market Value (US$ million) Forecast by Technology, 2015 to 2033 Table 18: North America Market Volume (Units) Forecast by Technology, 2015 to 2033 Table 19: North America Market Value (US$ million) Forecast by End Use Industry, 2015 to 2033 Table 20: North America Market Volume (Units) Forecast by End Use Industry, 2015 to 2033Table 17: Latin America Market Value (US$ million) Forecast by Country, 2015 to 2033 Table 21: Latin America Market Volume (Units) Forecast by Country, 2015 to 2033 Table 22: Latin America Market Value (US$ million) Forecast by Product Type, 2015 to 2033 Table 23: Latin America Market Volume (Units) Forecast by Product Type, 2015 to 2033 Table 24: Latin America Market Value (US$ million) Forecast by Label Information, 2015 to 2033 Table 25: Latin America Market Volume (Units) Forecast by Label Information, 2015 to 2033 Table 26: Latin America Market Value (US$ million) Forecast by Technology, 2015 to 2033 Table 27: Latin America Market Volume (Units) Forecast by Technology, 2015 to 2033 Table 28: Latin America Market Value (US$ million) Forecast by End Use Industry, 2015 to 2033 Table 29: Latin America Market Volume (Units) Forecast by End Use Industry, 2015 to 2033 Table 30: East Asia Market Value (US$ million) Forecast by Country, 2015 to 2033 Table 31: East Asia Market Volume (Units) Forecast by Country, 2015 to 2033 Table 32: East Asia Market Value (US$ million) Forecast by Product Type, 2015 to 2033 Table 33: East Asia Market Volume (Units) Forecast by Product Type, 2015 to 2033 Table 34: East Asia Market Value (US$ million) Forecast by Label Information, 2015 to 2033 Table 35: East Asia Market Volume (Units) Forecast by Label Information, 2015 to 2033 Table 36: East Asia Market Value (US$ million) Forecast by Technology, 2015 to 2033 Table 37: East Asia Market Volume (Units) Forecast by Technology, 2015 to 2033 Table 38: East Asia Market Value (US$ million) Forecast by End Use Industry, 2015 to 2033 Table 39: East Asia Market Volume (Units) Forecast by End Use Industry, 2015 to 2033 Table 40: South Asia & Pacific Market Value (US$ million) Forecast by Country, 2015 to 2033 Table 41: South Asia & Pacific Market Volume (Units) Forecast by Country, 2015 to 2033 Table 42: South Asia & Pacific Market Value (US$ million) Forecast by Product Type, 2015 to 2033 Table 43: South Asia & Pacific Market Volume (Units) Forecast by Product Type, 2015 to 2033 Table 44: South Asia & Pacific Market Value (US$ million) Forecast by Label Information, 2015 to 2033 Table 45: South Asia & Pacific Market Volume (Units) Forecast by Label Information, 2015 to 2033 Table 46: South Asia & Pacific Market Value (US$ million) Forecast by Technology, 2015 to 2033 Table 47: South Asia & Pacific Market Volume (Units) Forecast by Technology, 2015 to 2033 Table 48: South Asia & Pacific Market Value (US$ million) Forecast by End Use Industry, 2015 to 2033 Table 49: South Asia & Pacific Market Volume (Units) Forecast by End Use Industry, 2015 to 2033 Table 50: Western Europe Market Value (US$ million) Forecast by Country, 2015 to 2033 Table 51: Western Europe Market Volume (Units) Forecast by Country, 2015 to 2033 Table 52: Western Europe Market Value (US$ million) Forecast by Product Type, 2015 to 2033 Table 53: Western Europe Market Volume (Units) Forecast by Product Type, 2015 to 2033 Table 54: Western Europe Market Value (US$ million) Forecast by Label Information, 2015 to 2033 Table 55: Western Europe Market Volume (Units) Forecast by Label Information, 2015 to 2033 Table 56: Western Europe Market Value (US$ million) Forecast by Technology, 2015 to 2033 Table 57: Western Europe Market Volume (Units) Forecast by Technology, 2015 to 2033 Table 58: Western Europe Market Value (US$ million) Forecast by End Use Industry, 2015 to 2033 Table 59: Western Europe Market Volume (Units) Forecast by End Use Industry, 2015 to 2033 Table 60: Eastern Europe Market Value (US$ million) Forecast by Country, 2015 to 2033 Table 61: Eastern Europe Market Volume (Units) Forecast by Country, 2015 to 2033 Table 62: Eastern Europe Market Value (US$ million) Forecast by Product Type, 2015 to 2033 Table 63: Eastern Europe Market Volume (Units) Forecast by Product Type, 2015 to 2033 Table 64: Eastern Europe Market Value (US$ million) Forecast by Label Information, 2015 to 2033 Table 65: Eastern Europe Market Volume (Units) Forecast by Label Information, 2015 to 2033 Table 66: Eastern Europe Market Value (US$ million) Forecast by Technology, 2015 to 2033 Table 67: Eastern Europe Market Volume (Units) Forecast by Technology, 2015 to 2033 Table 68: Eastern Europe Market Value (US$ million) Forecast by End Use Industry, 2015 to 2033 Table 69: Eastern Europe Market Volume (Units) Forecast by End Use Industry, 2015 to 2033 Table 70: Central Asia Market Value (US$ million) Forecast by Country, 2015 to 2033 Table 71: Central Asia Market Volume (Units) Forecast by Country, 2015 to 2033 Table 72: Central Asia Market Value (US$ million) Forecast by Product Type, 2015 to 2033 Table 73: Central Asia Market Volume (Units) Forecast by Product Type, 2015 to 2033 Table 74: Central Asia Market Value (US$ million) Forecast by Label Information, 2015 to 2033 Table 75: Central Asia Market Volume (Units) Forecast by Label Information, 2015 to 2033 Table 76: Central Asia Market Value (US$ million) Forecast by Technology, 2015 to 2033 Table 77: Central Asia Market Volume (Units) Forecast by Technology, 2015 to 2033 Table 78: Central Asia Market Value (US$ million) Forecast by End Use Industry, 2015 to 2033 Table 79: Central Asia Market Volume (Units) Forecast by End Use Industry, 2015 to 2033 Table 80: Russia & Belarus Market Value (US$ million) Forecast by Country, 2015 to 2033 Table 81: Russia & Belarus Market Volume (Units) Forecast by Country, 2015 to 2033 Table 82: Russia & Belarus Market Value (US$ million) Forecast by Product Type, 2015 to 2033 Table 83: Russia & Belarus Market Volume (Units) Forecast by Product Type, 2015 to 2033 Table 84: Russia & Belarus Market Value (US$ million) Forecast by Label Information, 2015 to 2033 Table 85: Russia & Belarus Market Volume (Units) Forecast by Label Information, 2015 to 2033 Table 86: Russia & Belarus Market Value (US$ million) Forecast by Technology, 2015 to 2033 Table 87: Russia & Belarus Market Volume (Units) Forecast by Technology, 2015 to 2033 Table 88: Russia & Belarus Market Value (US$ million) Forecast by End Use Industry, 2015 to 2033 Table 89: Russia & Belarus Market Volume (Units) Forecast by End Use Industry, 2015 to 2033 Table 90: Balkan Countries Market Value (US$ million) Forecast by Country, 2015 to 2033 Table 91: Balkan Countries Market Volume (Units) Forecast by Country, 2015 to 2033 Table 92: Balkan Countries Market Value (US$ million) Forecast by Product Type, 2015 to 2033 Table 93: Balkan Countries Market Volume (Units) Forecast by Product Type, 2015 to 2033 Table 94: Balkan Countries Market Value (US$ million) Forecast by Label Information, 2015 to 2033 Table 95: Balkan Countries Market Volume (Units) Forecast by Label Information, 2015 to 2033 Table 96: Balkan Countries Market Value (US$ million) Forecast by Technology, 2015 to 2033 Table 97: Balkan Countries Market Volume (Units) Forecast by Technology, 2015 to 2033 Table 98: Balkan Countries Market Value (US$ million) Forecast by End Use Industry, 2015 to 2033 Table 99: Balkan Countries Market Volume (Units) Forecast by End Use Industry, 2015 to 2033 Table 100: Baltic Countries Market Value (US$ million) Forecast by Country, 2015 to 2033 Table 101: Baltic Countries Market Volume (Units) Forecast by Country, 2015 to 2033 Table 102: Baltic Countries Market Value (US$ million) Forecast by Product Type, 2015 to 2033 Table 103: Baltic Countries Market Volume (Units) Forecast by Product Type, 2015 to 2033 Table 104: Baltic Countries Market Value (US$ million) Forecast by Label Information, 2015 to 2033 Table 105: Baltic Countries Market Volume (Units) Forecast by Label Information, 2015 to 2033 Table 106: Baltic Countries Market Value (US$ million) Forecast by Technology, 2015 to 2033 Table 107: Baltic Countries Market Volume (Units) Forecast by Technology, 2015 to 2033 Table 108: Baltic Countries Market Value (US$ million) Forecast by End Use Industry, 2015 to 2033 Table 109: Baltic Countries Market Volume (Units) Forecast by End Use Industry, 2015 to 2033 Table 110: Middle East and Africa Market Value (US$ million) Forecast by Country, 2015 to 2033 Table 111: Middle East and Africa Market Volume (Units) Forecast by Country, 2015 to 2033 Table 112: Middle East and Africa Market Value (US$ million) Forecast by Product Type, 2015 to 2033 Table 113: Middle East and Africa Market Volume (Units) Forecast by Product Type, 2015 to 2033 Table 114: Middle East and Africa Market Value (US$ million) Forecast by Label Information, 2015 to 2033 Table 115: Middle East and Africa Market Volume (Units) Forecast by Label Information, 2015 to 2033 Table 116: Middle East and Africa Market Value (US$ million) Forecast by Technology, 2015 to 2033 Table 117: Middle East and Africa Market Volume (Units) Forecast by Technology, 2015 to 2033 Table 118: Middle East and Africa Market Value (US$ million) Forecast by End Use Industry, 2015 to 2033 Table 119: Middle East and Africa Market Volume (Units) Forecast by End Use Industry, 2015 to 2033 Table 120: The United States Market Value (US$ million) Forecast by Product Type, Packaging, and End-user (2023(E) & 2033(F)) Table 121: Canada Market Value (US$ million) Forecast by Product Type, Packaging, and End-user (2023(E) & 2033(F)) Table 122: Brazil Market Value (US$ million) Forecast by Product Type, Packaging, and End-user (2023(E) & 2033(F)) Table 123: Mexico Market Value (US$ million) Forecast by Product Type, Packaging, and End-user (2023(E) & 2033(F)) Table 124: Germany Market Value (US$ million) Forecast by Product Type, Packaging, and End-user (2023(E) & 2033(F)) Table 125: Italy Market Value (US$ million) Forecast by Product Type, Packaging, and End-user (2023(E) & 2033(F)) Table 126: France Market Value (US$ million) Forecast by Product Type, Packaging, and End-user (2023(E) & 2033(F)) Table 127: Spain Market Value (US$ million) Forecast by Product Type, Packaging, and End-user (2023(E) & 2033(F)) Table 128: The United Kingdom Market Value (US$ million) Forecast by Product Type, Packaging, and End-user (2023(E) & 2033(F)) Table 129: China Market Value (US$ million) Forecast by Product Type, Packaging, and End-user (2023(E) & 2033(F)) Table 130: Japan Market Value (US$ million) Forecast by Product Type, Packaging, and End-user (2023(E) & 2033(F)) Table 131: India Market Value (US$ million) Forecast by Product Type, Packaging, and End-user (2023(E) & 2033(F)) Table 132: Australia & New Zealand Market Value (US$ million) Forecast by Product Type, Packaging, and End-user (2023(E) & 2033(F)) Table 133: GCC Countries Market Value (US$ million) Forecast by Product Type, Packaging, and End-user (2023(E) & 2033(F)) Table 134: South Africa Market Value (US$ million) Forecast by Product Type, Packaging, and End-user (2023(E) & 2033(F))
Find your sweet spots for generating winning opportunities in this market.
Talk to AnalystList of Charts
Figure 01: Global Market Value (US$ million) by Product Type, 2023 to 2033 Figure 02: Global Market Value (US$ million) by Label Information, 2023 to 2033 Figure 03: Global Market Value (US$ million) by Technology, 2023 to 2033 Figure 04: Global Market Value (US$ million) by End Use Industry, 2023 to 2033 Figure 05: Global Market Value (US$ million) by Region, 2023 to 2033 Figure 06: Global Market Value (US$ million) Analysis by Region, 2015 to 2022 Figure 07: Global Market Volume (Units) Analysis by Region, 2015 to 2033 Figure 08: Global Market Value Share (%) and BPS Analysis by Region, 2023 & 2033 Figure 09: Global Market Y-o-Y Growth (%) Projections by Region, 2023 to 2033 Figure 10: Global Market Value (US$ million) Analysis by Product Type, 2015 to 2022 Figure 11: Global Market Volume (Units) Analysis by Product Type, 2015 to 2033 Figure 12: Global Market Value Share (%) and BPS Analysis by Product Type, 2023 & 2033 Figure 13: Global Market Y-o-Y Growth (%) Projections by Product Type, 2023 to 2033 Figure 14: Global Market Value (US$ million) Analysis by Label Information, 2015 to 2022 Figure 15: Global Market Volume (Units) Analysis by Label Information, 2015 to 2033 Figure 16: Global Market Value Share (%) and BPS Analysis by Label Information, 2023 & 2033 Figure 17: Global Market Y-o-Y Growth (%) Projections by Label Information, 2023 to 2033 Figure 18: Global Market Value (US$ million) Analysis by Technology, 2015 to 2022 Figure 19: Global Market Volume (Units) Analysis by Technology, 2015 to 2033 Figure 20: Global Market Value Share (%) and BPS Analysis by Technology, 2023 & 2033 Figure 21: Global Market Y-o-Y Growth (%) Projections by Technology, 2023 to 2033 Figure 22: Global Market Value (US$ million) Analysis by End Use Industry, 2015 to 2022 Figure 23: Global Market Volume (Units) Analysis by End Use Industry, 2015 to 2033 Figure 24: Global Market Value Share (%) and BPS Analysis by End Use Industry, 2023 & 2033 Figure 25: Global Market Y-o-Y Growth (%) Projections by End Use Industry, 2023 to 2033 Figure 26: Global Market Attractiveness by Product Type, 2023 to 2033 Figure 27: Global Market Attractiveness by Label Information, 2023 to 2033 Figure 28: Global Market Attractiveness by Technology, 2023 to 2033 Figure 29: Global Market Attractiveness by End Use Industry, 2023 to 2033 Figure 30: Global Market Attractiveness by Region, 2023 to 2033 Figure 31: North America Market Value (US$ million) by Product Type, 2023 to 2033 Figure 32: North America Market Value (US$ million) by Label Information, 2023 to 2033 Figure 33: North America Market Value (US$ million) by Technology, 2023 to 2033 Figure 34: North America Market Value (US$ million) by End Use Industry, 2023 to 2033 Figure 35: North America Market Value (US$ million) by Country, 2023 to 2033 Figure 36: North America Market Value (US$ million) Analysis by Country, 2015 to 2022 Figure 37: North America Market Volume (Units) Analysis by Country, 2015 to 2033 Figure 38: North America Market Value Share (%) and BPS Analysis by Country, 2023 & 2033 Figure 39: North America Market Y-o-Y Growth (%) Projections by Country, 2023 to 2033 Figure 40: North America Market Value (US$ million) Analysis by Product Type, 2015 to 2022 Figure 41: North America Market Volume (Units) Analysis by Product Type, 2015 to 2033 Figure 42: North America Market Value Share (%) and BPS Analysis by Product Type, 2023 & 2033 Figure 43: North America Market Y-o-Y Growth (%) Projections by Product Type, 2023 to 2033 Figure 44: North America Market Value (US$ million) Analysis by Label Information, 2015 to 2022 Figure 45: North America Market Volume (Units) Analysis by Label Information, 2015 to 2033 Figure 46: North America Market Value Share (%) and BPS Analysis by Label Information, 2023 & 2033 Figure 47: North America Market Y-o-Y Growth (%) Projections by Label Information, 2023 to 2033 Figure 48: North America Market Value (US$ million) Analysis by Technology, 2015 to 2022 Figure 49: North America Market Volume (Units) Analysis by Technology, 2015 to 2033 Figure 50: North America Market Value Share (%) and BPS Analysis by Technology, 2023 & 2033 Figure 51: North America Market Y-o-Y Growth (%) Projections by Technology, 2023 to 2033 Figure 52: North America Market Value (US$ million) Analysis by End Use Industry, 2015 to 2022 Figure 53: North America Market Volume (Units) Analysis by End Use Industry, 2015 to 2033 Figure 54: North America Market Value Share (%) and BPS Analysis by End Use Industry, 2023 & 2033 Figure 55: North America Market Y-o-Y Growth (%) Projections by End Use Industry, 2023 to 2033 Figure 56: North America Market Attractiveness by Product Type, 2023 to 2033 Figure 57: North America Market Attractiveness by Label Information, 2023 to 2033 Figure 58: North America Market Attractiveness by Technology, 2023 to 2033 Figure 59: North America Market Attractiveness by End Use Industry, 2023 to 2033 Figure 60: North America Market Attractiveness by Country, 2023 to 2033 Figure 61: Latin America Market Value (US$ million) by Product Type, 2023 & 2033 Figure 62: Latin America Market Value (US$ million) by Product Type, 2023 to 2033 Figure 63: Latin America Market Value (US$ million) by Technology, 2023 to 2033 Figure 64: Latin America Market Value (US$ million) by End Use Industry, 2023 to 2033 Figure 65: Latin America Market Value (US$ million) by Country, 2023 to 2033 Figure 66: Latin America Market Value (US$ million) Analysis by Country, 2015 to 2022 Figure 67: Latin America Market Volume (Units) Analysis by Country, 2015 to 2033 Figure 68: Latin America Market Value Share (%) and BPS Analysis by Country, 2023 & 2033 Figure 69: Latin America Market Y-o-Y Growth (%) Projections by Country, 2023 to 2033 Figure 70: Latin America Market Value (US$ million) Analysis by Product Type, 2015 to 2022 Figure 71: Latin America Market Volume (Units) Analysis by Product Type, 2015 to 2033 Figure 72: Latin America Market Value Share (%) and BPS Analysis by Product Type, 2023 & 2033 Figure 73: Latin America Market Y-o-Y Growth (%) Projections by Product Type, 2023 to 2033 Figure 74: Latin America Market Value (US$ million) Analysis by Product Type, 2015 to 2022 Figure 75: Latin America Market Volume (Units) Analysis by Product Type, 2015 to 2033 Figure 76: Latin America Market Value Share (%) and BPS Analysis by Product Type, 2023 & 2033 Figure 77: Latin America Market Y-o-Y Growth (%) Projections by Product Type, 2023 to 2033 Figure 78: Latin America Market Value (US$ million) Analysis by Technology, 2015 to 2022 Figure 79: Latin America Market Volume (Units) Analysis by Technology, 2015 to 2033 Figure 80: Latin America Market Value Share (%) and BPS Analysis by Technology, 2023 & 2033 Figure 81: Latin America Market Y-o-Y Growth (%) Projections by Technology, 2023 to 2033 Figure 82: Latin America Market Value (US$ million) Analysis by End Use Industry, 2015 to 2022 Figure 83: Latin America Market Volume (Units) Analysis by End Use Industry, 2015 to 2033 Figure 84: Latin America Market Value Share (%) and BPS Analysis by End Use Industry, 2023 & 2033 Figure 85: Latin America Market Y-o-Y Growth (%) Projections by End Use Industry, 2023 to 2033 Figure 86: Latin America Market Attractiveness by Product Type, 2023 to 2033 Figure 87: Latin America Market Attractiveness by Product Type, 2023 to 2033 Figure 88: Latin America Market Attractiveness by Technology, 2023 to 2033 Figure 89: Latin America Market Attractiveness by End Use Industry, 2023 to 2033 Figure 90: Latin America Market Attractiveness by Country, 2023 to 2033 Figure 91: East Asia Market Value (US$ million) by Product Type, 2023 to 2033 Figure 92: East Asia Market Value (US$ million) by Product Type, 2023 to 2033 Figure 93: East Asia Market Value (US$ million) by Technology, 2023 to 2033 Figure 94: East Asia Market Value (US$ million) by End Use Industry, 2023 to 2033 Figure 95: East Asia Market Value (US$ million) by Country, 2023 to 2033 Figure 96: East Asia Market Value (US$ million) Analysis by Country, 2015 to 2022 Figure 97: East Asia Market Volume (Units) Analysis by Country, 2015 to 2033 Figure 98: East Asia Market Value Share (%) and BPS Analysis by Country, 2023 & 2033 Figure 99: East Asia Market Y-o-Y Growth (%) Projections by Country, 2023 to 2033 Figure 100: East Asia Market Value (US$ million) Analysis by Product Type, 2015 to 2022 Figure 101: East Asia Market Volume (Units) Analysis by Product Type, 2015 to 2033 Figure 102: East Asia Market Value Share (%) and BPS Analysis by Product Type, 2023 & 2033 Figure 103: East Asia Market Y-o-Y Growth (%) Projections by Product Type, 2023 to 2033 Figure 104: East Asia Market Value (US$ million) Analysis by Product Type, 2015 to 2022 Figure 105: East Asia Market Volume (Units) Analysis by Product Type, 2015 to 2033 Figure 106: East Asia Market Value Share (%) and BPS Analysis by Product Type, 2023 & 2033 Figure 107: East Asia Market Y-o-Y Growth (%) Projections by Product Type, 2023 to 2033 Figure 108: East Asia Market Value (US$ million) Analysis by Technology, 2015 to 2022 Figure 109: East Asia Market Volume (Units) Analysis by Technology, 2015 to 2033 Figure 110: East Asia Market Value Share (%) and BPS Analysis by Technology, 2023 & 2033 Figure 111: East Asia Market Y-o-Y Growth (%) Projections by Technology, 2023 to 2033 Figure 112: East Asia Market Value (US$ million) Analysis by End Use Industry, 2015 to 2022 Figure 113: East Asia Market Volume (Units) Analysis by End Use Industry, 2015 to 2033 Figure 114: East Asia Market Value Share (%) and BPS Analysis by End Use Industry, 2023 & 2033 Figure 115: East Asia Market Y-o-Y Growth (%) Projections by End Use Industry, 2023 to 2033 Figure 116: East Asia Market Attractiveness by Product Type, 2023 to 2033 Figure 117: East Asia Market Attractiveness by Technology, 2023 to 2033 Figure 118: East Asia Market Attractiveness by End Use Industry, 2023 to 2033 Figure 119: East Asia Market Attractiveness by Country, 2023 to 2033 Figure 120: South Asia & Pacific Market Value (US$ million) by Product Type, 2023 to 2033 Figure 121: South Asia & Pacific Market Value (US$ million) by Label Information, 2023 to 2033 Figure 122: South Asia & Pacific Market Value (US$ million) by Technology, 2023 to 2033 Figure 123 South Asia & Pacific Market Value (US$ million) by End Use Industry, 2023 to 2033 Figure 124: South Asia & Pacific Market Value (US$ million) by Country, 2023 to 2033 Figure 125: South Asia & Pacific Market Value (US$ million) Analysis by Country, 2015 to 2022 Figure 126: South Asia & Pacific Market Volume (Units) Analysis by Country, 2015 to 2033 Figure 127: South Asia & Pacific Market Value Share (%) and BPS Analysis by Country, 2023 & 2033 Figure 128: South Asia & Pacific Market Y-o-Y Growth (%) Projections by Country, 2023 to 2033 Figure 129: South Asia & Pacific Market Value (US$ million) Analysis by Product Type, 2015 to 2022 Figure 130: South Asia & Pacific Market Volume (Units) Analysis by Product Type, 2015 to 2033 Figure 131: South Asia & Pacific Market Value Share (%) and BPS Analysis by Product Type, 2023 & 2033 Figure 132: South Asia & Pacific Market Y-o-Y Growth (%) Projections by Product Type, 2023 to 2033 Figure 133: South Asia & Pacific Market Value (US$ million) Analysis by Label Information, 2015 to 2022 Figure 134: South Asia & Pacific Market Volume (Units) Analysis by Label Information, 2015 to 2033 Figure 135: South Asia & Pacific Market Value Share (%) and BPS Analysis by Label Information, 2023 & 2033 Figure 136: South Asia & Pacific Market Y-o-Y Growth (%) Projections by Label Information, 2023 to 2033 Figure 137: South Asia & Pacific Market Value (US$ million) Analysis by Technology, 2015 to 2022 Figure 138: South Asia & Pacific Market Volume (Units) Analysis by Technology, 2015 to 2033 Figure 139: South Asia & Pacific Market Value Share (%) and BPS Analysis by Technology, 2023 & 2033 Figure 140: South Asia & Pacific Market Y-o-Y Growth (%) Projections by Technology, 2023 to 2033 Figure 141: South Asia & Pacific Market Value (US$ million) Analysis by End Use Industry, 2015 to 2022 Figure 142: South Asia & Pacific Market Volume (Units) Analysis by End Use Industry, 2015 to 2033 Figure 143: South Asia & Pacific Market Value Share (%) and BPS Analysis by End Use Industry, 2023 & 2033 Figure 144: South Asia & Pacific Market Y-o-Y Growth (%) Projections by End Use Industry, 2023 to 2033 Figure 145: South Asia & Pacific Market Attractiveness by Product Type, 2023 to 2033 Figure 146: South Asia & Pacific Market Attractiveness by Label Information, 2023 to 2033 Figure 147: South Asia & Pacific Market Attractiveness by Technology, 2023 to 2033 Figure 148: South Asia & Pacific Market Attractiveness by End Use Industry, 2023 to 2033 Figure 149: South Asia & Pacific Market Attractiveness by Country, 2023 to 2033 Figure 150: Western Europe Market Value (US$ million) by Product Type, 2023 to 2033 Figure 151: Western Europe Market Value (US$ million) by Product Type, 2023 to 2033 Figure 152: Western Europe Market Value (US$ million) by Technology, 2023 to 2033 Figure 153: Western Europe Market Value (US$ million) by End Use Industry, 2023 to 2033 Figure 154: Western Europe Market Value (US$ million) by Country, 2023 to 2033 Figure 155: Western Europe Market Value (US$ million) Analysis by Country, 2015 to 2022 Figure 156: Western Europe Market Volume (Units) Analysis by Country, 2015 to 2033 Figure 157: Western Europe Market Value Share (%) and BPS Analysis by Country, 2023 & 2033 Figure 158: Western Europe Market Y-o-Y Growth (%) Projections by Country, 2023 to 2033 Figure 159: Western Europe Market Value (US$ million) Analysis by Product Type, 2015 to 2022 Figure 160: Western Europe Market Volume (Units) Analysis by Product Type, 2015 to 2033 Figure 161: Western Europe Market Value Share (%) and BPS Analysis by Product Type, 2023 & 2033 Figure 162: Western Europe Market Y-o-Y Growth (%) Projections by Product Type, 2023 to 2033 Figure 163: Western Europe Market Value (US$ million) Analysis by Product Type, 2015 to 2022 Figure 164: Western Europe Market Volume (Units) Analysis by Product Type, 2015 to 2033 Figure 165: Western Europe Market Value Share (%) and BPS Analysis by Product Type, 2023 & 2033 Figure 166: Western Europe Market Y-o-Y Growth (%) Projections by Product Type, 2023 to 2033 Figure 167: Western Europe Market Value (US$ million) Analysis by Technology, 2015 to 2022 Figure 168: Western Europe Market Volume (Units) Analysis by Technology, 2015 to 2033 Figure 169: Western Europe Market Value Share (%) and BPS Analysis by Technology, 2023 & 2033 Figure 170: Western Europe Market Y-o-Y Growth (%) Projections by Technology, 2023 to 2033 Figure 171: Western Europe Market Value (US$ million) Analysis by End Use Industry, 2015 to 2022 Figure 172: Western Europe Market Volume (Units) Analysis by End Use Industry, 2015 to 2033 Figure 173: Western Europe Market Value Share (%) and BPS Analysis by End Use Industry, 2023 & 2033 Figure 174: Western Europe Market Y-o-Y Growth (%) Projections by End Use Industry, 2023 to 2033 Figure 175: Western Europe Market Attractiveness by Product Type, 2023 to 2033 Figure 176: Western Europe Market Attractiveness by Product Type, 2023 to 2033 Figure 177: Western Europe Market Attractiveness by Technology, 2023 to 2033 Figure 178: Western Europe Market Attractiveness by End Use Industry, 2023 to 2033 Figure 179: Western Europe Market Attractiveness by Country, 2023 to 2033 Figure 180: Eastern Europe Market Value (US$ million) by Product Type, 2023 to 2033 Figure 181: Eastern Europe Market Value (US$ million) by Product Type, 2023 to 2033 Figure 182: Eastern Europe Market Value (US$ million) by Technology, 2023 to 2033 Figure 183: Eastern Europe Market Value (US$ million) by End Use Industry, 2023 to 2033 Figure 184: Eastern Europe Market Value (US$ million) by Country, 2023 to 2033 Figure 185: Eastern Europe Market Value (US$ million) Analysis by Country, 2015 to 2022 Figure 186: Eastern Europe Market Volume (Units) Analysis by Country, 2015 to 2033 Figure 187: Eastern Europe Market Value Share (%) and BPS Analysis by Country, 2023 & 2033 Figure 188: Eastern Europe Market Y-o-Y Growth (%) Projections by Country, 2023 to 2033 Figure 189: Eastern Europe Market Value (US$ million) Analysis by Product Type, 2015 to 2022 Figure 190: Eastern Europe Market Volume (Units) Analysis by Product Type, 2015 to 2033 Figure 191: Eastern Europe Market Value Share (%) and BPS Analysis by Product Type, 2023 & 2033 Figure 192: Eastern Europe Market Y-o-Y Growth (%) Projections by Product Type, 2023 to 2033 Figure 193: Eastern Europe Market Value (US$ million) Analysis by Product Type, 2015 to 2022 Figure 194: Eastern Europe Market Volume (Units) Analysis by Product Type, 2015 to 2033 Figure 195: Eastern Europe Market Value Share (%) and BPS Analysis by Product Type, 2023 & 2033 Figure 196: Eastern Europe Market Y-o-Y Growth (%) Projections by Product Type, 2023 to 2033 Figure 197: Eastern Europe Market Value (US$ million) Analysis by Technology, 2015 to 2022 Figure 198: Eastern Europe Market Volume (Units) Analysis by Technology, 2015 to 2033 Figure 199: Eastern Europe Market Value Share (%) and BPS Analysis by Technology, 2023 & 2033 Figure 200: Eastern Europe Market Y-o-Y Growth (%) Projections by Technology, 2023 to 2033 Figure 201: Eastern Europe Market Value (US$ million) Analysis by End Use Industry, 2015 to 2022 Figure 202: Eastern Europe Market Volume (Units) Analysis by End Use Industry, 2015 to 2033 Figure 203: Eastern Europe Market Value Share (%) and BPS Analysis by End Use Industry, 2023 & 2033 Figure 204: Eastern Europe Market Y-o-Y Growth (%) Projections by End Use Industry, 2023 to 2033 Figure 205: Eastern Europe Market Attractiveness by Product Type, 2023 to 2033 Figure 206: Eastern Europe Market Attractiveness by Product Type, 2023 to 2033 Figure 207: Eastern Europe Market Attractiveness by Technology, 2023 to 2033 Figure 208: Eastern Europe Market Attractiveness by End Use Industry, 2023 to 2033 Figure 209: Eastern Europe Market Attractiveness by Country, 2023 to 2033 Figure 210: Central Asia Market Value (US$ million) by Product Type, 2023 to 2033 Figure 211: Central Asia Market Value (US$ million) by Product Type, 2023 to 2033 Figure 212: Central Asia Market Value (US$ million) by Technology, 2023 to 2033 Figure 213: Central Asia Market Value (US$ million) by Country, 2023 to 2033 Figure 214: Central Asia Market Value (US$ million) Analysis by Country, 2015 to 2022 Figure 215: Central Asia Market Volume (Units) Analysis by Country, 2015 to 2033 Figure 216: Central Asia Market Value Share (%) and BPS Analysis by Country, 2023 & 2033 Figure 217: Central Asia Market Y-o-Y Growth (%) Projections by Country, 2023 to 2033 Figure 218: Central Asia Market Value (US$ million) Analysis by Product Type, 2015 to 2022 Figure 219: Central Asia Market Volume (Units) Analysis by Product Type, 2015 to 2033 Figure 220: Central Asia Market Value Share (%) and BPS Analysis by Product Type, 2023 & 2033 Figure 221: Central Asia Market Y-o-Y Growth (%) Projections by Product Type, 2023 to 2033 Figure 222: Central Asia Market Value (US$ million) Analysis by Product Type, 2015 to 2022 Figure 223: Central Asia Market Volume (Units) Analysis by Product Type, 2015 to 2033 Figure 224: Central Asia Market Value Share (%) and BPS Analysis by Product Type, 2023 & 2033 Figure 225: Central Asia Market Y-o-Y Growth (%) Projections by Product Type, 2023 to 2033 Figure 226: Central Asia Market Value (US$ million) Analysis by Technology, 2015 to 2022 Figure 227: Central Asia Market Volume (Units) Analysis by Technology, 2015 to 2033 Figure 228: Central Asia Market Value Share (%) and BPS Analysis by Technology, 2023 & 2033 Figure 229: Central Asia Market Y-o-Y Growth (%) Projections by Technology, 2023 to 2033 Figure 230: Central Asia Market Value (US$ million) Analysis by End Use Industry, 2015 to 2022 Figure 231: Central Asia Market Volume (Units) Analysis by End Use Industry, 2015 to 2033 Figure 232: Central Asia Market Value Share (%) and BPS Analysis by End Use Industry, 2023 & 2033 Figure 233: Central Asia Market Y-o-Y Growth (%) Projections by End Use Industry, 2023 to 2033 Figure 234: Central Asia Market Attractiveness by Product Type, 2023 to 2033 Figure 235: Central Asia Market Attractiveness by Product Type, 2023 to 2033 Figure 236: Central Asia Market Attractiveness by Technology, 2023 to 2033 Figure 237: Central Asia Market Attractiveness by End Use Industry, 2023 to 2033 Figure 238: Central Asia Market Attractiveness by Country, 2023 to 2033 Figure 239: Russia & Belarus Market Value (US$ million) by Product Type, 2023 to 2033 Figure 240: Russia & Belarus Market Value (US$ million) by Product Type, 2023 to 2033 Figure 241: Russia & Belarus Market Value (US$ million) by Technology, 2023 to 2033 Figure 242: Russia & Belarus Market Value (US$ million) by Country, 2023 to 2033 Figure 243: Russia & Belarus Market Value (US$ million) Analysis by Country, 2015 to 2022 Figure 244: Russia & Belarus Market Volume (Units) Analysis by Country, 2015 to 2033 Figure 245: Russia & Belarus Market Value Share (%) and BPS Analysis by Country, 2023 & 2033 Figure 246: Russia & Belarus Market Y-o-Y Growth (%) Projections by Country, 2023 to 2033 Figure 247: Russia & Belarus Market Value (US$ million) Analysis by Product Type, 2015 to 2022 Figure 248: Russia & Belarus Market Volume (Units) Analysis by Product Type, 2015 to 2033 Figure 249: Russia & Belarus Market Value Share (%) and BPS Analysis by Product Type, 2023 & 2033 Figure 250: Russia & Belarus Market Y-o-Y Growth (%) Projections by Product Type, 2023 to 2033 Figure 251: Russia & Belarus Market Value (US$ million) Analysis by Product Type, 2015 to 2022 Figure 252: Russia & Belarus Market Volume (Units) Analysis by Product Type, 2015 to 2033 Figure 253: Russia & Belarus Market Value Share (%) and BPS Analysis by Product Type, 2023 & 2033 Figure 254: Russia & Belarus Market Y-o-Y Growth (%) Projections by Product Type, 2023 to 2033 Figure 255: Russia & Belarus Market Value (US$ million) Analysis by Technology, 2015 to 2022 Figure 256: Russia & Belarus Market Volume (Units) Analysis by Technology, 2015 to 2033 Figure 257: Russia & Belarus Market Value Share (%) and BPS Analysis by Technology, 2023 & 2033 Figure 258: Russia & Belarus Market Y-o-Y Growth (%) Projections by Technology, 2023 to 2033 Figure 259: Russia & Belarus Market Value (US$ million) Analysis by End Use Industry, 2015 to 2022 Figure 260: Russia & Belarus Market Volume (Units) Analysis by End Use Industry, 2015 to 2033 Figure 261: Russia & Belarus Market Value Share (%) and BPS Analysis by End Use Industry, 2023 & 2033 Figure 262: Russia & Belarus Market Y-o-Y Growth (%) Projections by End Use Industry, 2023 to 2033 Figure 263: Russia & Belarus Market Attractiveness by Product Type, 2023 to 2033 Figure 264: Russia & Belarus Market Attractiveness by Product Type, 2023 to 2033 Figure 265: Russia & Belarus Market Attractiveness by Technology, 2023 to 2033 Figure 266: Russia & Belarus Market Attractiveness by End Use Industry, 2023 to 2033 Figure 267: Russia & Belarus Market Attractiveness by Country, 2023 to 2033 Figure 268: Balkan Countries Market Value (US$ million) by Product Type, 2023 to 2033 Figure 269: Balkan Countries Market Value (US$ million) by Product Type, 2023 to 2033 Figure 270: Balkan Countries Market Value (US$ million) by Technology, 2023 to 2033 Figure 271: Balkan Countries Market Value (US$ million) by Country, 2023 to 2033 Figure 272: Balkan Countries Market Value (US$ million) Analysis by Country, 2015 to 2022 Figure 273: Balkan Countries Market Volume (Units) Analysis by Country, 2015 to 2033 Figure 274: Balkan Countries Market Value Share (%) and BPS Analysis by Country, 2023 & 2033 Figure 275: Balkan Countries Market Y-o-Y Growth (%) Projections by Country, 2023 to 2033 Figure 276: Balkan Countries Market Value (US$ million) Analysis by Product Type, 2015 to 2022 Figure 277: Balkan Countries Market Volume (Units) Analysis by Product Type, 2015 to 2033 Figure 278: Balkan Countries Market Value Share (%) and BPS Analysis by Product Type, 2023 & 2033 Figure 279: Balkan Countries Market Y-o-Y Growth (%) Projections by Product Type, 2023 to 2033 Figure 280: Balkan Countries Market Value (US$ million) Analysis by Product Type, 2015 to 2022 Figure 281: Balkan Countries Market Volume (Units) Analysis by Product Type, 2015 to 2033 Figure 282: Balkan Countries Market Value Share (%) and BPS Analysis by Product Type, 2023 & 2033 Figure 283: Balkan Countries Market Y-o-Y Growth (%) Projections by Product Type, 2023 to 2033 Figure 284: Balkan Countries Market Value (US$ million) Analysis by Technology, 2015 to 2022 Figure 285: Balkan Countries Market Volume (Units) Analysis by Technology, 2015 to 2033 Figure 286: Balkan Countries Market Value Share (%) and BPS Analysis by Technology, 2023 & 2033 Figure 287: Balkan Countries Market Y-o-Y Growth (%) Projections by Technology, 2023 to 2033 Figure 288: Balkan Countries Market Value (US$ million) Analysis by End Use Industry, 2015 to 2022 Figure 289: Balkan Countries Market Volume (Units) Analysis by End Use Industry, 2015 to 2033 Figure 290: Balkan Countries Market Value Share (%) and BPS Analysis by End Use Industry, 2023 & 2033 Figure 291: Balkan Countries Market Y-o-Y Growth (%) Projections by End Use Industry, 2023 to 2033 Figure 292: Balkan Countries Market Attractiveness by Product Type, 2023 to 2033 Figure 293: Balkan Countries Market Attractiveness by Product Type, 2023 to 2033 Figure 294: Balkan Countries Market Attractiveness by Technology, 2023 to 2033 Figure 295: Balkan Countries Market Attractiveness by End Use Industry, 2023 to 2033 Figure 296: Balkan Countries Market Attractiveness by Country, 2023 to 2033 Figure 297: Baltic Countries Market Value (US$ million) by Product Type, 2023 to 2033 Figure 298: Baltic Countries Market Value (US$ million) by Product Type, 2023 to 2033 Figure 299: Baltic Countries Market Value (US$ million) by Technology, 2023 to 2033 Figure 300: Baltic Countries Market Value (US$ million) by End Use Industry, 2023 to 2033 Figure 301: Baltic Countries Market Value (US$ million) by Country, 2023 to 2033 Figure 302: Baltic Countries Market Value (US$ million) Analysis by Country, 2015 to 2022 Figure 303: Baltic Countries Market Volume (Units) Analysis by Country, 2015 to 2033 Figure 304: Baltic Countries Market Value Share (%) and BPS Analysis by Country, 2023 & 2033 Figure 305: Baltic Countries Market Y-o-Y Growth (%) Projections by Country, 2023 to 2033 Figure 306: Baltic Countries Market Value (US$ million) Analysis by Product Type, 2015 to 2022 Figure 307: Baltic Countries Market Volume (Units) Analysis by Product Type, 2015 to 2033 Figure 308: Baltic Countries Market Value Share (%) and BPS Analysis by Product Type, 2023 & 2033 Figure 309: Baltic Countries Market Y-o-Y Growth (%) Projections by Product Type, 2023 to 2033 Figure 310: Baltic Countries Market Value (US$ million) Analysis by Product Type, 2015 to 2022 Figure 311: Baltic Countries Market Volume (Units) Analysis by Product Type, 2015 to 2033 Figure 312: Baltic Countries Market Value Share (%) and BPS Analysis by Product Type, 2023 & 2033 Figure 313: Baltic Countries Market Y-o-Y Growth (%) Projections by Product Type, 2023 to 2033 Figure 314: Baltic Countries Market Value (US$ million) Analysis by Technology, 2015 to 2022 Figure 315: Baltic Countries Market Volume (Units) Analysis by Technology, 2015 to 2033 Figure 316: Baltic Countries Market Value Share (%) and BPS Analysis by Technology, 2023 & 2033 Figure 317: Baltic Countries Market Y-o-Y Growth (%) Projections by Technology, 2023 to 2033 Figure 318: Baltic Countries Market Value (US$ million) Analysis by End Use Industry, 2015 to 2022 Figure 319: Baltic Countries Market Volume (Units) Analysis by End Use Industry, 2015 to 2033 Figure 320: Baltic Countries Market Value Share (%) and BPS Analysis End Use Industry, 2023 & 2033 Figure 321: Baltic Countries Market Y-o-Y Growth (%) Projections by End Use Industry, 2023 to 2033 Figure 322: Baltic Countries Market Attractiveness by Product Type, 2023 to 2033 Figure 323: Baltic Countries Market Attractiveness by Product Type, 2023 to 2033 Figure 324: Baltic Countries Market Attractiveness by Technology, 2023 to 2033 Figure 325: Baltic Countries Market Attractiveness by Country, 2023 to 2033 Figure 326: Middle East and Africa Market Value (US$ million) by Product Type, 2023 to 2033 Figure 327: Middle East and Africa Market Value (US$ million) by Label Information, 2023 to 2033 Figure 328: Middle East and Africa Market Value (US$ million) by Technology, 2023 to 2033 Figure 329: Middle East and Africa Market Value (US$ million) by End Use Industry, 2023 to 2033 Figure 330: Middle East and Africa Market Value (US$ million) by Country, 2023 to 2033 Figure 331: Middle East and Africa Market Value (US$ million) Analysis by Country, 2015 to 2022 Figure 332: Middle East and Africa Market Volume (Units) Analysis by Country, 2015 to 2033 Figure 333: Middle East and Africa Market Value Share (%) and BPS Analysis by Country, 2023 & 2033 Figure 334: Middle East and Africa Market Y-o-Y Growth (%) Projections by Country, 2023 to 2033 Figure 335: Middle East and Africa Market Value (US$ million) Analysis by Product Type, 2015 to 2022 Figure 336: Middle East and Africa Market Volume (Units) Analysis by Product Type, 2015 to 2033 Figure 337: Middle East and Africa Market Value Share (%) and BPS Analysis by Product Type, 2023 & 2033 Figure 338: Middle East and Africa Market Y-o-Y Growth (%) Projections by Product Type, 2023 to 2033 Figure 339: Middle East and Africa Market Value (US$ million) Analysis by Label Information, 2015 to 2022 Figure 340: Middle East and Africa Market Volume (Units) Analysis by Label Information, 2015 to 2033 Figure 341: Middle East and Africa Market Value Share (%) and BPS Analysis by Label Information, 2023 & 2033 Figure 342: Middle East and Africa Market Y-o-Y Growth (%) Projections by Label Information, 2023 to 2033 Figure 343: Middle East and Africa Market Value (US$ million) Analysis by Technology, 2015 to 2022 Figure 344: Middle East and Africa Market Volume (Units) Analysis by Technology, 2015 to 2033 Figure 345: Middle East and Africa Market Value Share (%) and BPS Analysis by Technology, 2023 & 2033 Figure 346: Middle East and Africa Market Y-o-Y Growth (%) Projections by Technology, 2023 to 2033 Figure 347: Middle East and Africa Market Value (US$ million) Analysis by End Use Industry, 2015 to 2022 Figure 348: Middle East and Africa Market Volume (Units) Analysis by End Use Industry, 2015 to 2033 Figure 349: Middle East and Africa Market Value Share (%) and BPS Analysis by End Use Industry, 2023 & 2033 Figure 350: Middle East and Africa Market Y-o-Y Growth (%) Projections by End Use Industry, 2023 to 2033 Figure 351: Middle East and Africa Market Attractiveness by Product Type, 2023 to 2033 Figure 352: Middle East and Africa Market Attractiveness by Label Information, 2023 to 2033 Figure 353: Middle East and Africa Market Attractiveness by Technology, 2023 to 2033 Figure 354: Middle East and Africa Market Attractiveness by Country, 2023 to 2033
Need specific information?
Request CustomizationExplore Packaging Insights
View Reports