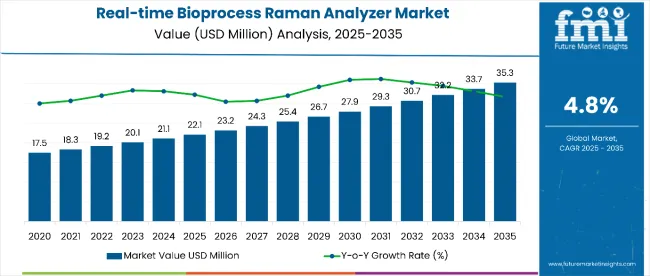
The real-time bioprocess Raman analyzer market is estimated to be valued at USD 22.1 million in 2025. It is projected to reach USD 35.3 million by 2035, registering a compound annual growth rate (CAGR) of 4.8% over the forecast period. The market is projected to add an absolute dollar opportunity of USD 13.2 million over the forecast period. This reflects a 1.6 times growth at a compound annual growth rate of 4.8%. The market's evolution is expected to be shaped by the rising demand for process analytical technologies in biopharmaceutical manufacturing, advancements in Raman spectroscopy technology, and the growing need for real-time monitoring capabilities in bioprocess optimization.
By 2030, the market is likely to reach USD 27.9 million, accounting for USD 5.8 million in incremental value over the first half of the decade. The remaining USD 7.4 million is expected to be realized during the second half, suggesting a steady growth pattern. Product innovation in advanced Raman analyzers, automated systems, and integrated software solutions is gaining traction.
Companies such as Kaiser Optical Systems, Inc. and Thermo Fisher Scientific Inc. are advancing their competitive positions through investment in cutting-edge Raman spectroscopy technology, strategic partnerships, and comprehensive bioprocess monitoring solutions. Rising adoption of process analytical technology (PAT), expanding biopharmaceutical manufacturing, and improved regulatory compliance requirements are supporting expansion into bioprocess analysis, lab-to-process applications, and contract manufacturing organizations. Market performance will remain anchored in technological innovation, analytical accuracy, and real-time monitoring capability benchmarks.
The market holds a notable and growing position within its parent markets. Within the global bioprocess analyzers market, it accounts for 8.2% due to its specialized real-time monitoring capabilities. Within the analytical instruments market, it commands a 3.1% share, supported by advanced Raman spectroscopy technology. It contributes nearly 12.4% to the process analytical technology (PAT) market and 5.8% to the biopharmaceutical equipment segment. In bioprocess monitoring systems, real-time Raman analyzers hold around 15.7% share, driven by regulatory compliance requirements. Across the broader spectroscopy equipment market, its share is close to 6.3%, owing to its position as a leading real-time analytical solution for bioprocessing applications.
The market is undergoing a strategic transformation driven by rising demand for continuous bioprocess monitoring, advanced spectroscopic technologies, and comprehensive process optimization solutions. Advanced analytical technologies using Raman spectroscopy, automated sampling systems, and integrated software platforms have enhanced monitoring accuracy, process control capabilities, and product quality assurance, making real-time bioprocess Raman analyzers essential tools for modern biopharmaceutical manufacturing. Manufacturers are introducing specialized configurations, including portable systems and integrated bioprocess platforms tailored for different manufacturing scales, expanding their role beyond basic monitoring to comprehensive process analytics. Strategic collaborations between analyzer manufacturers and bioprocessing companies have accelerated innovation in technology development and market penetration.
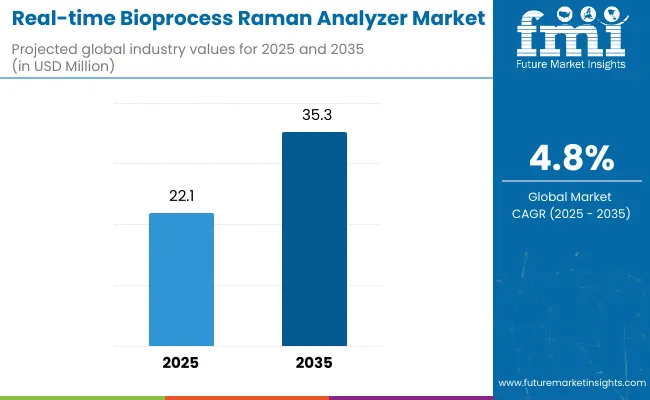
| Metric | Value |
|---|---|
| Estimated Size (2025E) | USD 22.1 million |
| Projected Value (2035F) | USD 35.3 million |
| CAGR (2025 to 2035) | 4.8% |
The real-time bioprocess Raman analyzer market's steady growth is driven by increasing biopharmaceutical manufacturing complexity, regulatory compliance requirements, and expanding adoption of process analytical technology (PAT), making it an essential tool for pharmaceutical companies and biotech manufacturers seeking advanced process monitoring solutions. The rising production of biologics, improved understanding of bioprocess optimization, and growing focus on quality-by-design (QbD) approaches appeal to manufacturers prioritizing real-time process control and product consistency.
A growing emphasis on continuous manufacturing, personalized medicine development, and regulatory compliance is further propelling adoption, particularly in biopharmaceutical companies, contract manufacturing organizations, and research institutions. Rising investment in bioprocess technology, expanding biologic drug pipelines, and regulatory support for PAT implementation are also enhancing technology accessibility and market penetration.
As bioprocess optimization and quality assurance become increasingly important across pharmaceutical manufacturing systems, the market outlook remains favorable. With manufacturers prioritizing process efficiency, product quality, and regulatory compliance, real-time bioprocess Raman analyzers are well-positioned to expand across various bioprocessing, pharmaceutical, and research applications.
The market is segmented by product type, application, end-user, and region. By product type, the market is bifurcated into instruments (Raman Analyzers and Raman Probes) and Software. Based on application, the market is categorized into lab to process analysis and bioprocess analysis. In terms of end-user, the market is classifiedinto biopharmaceutical companies, contract manufacturing organizations, and research organizations. Regionally, the market is divided into North America, Europe, Asia Pacific, Latin America, and the Middle East & Africa.
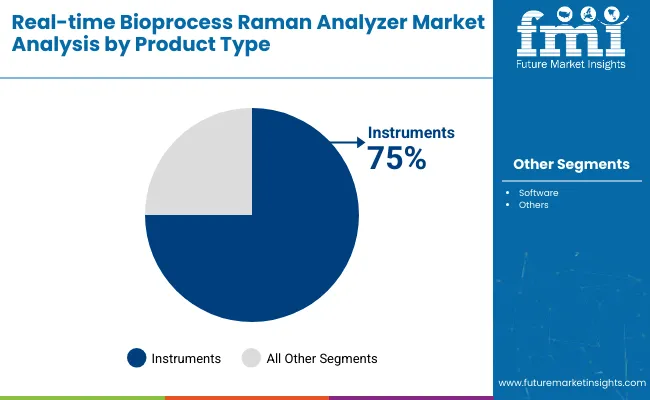
The instruments segment holds a dominant position with 75% of the market share in the product type category, owing to the critical need for hardware components in real-time bioprocess monitoring, including Raman analyzers and specialized probes required for accurate spectroscopic analysis. Instruments are widely deployed across biopharmaceutical and contract manufacturing settings due to their essential role in process analytical technology, ability to provide continuous monitoring capabilities, and integration with existing bioprocess control systems.
The segment enables manufacturers to achieve real-time process optimization while maintaining excellent analytical precision and measurement reliability in complex bioprocessing environments. As demand for advanced bioprocess monitoring, automated systems, and integrated analytical platforms grows, the instruments segment continues to gain preference in both small-scale research and large-scale commercial manufacturing.
Manufacturers are investing in the development of advanced instruments, miniaturization technologies, and enhanced integration capabilities to improve analytical performance, reduce system complexity, and expand application versatility. The segment is poised to grow further as global bioprocessing standards favor real-time monitoring solutions and technology adoption accelerates.
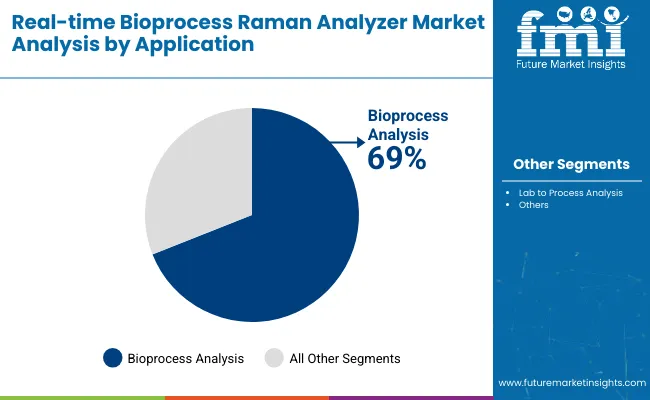
Bioprocess Analysis remains the core application segment with 69% of the market share in 2025, as it provides essential real-time monitoring capabilities for biopharmaceutical manufacturing processes, including fermentation monitoring, cell culture optimization, and downstream processing control. The segment's functional expertise supports critical process parameters monitoring, product quality assurance, and regulatory compliance in commercial bioprocessing environments.
Bioprocess analysis applications ensure optimal nutrient management, metabolite monitoring, and contamination detection for biologic production, while offering integrated process control and data management capabilities. This makes them indispensable in modern biopharmaceutical manufacturing and commercial production environments.
Ongoing expansion of biologic drug production and the specialization required for complex bioprocess optimization are key trends driving the sustained dominance of bioprocess analysis applications in this market.
In 2024, global real-time bioprocess Raman analyzer adoption grew steadily, with North America taking a significant market share. Applications include bioprocess monitoring, quality control, and process optimization. Manufacturers are introducing advanced analytical systems and integrated software platforms that deliver superior monitoring capabilities and process optimization outcomes. Raman-based systems now support comprehensive bioprocess analytics positioning. Evidence-based monitoring protocols and regulatory guidelines provide manufacturers with confidence. Technology providers increasingly supply ready-to-use integrated systems with extensive software packages to reduce implementation complexity.
Advanced Raman Technology Drives Demand for Bioprocess Monitoring
Biopharmaceutical companies and manufacturing facilities are choosing real-time Raman analyzers to achieve superior process control, enhance product quality, and meet growing demands for continuous monitoring and process optimization solutions. In bioprocessing applications, advanced Raman systems deliver real-time analytical capabilities with high precision and minimal sample preparation requirements. Systems configured with Raman technology maintain analytical accuracy throughout extended production cycles and diverse process conditions. In manufacturing settings, integrated Raman programs help reduce process variability while maintaining quality standards. These analytical applications are now being deployed for complex biologic production, increasing adoption in sectors demanding comprehensive real-time monitoring capabilities.
Cost Considerations and Technical Complexity Limit Growth
Market expansion faces constraints due to high initial capital investment, technical complexity requirements, and specialized operator training needs. Advanced Raman analyzer systems can range from USD 150,000 to USD 500,000, depending on configuration and integration requirements, impacting adoption rates and leading to extended evaluation periods in some organizations. Integration with existing bioprocess control systems and validation requirements adds complexity to implementation timelines. Specialized maintenance requirements and calibration protocols extend operational costs compared to conventional offline analytical methods. Limited availability of trained personnel restricts scalable technology adoption, especially for smaller biotech companies and research organizations.
| Country | CAGR (2025 to 2035) |
|---|---|
| China | 6.0% |
| India | 5.8% |
| Brazil | 5.3% |
| USA | 4.8% |
| UK | 4.3% |
| France | 4.1% |
| Germany | 3.8% |
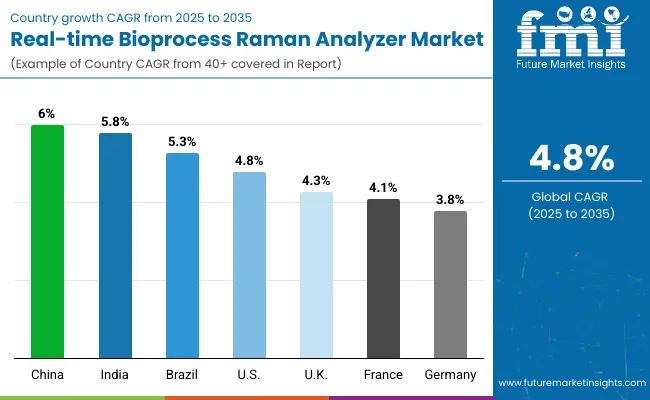
In the real-time bioprocess Raman analyzer market, China leads with the highest projected CAGR of 6.0% from 2025 to 2035, driven by rapid biopharmaceutical industry expansion, increasing manufacturing capacity, and growing adoption of process analytical technology. India follows with a CAGR of 5.8%, supported by the expanding biotech sector and rising contract manufacturing activities. Germany shows steady growth at 3.8%, benefiting from an advanced pharmaceutical infrastructure and established bioprocessing expertise. Brazil, France, and the USA demonstrate consistent growth at 5.3%, 4.1%, and 4.8% respectively, supported by established biopharmaceutical industries and regulatory frameworks. The UK, with a CAGR of 4.3%, experiences moderate expansion, supported by a strong pharmaceutical sector and established analytical technology adoption.
The report covers an in-depth analysis of 40+ countries; seven top-performing OECD countries are highlighted below.
Revenue from real-time bioprocess Raman analyzers in China is projected to grow at a CAGR of 6.0% from 2025 to 2035, significantly exceeding the global average. Growth is fueled by expanding biopharmaceutical manufacturing capacity, increasing adoption of advanced analytical technologies, and growing focus on process optimization across major manufacturing hubs, including Beijing, Shanghai, and Guangzhou. Chinese biopharmaceutical facilities are increasingly adopting real-time monitoring systems as regulatory requirements become more stringent and quality standards improve.
Key Statistics:
The real-time bioprocess Raman analyzer market in the USA is anticipated to expand at a CAGR of 4.8% from 2025 to 2035, reflecting mature market dynamics with consistent technology adoption. Growth is centered on advanced bioprocess optimization and regulatory compliance in established biopharmaceutical centers across California, Massachusetts, and New Jersey regions. Comprehensive monitoring protocols and FDA guidelines support continued technology deployment across diverse manufacturing environments.
Key Statistics:
Sales of real-time bioprocess Raman analyzers in India are projected to flourish at a CAGR of 5.8% from 2025 to 2035, approaching regional leadership levels. Growth has been concentrated in expanding contract manufacturing capabilities and biosimilar production development in the Mumbai, Hyderabad, and Pune regions. Technology adoption is advancing from basic process monitoring toward comprehensive real-time analytical approaches.
Key Statistics:
Demand for real-time bioprocess Raman analyzers in Germany is expected to increase at a CAGR of 3.8% from 2025 to 2035, reflecting mature market characteristics with steady technology adoption. Demand is driven by advanced pharmaceutical infrastructure, robust regulatory compliance, and comprehensive quality assurance requirements in Berlin, Munich, and Frankfurt bioprocessing centers. Evidence-based monitoring protocols and specialized analytical capabilities are increasingly supporting biologic production optimization.
Key Statistics:
Revenue from real-time bioprocess Raman analyzers in France is projected to rise at a CAGR of 4.1% from 2025 to 2035, supported by steady demand for advanced analytical technologies and integrated bioprocess control systems. Bioprocessing facilities in Paris, Lyon, and Toulouse are experiencing expansion in process analytical technology adoption, evidence-based monitoring protocols, and quality-by-design approaches. French pharmaceutical institutions are leveraging advanced Raman systems to meet stringent quality expectations for biologic production and process optimization.
Key Statistics:
The real-time bioprocess Raman analyzer market in the UK is expected to grow at a CAGR of 4.3% from 2025 to 2035, reflecting steady mature market expansion with a focus on innovation and regulatory excellence. Growth is driven by advanced pharmaceutical research capabilities and process optimization initiatives in the London, Cambridge, and Oxford bioprocessing regions. Integrated analytical pathways and specialized biotech networks are expanding technology accessibility, while pharmaceutical companies incorporate evidence-based real-time monitoring into comprehensive manufacturing programs.
Key Statistics:
Demand for real-time bioprocess Raman analyzers in Brazil is projected to expand at a CAGR of 5.3% from 2025 to 2035, driven by growing biopharmaceutical sector development and expanding process analytical technology adoption. Growth is concentrated in emerging bioprocessing markets, including São Paulo, Rio de Janeiro, and Belo Horizonte, where pharmaceutical manufacturing and analytical capabilities are expanding. Healthcare infrastructure investments and international technology partnerships are gradually building comprehensive bioprocess monitoring capabilities.
Key Statistics:
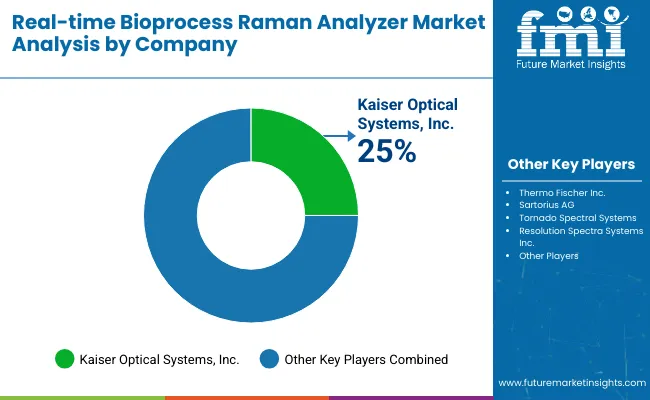
The Real-time Bioprocess Raman Analyzer Market is gaining rapid momentum as biopharmaceutical manufacturers increasingly adopt process analytical technology (PAT) to enhance yield consistency and regulatory compliance. Key players such as Kaiser Optical Systems Inc., Resolution Spectra Systems Inc., and Tornado Spectral Systems are at the forefront, offering high-precision Raman analyzers capable of real-time molecular monitoring during fermentation and cell culture processes. Thermo Fisher Scientific Inc. and Sartorius AG are integrating Raman spectroscopy into their bioprocess automation portfolios to enable seamless data-driven process control and quality assurance.
Innovators like MarqMetrix Inc., Wasatch Photonics Inc., and Real Time Analyzer Inc. are focusing on compact, fiber-optic, and scalable Raman analyzers that support continuous biomanufacturing and upstream process optimization. These systems facilitate non-invasive, reagent-free analysis of critical process parameters such as glucose, lactate, and product titer.
| Items | Value |
|---|---|
| Quantitative Units (2025) | USD 22.1 Million |
| Product Type | Instruments (Raman Analyzers, Raman Probes), Software |
| Application | Lab to Process Analysis, Bioprocess Analysis |
| End User | Biopharmaceutical Companies, Contract Manufacturing Organizations, Research Organizations |
| Regions Covered | North America, Europe, Asia Pacific, Latin America, Middle East & Africa |
| Countries Covered | United States, Canada, United Kingdom, Germany, France, China, Japan, South Korea, Brazil, Australia, India and 40 + Countries |
| Key Companies Profiled | Kaiser Optical Systems Inc., Resolution Spectra Systems Inc., Tornado Spectral Systems, Sartorius AG, Thermo Fisher Scientific Inc., MarqMetrix Inc., Wasatch Photonics Inc., Real Time Analyzer Inc. |
| Additional Attributes | Dollar sales by application and product type, regional adoption trends, competitive landscape, preferences for in-line versus at-line analysis, integration with bioprocess monitoring systems, and innovations in Raman spectroscopy, data analytics, and quality standardization |
The global real-time bioprocess Raman analyzer market is estimated to be valued at USD 22.1 million in 2025.
The market size for real-time bioprocess Raman analyzer is projected to reach USD 35.3 million by 2035.
The real-time bioprocess Raman analyzer market is expected to grow at a 4.8% CAGR between 2025 and 2035.
The instruments segment is projected to lead in the real-time bioprocess Raman analyzer market with 75% market share in 2025.
In terms of application, the bioprocess analysis segment is projected to command 69% share in the real-time bioprocess Raman analyzer market in 2025.


Our Research Products

The "Full Research Suite" delivers actionable market intel, deep dives on markets or technologies, so clients act faster, cut risk, and unlock growth.

The Leaderboard benchmarks and ranks top vendors, classifying them as Established Leaders, Leading Challengers, or Disruptors & Challengers.

Locates where complements amplify value and substitutes erode it, forecasting net impact by horizon

We deliver granular, decision-grade intel: market sizing, 5-year forecasts, pricing, adoption, usage, revenue, and operational KPIs—plus competitor tracking, regulation, and value chains—across 60 countries broadly.

Spot the shifts before they hit your P&L. We track inflection points, adoption curves, pricing moves, and ecosystem plays to show where demand is heading, why it is changing, and what to do next across high-growth markets and disruptive tech

Real-time reads of user behavior. We track shifting priorities, perceptions of today’s and next-gen services, and provider experience, then pace how fast tech moves from trial to adoption, blending buyer, consumer, and channel inputs with social signals (#WhySwitch, #UX).

Partner with our analyst team to build a custom report designed around your business priorities. From analysing market trends to assessing competitors or crafting bespoke datasets, we tailor insights to your needs.
Supplier Intelligence
Discovery & Profiling
Capacity & Footprint
Performance & Risk
Compliance & Governance
Commercial Readiness
Who Supplies Whom
Scorecards & Shortlists
Playbooks & Docs
Category Intelligence
Definition & Scope
Demand & Use Cases
Cost Drivers
Market Structure
Supply Chain Map
Trade & Policy
Operating Norms
Deliverables
Buyer Intelligence
Account Basics
Spend & Scope
Procurement Model
Vendor Requirements
Terms & Policies
Entry Strategy
Pain Points & Triggers
Outputs
Pricing Analysis
Benchmarks
Trends
Should-Cost
Indexation
Landed Cost
Commercial Terms
Deliverables
Brand Analysis
Positioning & Value Prop
Share & Presence
Customer Evidence
Go-to-Market
Digital & Reputation
Compliance & Trust
KPIs & Gaps
Outputs
Full Research Suite comprises of:
Market outlook & trends analysis
Interviews & case studies
Strategic recommendations
Vendor profiles & capabilities analysis
5-year forecasts
8 regions and 60+ country-level data splits
Market segment data splits
12 months of continuous data updates
DELIVERED AS:
PDF EXCEL ONLINE
Bioprocess Fermentation Monitoring Market Analysis - Size, Share, and Forecast Outlook 2025 to 2035
Bioprocess Technology Market Size and Share Forecast Outlook 2025 to 2035
Bioprocessing Analytics Equipment Market Size and Share Forecast Outlook 2025 to 2035
Bioprocessing Supplies Market Size and Share Forecast Outlook 2025 to 2035
Bioprocess Integrity Testing Systems Market Size and Share Forecast Outlook 2025 to 2035
Bioprocess Validation Market Analysis by Testing Type, Stage, Mode, and Region through 2035
Bioprocess Containers & Fluid Transfer Solutions Market – Trends & Forecast 2025 to 2035
Bioprocessing Systems Market
Portable Bioprocessing Bioreactors Market Size and Share Forecast Outlook 2025 to 2035
Upstream Bioprocessing Equipment Market - Growth, Trends & Forecast 2025 to 2035
Single-use Bioprocessing Probes and Sensors Market - Growth & Trends 2024 to 2034
TOC Analyzer Market Size and Share Forecast Outlook 2025 to 2035
ESR Analyzer Market Analysis - Size, Share, and Forecast 2025 to 2035
XRF Analyzer Market Growth – Trends & Forecast 2019-2027
Lens Analyzer Market Size and Share Forecast Outlook 2025 to 2035
Fuel Analyzer Market
Solar Analyzer Market Size and Share Forecast Outlook 2025 to 2035
Boron Analyzer Market Size and Share Forecast Outlook 2025 to 2035
Metal Analyzers Market Size and Share Forecast Outlook 2025 to 2035
Power Analyzers Market

Thank you!
You will receive an email from our Business Development Manager. Please be sure to check your SPAM/JUNK folder too.
Chat With
MaRIA