Tortilla Market Size and Forecast Outlook 2025 to 2035

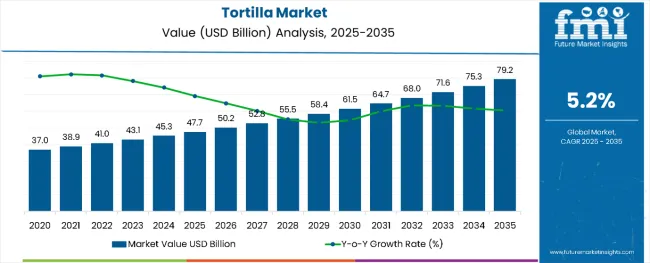
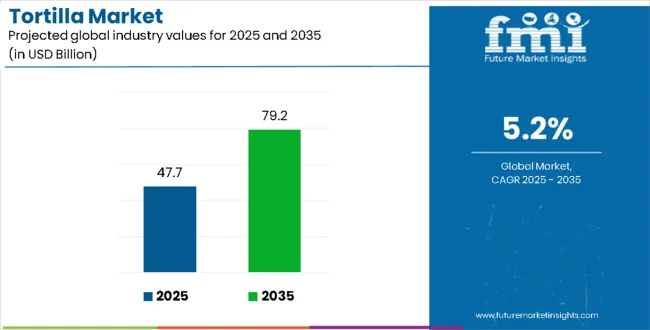
The global tortilla market is expected to grow significantly, reaching a valuation of USD 47.7 billion in 2025 and projected to expand to USD 79.2 billion by 2035, registering a robust CAGR of 5.2%. This growth is underpinned by shifting dietary preferences, increased consumption of ethnic foods, and the growing popularity of convenience foods across both developed and emerging industries.

Quick Stats in Tortilla Market

  • Market Value (2025): USD 47.7 billion
  • Forecast Value (2035): USD 79.2 billion
  • Forecast CAGR: 5.2%
  • Fastest Growing Product Type: Chips (5.5% CAGR)
  • Fastest Growing Source: Corn (5.15% CAGR)
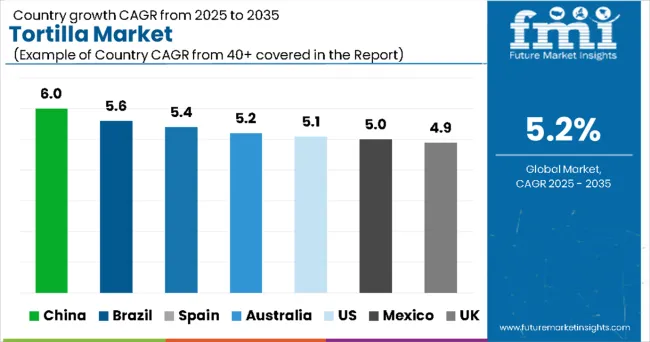
  • Key Growth Country: China (6% CAGR)
Metric Value
Industry Size (2025E) USD 47.7 billion
Industry Value (2035F) USD 79.2 billion
CAGR (2025 to 2035) 5.2%

Government regulations in the industry primarily revolve around food safety, labeling standards, and permissible ingredients, with increasing emphasis on health and transparency. In the United States, the FDA mandates clear nutritional labeling, allergen disclosures, and limits on trans fats and sodium content, pushing manufacturers to reformulate products. In the European Union, EFSA guidelines enforce stringent checks on food additives and GMOs, prompting a shift toward non-GMO and organic ingredients.

Additionally, countries in Latin America have implemented front-of-pack labeling and sugar-content warnings to promote healthier food choices. Globally, regulatory bodies are also encouraging the use of whole grains and fortified flours in staple foods like to combat nutrient deficiencies. These evolving frameworks are driving manufacturers to prioritize compliance, cleaner labels, and more health-aligned formulations across regions.

China is expected to be the fastest-growing market for tortillas, with a projected CAGR of 6% from 2025 to 2035. Chips will lead the product type segment with a CAGR of 5.5% during the forecast period. Corn will dominate the source segment, registering a CAGR of 5.15%. Overall, the tortilla market is anticipated to grow at a compound annual growth rate (CAGR) of 5.2% over the forecast period.

Tortilla Market Analysis by Top Investment Segments

The global market is segmented by product type into tostadas, taco shells, corn tortilla, flour tortilla, and chips; by source into corn and wheat; by processing type into fresh and frozen; and by distribution channel into online and offline, with offline further segmented into supermarkets, convenience stores, and others (independent grocery stores, foodservice outlets, institutional buyers, and specialty & ethnic stores).

Regionally, the industry is analyzed across North America, Latin America, Western Europe, Eastern Europe, South Asia and Pacific, East Asia, the Middle East and Africa.

Tortilla Market Analysis by Product Type

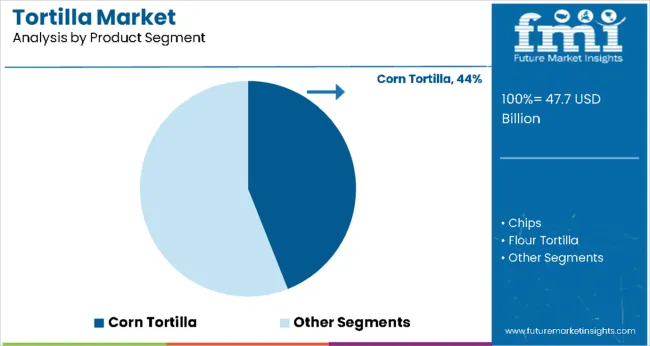
Corn tortillas are projected to maintain dominance in the industry, contributing the highest revenue share throughout the forecast period. Valued at USD 21.4 billion in 2025, this segment is expected to reach USD 35.4 billion by 2035, registering a CAGR of 5.15%.

Growth is driven by rising demand for gluten-free products, strong cultural association in Latin America, and widespread use across global QSR and foodservice menus. Corn tortillas continue to outperform due to their affordability, shelf stability, and dietary compatibility.

Tortilla chips are anticipated to be the fastest-growing product type, expanding from USD 9.5 billion in 2025 to USD 16.3 billion by 2035 at a CAGR of 5.5%. Their popularity is fueled by the global snacking trend, increased consumption at social gatherings, and the surge in Tex-Mex cuisine across retail and restaurant channels.

The segment is further supported by innovations in flavors and packaging variants, such as baked and multigrain chips.

Flour tortillas, valued at USD 10.8 billion in 2025, are projected to reach USD 17.3 billion by 2035, growing at a CAGR of 4.8%. Their soft texture, flexibility, and consumer preference in North America and Europe support consistent demand.

In contrast, tostadas and taco shells, though smaller in size, will grow steadily due to their use in traditional dishes and increasing adoption in meal kits and ready-to-eat formats.

Product Type Segments CAGR (2025-2035)
Corn Tortilla 5.15%
Flour Tortilla 4.8%
Chips 5.5%
Tostadas 4.2%
Taco Shells 4%

Tortilla Market Analysis by Source

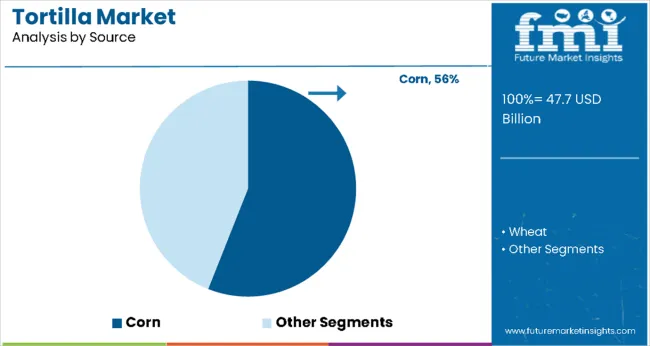
Corn is projected to retain dominance in the industry, contributing the largest share by value over the forecast period. Estimated to account for USD 26.8 billion in 2025, corn is forecasted to reach USD 44.7 billion by 2035, growing at a CAGR of 5.15%.

This segment’s continued strength is supported by increasing global demand for gluten-free and non-GMO products, as well as strong cultural relevance across Latin America. Corn is also favored for their longer shelf life, cost-effectiveness, and compatibility with traditional and modern recipes alike.

Wheat, widely preferred in North America and Europe due to their soft texture and adaptability for wraps and fusion foods, is projected to grow from USD 20.9 billion in 2025 to USD 34.0 billion by 2035, at a CAGR of 4.8%. Growth in this segment is driven by increasing product innovation, such as high-fiber and low-carb wheat formulations, catering to urban health-conscious consumers. While slightly trailing corn in growth rate, wheat continues to be an essential segment due to its appeal in fast-casual food service and retail.

Source Segments CAGR (2025-2035)
Corn 5.15%
Wheat 4.8%

Tortilla Market Analysis by Processing Type

Fresh tortillas are projected to dominate the market by processing type, accounting for the highest share in terms of revenue and volume through the forecast period. Valued at USD 29.4 billion in 2025, the fresh segment is expected to reach USD 49.7 billion by 2035, registering a CAGR of 5.5%. This growth is underpinned by increasing consumer preference for freshly made, preservative-free options and the widespread availability of in-store bakeries and local producers across both developed and emerging industries.

The rise of quick-service restaurants (QSRs) and fast-casual chains has further elevated the demand for fresh tortillas, particularly in Latin American, North American, and Asian foodservice sectors.

Frozen tortillas, while comprising a smaller share, are anticipated to grow steadily from USD 18.3 billion in 2025 to USD 29.5 billion by 2035, translating to a CAGR of 4.9%.

Their growth is supported by extended shelf life, logistical advantages for bulk storage and export, and rising demand in institutional catering and retail chains. Manufacturers are also investing in advanced freezing technologies that preserve texture and taste, reducing the perceived quality gap with fresh alternatives.

Processing Type Segments CAGR (2025-2035)
Fresh 5.5%
Frozen 4.9%

Tortilla Market Analysis by Distribution Channel

Offline retail is projected to remain the dominant distribution channel for the global market, accounting for a significant share throughout the forecast period. In 2025, offline sales are expected to generate USD 41.2 billion in revenue and are projected to reach USD 67.9 billion by 2035, growing at a CAGR of 5.1%. Within offline, supermarkets represent the largest sub-segment, fueled by their broad shelf space, variety of private label and branded options, and widespread consumer footfall.

Supermarkets alone are anticipated to expand from USD 24.7 billion in 2025 to USD 41.6 billion by 2035, at a CAGR of 5.4%. Convenience stores are also gaining traction, particularly in urban and semi-urban zones, projected to grow from USD 9.3 billion in 2025 to USD 14.5 billion by 2035, growing at 4.5%.

The online segment, while smaller in base value, is set to grow at the fastest pace due to rising digital penetration and consumer preference for home delivery. Online sales are projected to increase from USD 6.5 billion in 2025 to USD 11.3 billion by 2035, registering a CAGR of 5.6%. This growth is supported by the increasing adoption of e-commerce platforms, subscription food services, and D2C brands expanding product offerings with customizable packs and clean-label credentials.

Distribution Channel Segments CAGR (2025-2035)
Online 5.6%
Offline 5.1%

Tortilla Market Analysis by Top Countries

United States

The United States is projected to remain the largest contributor to the global market, with sales estimated at USD 12.5 billion in 2025 and expected to reach USD 20.3 billion by 2035, growing at a CAGR of 5.1%. A significant driver is the mainstream integration of products into American cuisine beyond Hispanic communities, spanning retail, fast-casual dining, and meal kit segments. Consumer interest in high-protein, plant-based, and gluten-free variants is expanding, pushing manufacturers to introduce differentiated SKUs aligned with wellness and dietary trends.

Regulatory mandates from the FDA, such as sodium reduction targets and labeling requirements, are encouraging cleaner formulations and innovation in whole-grain and low-carb offerings. Private-label dominance in supermarkets continues to expand, especially as inflation drives value-conscious purchasing. Simultaneously, foodservice growth driven by QSR chains and ghost kitchens is lifting demand for bulk formats. Online grocery penetration has stabilized post-COVID, yet remains a reliable channel for premium and specialty purchases, particularly in urban areas.

Country CAGR (2025-2035)
United States 5.1%

Mexico

Mexico’s tortilla market is forecast to expand from USD 9.8 billion in 2025 to USD 16.0 billion by 2035, reflecting a CAGR of 5.1%. As the birthplace of the tortilla, the country benefits from unparalleled per capita consumption and entrenched cultural reliance on corn-based staples. While the artisanal sector remains vital in rural areas, urbanization is accelerating demand for packaged products with longer shelf life, especially in large-format retail and convenience channels.

Regulatory oversight by COFEPRIS has driven quality and hygiene compliance, particularly for mass-produced items. Labeling reforms mandating nixtamalization and sodium disclosures are pushing formal players to modernize operations. Meanwhile, international exports, particularly to the USA, are increasing from USDA-certified plants in Guanajuato and Jalisco. Local manufacturing is also shifting toward multi-product lines, including flour, tostadas, and low-sodium alternatives. Government programs supporting corn price stability are keeping input costs controlled, enabling continued value tiering across income segments. Domestic QSR and foodservice growth further enhances demand for wholesale formats.

Country CAGR (2025-2035)
Mexico 5.1%

Spain

Sales in Spain are set to increase from USD 1.2 billion in 2025 to USD 2.0 billion by 2035, achieving a CAGR of 5.4%. The growing influence of Tex-Mex cuisine in urban centers has led to a sharp rise in restaurant chains, food trucks, and hybrid QSR models incorporating tortilla-based dishes. Retailers such as Mercadona and Carrefour are expanding private-label offerings with a focus on value-driven multi-pack formats. EU regulation on origin transparency and additive control continues to reshape the product landscape, compelling producers to shift toward clean-label, gluten-free, and non-GMO variants. The rise of health-focused consumer behavior is evident, with whole-wheat and fiber-enriched options gaining shelf space.

Spain’s grain-processing clusters offer logistical advantages for regional exports to Northern Africa and southern Europe. E-commerce has also emerged as a vital distribution channel for bundled offerings such as tortillas with seasoning kits. With institutional buyers growing in school and workplace food programs, demand remains broad-based and resilient across segments.

Country CAGR (2025-2035)
Spain 5.4%

France

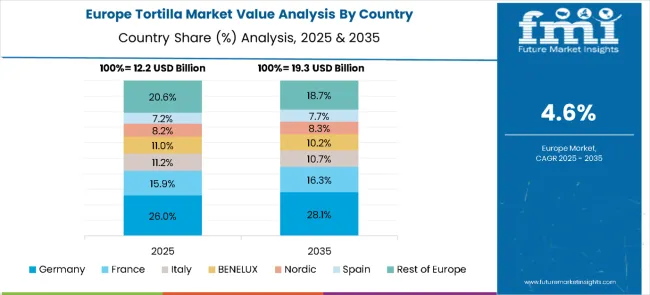
France’s tortilla market is expected to grow from USD 1.1 billion in 2025 to USD 1.8 billion by 2035, registering a CAGR of 5%. French consumers’ rising preference for international cuisines, particularly Latin American and Mediterranean fusion, is expanding usage beyond traditional applications. Products are increasingly featured in ready-to-eat, chilled, and meal kit categories, especially in urban supermarket chains and premium grocery formats. Regulatory pressures from ANSES and Nutri-Score scoring systems are pushing manufacturers to reduce sodium content, enhance fiber, and shift toward whole-grain ingredients.

Major bakeries are responding with product-line diversification, including organic, ancient-grain, and legume-based products. Foodservice demand is accelerating across casual dining and quick-service restaurants, aided by Paris’s booming hospitality recovery. Distribution remains retail-dominant, but direct-to-consumer models, particularly through local artisanal brands, are gaining popularity via online grocery. Investment in packaging innovation is also supporting extended shelf life and sustainable differentiation.

Country CAGR (2025-2035)
France 5%

United Kingdom

The UK tortilla market is projected to grow from USD 1.0 billion in 2025 to USD 1.6 billion by 2035, reflecting a CAGR of 5.1%. British consumers are increasingly adopting products as versatile staples, used in lunch wraps, quesadillas, and global street-food formats. Post-Brexit regulatory realignments have spurred domestic production of both corn and wheat-based variants, reducing reliance on imports and minimizing price volatility. Health campaigns by the NHS have led to stronger uptake of baked, low-salt, and high-fiber products, particularly in middle-income households. Private-label offerings now dominate supermarket share, especially in Tesco, Sainsbury’s, and Aldi.

Convenience stores and the meal-deal culture continue to drive weekday volume, while food delivery aggregators such as Just Eat and Deliveroo are expanding late-night product consumption. Regulatory focus on allergen labeling and front-of-pack scoring has led to increased formulation transparency and brand repositioning in the premium segment.

Country CAGR (2025-2035)
United Kingdom 5.1%

Germany

Sales in Germany are forecast to grow from USD 0.9 billion in 2025 to USD 1.5 billion by 2035, reflecting a CAGR of 5.0%. The increasing popularity of flexitarian and meat-free diets has created favorable conditions for protein-enriched product variants, with plant-based wraps showing double-digit growth. Retail distribution is heavily driven by discounters Aldi, Lidl, and Rewe, who are rapidly expanding their assortment under private labels, especially in whole grain and multigrain formats.

German food safety authorities, including the BfR, have introduced stricter controls on acrylamide levels and food additives, forcing producers to revise heat-processing methods and reduce chemical preservatives. Tortilla chips are also emerging as a high-growth subcategory within the snack sector, appealing to younger demographics. E-commerce growth remains modest but stable, while high sustainability awareness among German consumers is accelerating the adoption of biodegradable and mono-material packaging.

Country CAGR (2025-2035)
Germany 5%

Brazil

Brazil’s tortilla market is projected to rise from USD 2.1 billion in 2025 to USD 3.7 billion by 2035, reflecting a robust CAGR of 5.6%. The country’s rapid urbanization, now over 87%, is driving increased demand for convenience foods, including wraps and ready-to-eat formats. While products are not traditional in Brazilian cuisine, the influence of Tex-Mex and fusion restaurants is accelerating consumer adoption, particularly in metropolitan areas like São Paulo and Rio de Janeiro.

Regulatory enforcement by ANVISA has tightened ingredient labeling and food additive guidelines, encouraging cleaner recipes and standardization in commercial production. Local manufacturers benefit from reliable corn supply in the country’s Midwest region, reducing cost exposure to global price volatility. A reduction in import duties on wheat has also favored flour producers targeting upscale QSRs.

Country CAGR (2025-2035)
Brazil 5.6%

Canada

Sales in Canada are forecast to grow from USD 0.8 billion in 2025 to USD 1.3 billion by 2035, reflecting a CAGR of 4.8%. Growth is driven by increasing demand from multicultural households, evolving dietary preferences, and a robust foodservice landscape. Major Canadian grocers-Loblaw, Sobeys, and Metro-are expanding shelf space for private-label and premium product offerings.

Health Canada regulations around sodium limits and trans-fat restrictions have pushed manufacturers to adopt reformulated, clean-label products. Imports from U.S.-based producers remain important, but local production has grown in Ontario and Quebec due to cross-border supply efficiency and NAFTA-aligned logistics. On the foodservice side, national chains and independent QSRs are featuring -based items more prominently, especially in fast-casual and vegetarian menus. Online grocery sales remain modest but growing, primarily focused on ethnic and gluten-free variants. Retailers are leveraging in-house bakeries to offer fresh, preservative-free in urban regions.

Country CAGR (2025-2035)
Canada 4.8%

Australia

Australia’s tortilla market is anticipated to expand from USD 0.7 billion in 2025 to USD 1.2 billion by 2035, registering a CAGR of 5.2%. The rising popularity of Mexican and global street-food cuisine among millennials is fueling growth across both retail and foodservice. Coles and Woolworths lead distribution, offering strong private-label assortments and imported brands in the premium health segment.

The FSANZ regulatory framework promotes clean labeling and encourages nutrient transparency, leading to the expansion of gluten-free, whole grain, and plant-based options. High-income consumer segments are showing growing preference for organic and functional SKUs- those enriched with flaxseed, quinoa, or legumes. Food delivery services such as Menulog and Uber Eats are supporting demand in evening and weekend meals, especially in burrito and taco formats. Packaging recyclability and shelf-life stability are key innovation areas, with several suppliers transitioning to biodegradable and resealable materials. Additionally, QSRs and franchise chains are scaling Tex-Mex menus across urban and regional centers.

Country CAGR (2025-2035)
Australia 5.2%

China

China’s tortilla market is expected to grow from USD 4.0 billion in 2025 to USD 7.2 billion by 2035, yielding a CAGR of 6%. Growth is powered by increasing Westernization of consumer diets and strong adoption of international fast-casual brands in tier-1 and tier-2 cities. Young professionals and students are particularly receptive to -based offerings in urban cafes and meal kits.

Regulatory supervision by SAMR is tightening food safety and additive disclosures, nudging manufacturers toward clean-label, low-sodium products. Domestic production clusters are emerging in coastal provinces like Guangdong and Jiangsu, offering both B2B and retail supply. Online grocery platforms such as JD.com and Alibaba’s Freshippo are accelerating category penetration by bundling with ready-to-cook Mexican kits. E-commerce also facilitates regional product differentiation, including spicy and fusion-style. Urban middle-class expansion and high-speed cold chain logistics are enabling fresh distribution in growing suburban retail industries across eastern and southern China.

Country CAGR (2025-2035)
China 6%

Tortilla Market Players Strategies and Share Analysis

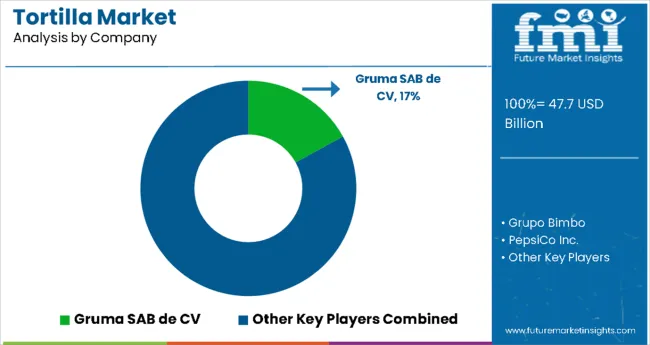
The five largest manufacturers command roughly 55% of global revenues, underscoring a moderately consolidated landscape. Gruma leads with an estimated 17% share on the back of its Mission and Maseca brands, vertically integrated corn supply, and multiregional milling assets.

Grupo Bimbo follows at about 12%, using its bakery distribution network to cross-merchandise and accelerate penetration in South America and Europe. PepsiCo holds 11%, concentrated in the chips sub-segment through Doritos and Tostitos, while General Mills captures 8% via Old El Paso and shelf-ready packaging programs. Ole Mexican Foods rounds out the top tier at 7%, buoyed by strong USA Hispanic loyalty and expanding club-store placement.

To defend share, leaders are deepening vertical integration and automating production lines. Gruma is rolling out nixtamalization systems that reduce water usage by 15% and raise throughput, while Grupo Bimbo’s venture arm backs start-ups in gluten-free and legume-based wraps to broaden its health portfolio.

PepsiCo is retrofitting plants with high-speed fryers and piloting AI flavor analytics to meet snack-demand spikes, and General Mills is prioritizing recyclable mono-material films plus quick-steam soft-tortilla packs for e-commerce. Ole Mexican Foods is expanding capacity in Georgia and Oregon to shorten delivery lead times and trim freight costs.

Growth strategies hinge on geographic diversification, premiumization, and omni-channel reach. Multinationals are targeting Southeast Asia, where QSR expansion is lifting acceptance, while premium SKUs organic, high-protein, and low-carb-command up to 25% higher margins, supporting R\&D into alternative grains and plant proteins. Digital marketing now absorbs more than 40% of media budgets; TikTok recipe challenges and FIFA-themed coupon drops are proving effective for Gen Z engagement and quick volume lifts.

Sustainability has become a decisive battleground. Industry leaders are securing carbon-neutral certifications, shifting to renewable electricity, and publishing lifecycle-assessment dashboards for retailers’ ESG scorecards. Water-recycling loops and biomass boilers are lowering scope-1 emissions 8-10% at upgraded facilities, reinforcing both cost and reputational advantages.

Meanwhile, smaller players such as La Factory, CatalliaMexican Foods, and Azteca Foods each with sub-1% share compete through provenance storytelling, artisanal flavors, and regional distribution. By pooling resources in co-packing hubs and shared cold-chain cooperatives, these challengers gain national e-retail reach without heavy capex, while partnerships with meal-kit brands and specialty grocers help them capture premium niches and sidestep mainstream price wars.

Leading Tortilla Suppliers

Key players like Gruma SAB de CV, Grupo Bimbo, and PepsiCo Inc. dominate the USA tortilla market by offering extensive product lines and continuous innovation. Gruma leads globally in corn flour and tortillas, exporting through its subsidiary Mission Foods and driving "Better for You" brands like keto-friendly tortillas. Grupo Bimbo and General Mills also hold strong positions by emphasizing product diversity-uch as wraps, corn, and flour tortillas-and by investing in emerging formats.

Other notable suppliers, including Aranda’s Company Inc., Ole Mexican Foods Inc., Easy Foods Inc., Catallia Mexican Foods, and Azteca Foods Inc., are investing in regional expansion and clean-label product lines. Tyson Foods Inc., La Factory, and Tyson’s foodservice innovations are increasing their presence with ready-to-eat tortilla options. Strong market competition is driving new product formats, healthier ingredient profiles, and sustainable packaging.

Report Scope for the Global Tortilla Market

Attribute Details
Current Total Market Size (2025) USD 47.7 billion
Projected Market Size (2035) USD 79.2 billion
CAGR (2025 to 2035) 5.2%
Base Year for Estimation 2024
Historical Period 2020-2024
Projections Period 2025-2035
Report Parameter Revenue in USD billion/ volume in units
By Product Type Tostadas, Taco Shells, Corn Tortilla, Flour Tortilla, Chips
By Source Corn and Wheat
By Processing Type Fresh and Frozen
By Distribution Channel Online, Offline, Supermarkets, Convenience Stores, Others (independent grocery stores, foodservice outlets, institutional buyers, and specialty & ethnic stores)
Regions Covered North America, Latin America, Western Europe, Eastern Europe, South Asia, Pacific, East Asia, Middle East and Africa
Countries Covered United States, Mexico, Spain, France, United Kingdom, Germany, Brazil, Canada, Australia, China
Key Players Grupo Bimbo SAB de CV, General Mills, Aranda's Company Inc., Ole Mexican Foods Inc., Easy Foods Inc., Gruma SAB de CV, PepsiCo Inc., La Factory, Catallia Mexican Foods, Tyson Foods Inc., Azteca Foods Inc.
Additional Attributes Dollar sales by value, market share analysis by region, and country-wise analysis

Segmentation Analysis of the Tortilla Market

By Product Type:

  • Tostadas
  • Taco Shells
  • Corn Tortilla
  • Flour Tortilla
  • Tortilla Chips

By Source:

  • Corn
  • Wheat

By Processing Type:

  • Fresh
  • Frozen

By Distribution Channel:

  • Online
  • Offline
  • Supermarkets
  • Convenience Stores
  • Others

By Region:

  • North America
  • Latin America
  • Western Europe
  • Eastern Europe
  • South Asia and Pacific
  • East Asia
  • The Middle East and Africa

Table of Content

  1. Executive Summary
  2. Market Overview
  3. Market Background
  4. Global Market Analysis 2020 to 2024 and Forecast 2025 to 2035
  5. Global Market Analysis 2020 to 2024 and Forecast 2025 to 2035, By Product Type
    • Tostadas
    • Taco Shells
    • Corn Tortilla
    • Flour Tortilla
    • Chips
  6. Global Market Analysis 2020 to 2024 and Forecast 2025 to 2035, By Source
    • Corn
    • Wheat
  7. Global Market Analysis 2020 to 2024 and Forecast 2025 to 2035, By Processing Type
    • Fresh
    • Frozen
  8. Global Market Analysis 2020 to 2024 and Forecast 2025 to 2035, By Distribution Channel
    • Online
    • Offline
      • Supermarkets
      • Convenience Stores
      • Others (independent grocery stores, foodservice outlets, institutional buyers, and specialty & ethnic stores)
  9. Global Market Analysis 2020 to 2024 and Forecast 2025 to 2035, By Region
    • North America
    • Latin America
    • Western Europe
    • Eastern Europe
    • South Asia and Pacific
    • East Asia
    • Middle East and Africa
  10. North America Market Analysis 2020 to 2024 and Forecast 2025 to 2035, By Country
  11. Latin America Market Analysis 2020 to 2024 and Forecast 2025 to 2035, By Country
  12. Western Europe Market Analysis 2020 to 2024 and Forecast 2025 to 2035, By Country
  13. Eastern Europe Market Analysis 2020 to 2024 and Forecast 2025 to 2035, By Country
  14. South Asia and Pacific Market Analysis 2020 to 2024 and Forecast 2025 to 2035, By Country
  15. East Asia Market Analysis 2020 to 2024 and Forecast 2025 to 2035, By Country
  16. Middle East and Africa Market Analysis 2020 to 2024 and Forecast 2025 to 2035, By Country
  17. Key Countries Market Analysis
  18. Market Structure Analysis
  19. Competition Analysis
    • Grupo Bimbo SAB de CV
    • General Mills
    • Aranda's Company Inc.
    • Ole Mexican Foods Inc.
    • Easy Foods Inc.
    • Gruma SAB de CV
    • PepsiCo Inc.
    • La Factory
    • Catallia Mexican Foods
    • Tyson Foods Inc.
    • Azteca Foods Inc.
  20. Assumptions & Acronyms Used
  21. Research Methodology

List of Tables

  • Table 1: Global Market Value (USD Million) Forecast by Region, 2020 to 2035
  • Table 2: Global Market Volume (Unit Pack) Forecast by Region, 2020 to 2035
  • Table 3: Global Market Value (USD Million) Forecast by Product Type, 2020 to 2035
  • Table 4: Global Market Volume (Unit Pack) Forecast by Product Type, 2020 to 2035
  • Table 5: Global Market Value (USD Million) Forecast by Source, 2020 to 2035
  • Table 6: Global Market Volume (Unit Pack) Forecast by Source, 2020 to 2035
  • Table 7: Global Market Value (USD Million) Forecast by Processing Type, 2020 to 2035
  • Table 8: Global Market Volume (Unit Pack) Forecast by Processing Type, 2020 to 2035
  • Table 9: Global Market Value (USD Million) Forecast by Distribution Channel, 2020 to 2035
  • Table 10: Global Market Volume (Unit Pack) Forecast by Distribution Channel, 2020 to 2035
  • Table 11: North America Market Value (USD Million) Forecast by Country, 2020 to 2035
  • Table 12: North America Market Volume (Unit Pack) Forecast by Country, 2020 to 2035
  • Table 13: North America Market Value (USD Million) Forecast by Product Type, 2020 to 2035
  • Table 14: North America Market Volume (Unit Pack) Forecast by Product Type, 2020 to 2035
  • Table 15: North America Market Value (USD Million) Forecast by Source, 2020 to 2035
  • Table 16: North America Market Volume (Unit Pack) Forecast by Source, 2020 to 2035
  • Table 17: North America Market Value (USD Million) Forecast by Processing Type, 2020 to 2035
  • Table 18: North America Market Volume (Unit Pack) Forecast by Processing Type, 2020 to 2035
  • Table 19: North America Market Value (USD Million) Forecast by Distribution Channel, 2020 to 2035
  • Table 20: North America Market Volume (Unit Pack) Forecast by Distribution Channel, 2020 to 2035
  • Table 21: Latin America Market Value (USD Million) Forecast by Country, 2020 to 2035
  • Table 22: Latin America Market Volume (Unit Pack) Forecast by Country, 2020 to 2035
  • Table 23: Latin America Market Value (USD Million) Forecast by Product Type, 2020 to 2035
  • Table 24: Latin America Market Volume (Unit Pack) Forecast by Product Type, 2020 to 2035
  • Table 25: Latin America Market Value (USD Million) Forecast by Source, 2020 to 2035
  • Table 26: Latin America Market Volume (Unit Pack) Forecast by Source, 2020 to 2035
  • Table 27: Latin America Market Value (USD Million) Forecast by Processing Type, 2020 to 2035
  • Table 28: Latin America Market Volume (Unit Pack) Forecast by Processing Type, 2020 to 2035
  • Table 29: Latin America Market Value (USD Million) Forecast by Distribution Channel, 2020 to 2035
  • Table 30: Latin America Market Volume (Unit Pack) Forecast by Distribution Channel, 2020 to 2035
  • Table 31: Western Europe Market Value (USD Million) Forecast by Country, 2020 to 2035
  • Table 32: Western Europe Market Volume (Unit Pack) Forecast by Country, 2020 to 2035
  • Table 33: Western Europe Market Value (USD Million) Forecast by Product Type, 2020 to 2035
  • Table 34: Western Europe Market Volume (Unit Pack) Forecast by Product Type, 2020 to 2035
  • Table 35: Western Europe Market Value (USD Million) Forecast by Source, 2020 to 2035
  • Table 36: Western Europe Market Volume (Unit Pack) Forecast by Source, 2020 to 2035
  • Table 37: Western Europe Market Value (USD Million) Forecast by Processing Type, 2020 to 2035
  • Table 38: Western Europe Market Volume (Unit Pack) Forecast by Processing Type, 2020 to 2035
  • Table 39: Western Europe Market Value (USD Million) Forecast by Distribution Channel, 2020 to 2035
  • Table 40: Western Europe Market Volume (Unit Pack) Forecast by Distribution Channel, 2020 to 2035
  • Table 41: Eastern Europe Market Value (USD Million) Forecast by Country, 2020 to 2035
  • Table 42: Eastern Europe Market Volume (Unit Pack) Forecast by Country, 2020 to 2035
  • Table 43: Eastern Europe Market Value (USD Million) Forecast by Product Type, 2020 to 2035
  • Table 44: Eastern Europe Market Volume (Unit Pack) Forecast by Product Type, 2020 to 2035
  • Table 45: Eastern Europe Market Value (USD Million) Forecast by Source, 2020 to 2035
  • Table 46: Eastern Europe Market Volume (Unit Pack) Forecast by Source, 2020 to 2035
  • Table 47: Eastern Europe Market Value (USD Million) Forecast by Processing Type, 2020 to 2035
  • Table 48: Eastern Europe Market Volume (Unit Pack) Forecast by Processing Type, 2020 to 2035
  • Table 49: Eastern Europe Market Value (USD Million) Forecast by Distribution Channel, 2020 to 2035
  • Table 50: Eastern Europe Market Volume (Unit Pack) Forecast by Distribution Channel, 2020 to 2035
  • Table 51: South Asia and Pacific Market Value (USD Million) Forecast by Country, 2020 to 2035
  • Table 52: South Asia and Pacific Market Volume (Unit Pack) Forecast by Country, 2020 to 2035
  • Table 53: South Asia and Pacific Market Value (USD Million) Forecast by Product Type, 2020 to 2035
  • Table 54: South Asia and Pacific Market Volume (Unit Pack) Forecast by Product Type, 2020 to 2035
  • Table 55: South Asia and Pacific Market Value (USD Million) Forecast by Source, 2020 to 2035
  • Table 56: South Asia and Pacific Market Volume (Unit Pack) Forecast by Source, 2020 to 2035
  • Table 57: South Asia and Pacific Market Value (USD Million) Forecast by Processing Type, 2020 to 2035
  • Table 58: South Asia and Pacific Market Volume (Unit Pack) Forecast by Processing Type, 2020 to 2035
  • Table 59: South Asia and Pacific Market Value (USD Million) Forecast by Distribution Channel, 2020 to 2035
  • Table 60: South Asia and Pacific Market Volume (Unit Pack) Forecast by Distribution Channel, 2020 to 2035
  • Table 61: East Asia Market Value (USD Million) Forecast by Country, 2020 to 2035
  • Table 62: East Asia Market Volume (Unit Pack) Forecast by Country, 2020 to 2035
  • Table 63: East Asia Market Value (USD Million) Forecast by Product Type, 2020 to 2035
  • Table 64: East Asia Market Volume (Unit Pack) Forecast by Product Type, 2020 to 2035
  • Table 65: East Asia Market Value (USD Million) Forecast by Source, 2020 to 2035
  • Table 66: East Asia Market Volume (Unit Pack) Forecast by Source, 2020 to 2035
  • Table 67: East Asia Market Value (USD Million) Forecast by Processing Type, 2020 to 2035
  • Table 68: East Asia Market Volume (Unit Pack) Forecast by Processing Type, 2020 to 2035
  • Table 69: East Asia Market Value (USD Million) Forecast by Distribution Channel, 2020 to 2035
  • Table 70: East Asia Market Volume (Unit Pack) Forecast by Distribution Channel, 2020 to 2035
  • Table 71: Middle East and Africa Market Value (USD Million) Forecast by Country, 2020 to 2035
  • Table 72: Middle East and Africa Market Volume (Unit Pack) Forecast by Country, 2020 to 2035
  • Table 73: Middle East and Africa Market Value (USD Million) Forecast by Product Type, 2020 to 2035
  • Table 74: Middle East and Africa Market Volume (Unit Pack) Forecast by Product Type, 2020 to 2035
  • Table 75: Middle East and Africa Market Value (USD Million) Forecast by Source, 2020 to 2035
  • Table 76: Middle East and Africa Market Volume (Unit Pack) Forecast by Source, 2020 to 2035
  • Table 77: Middle East and Africa Market Value (USD Million) Forecast by Processing Type, 2020 to 2035
  • Table 78: Middle East and Africa Market Volume (Unit Pack) Forecast by Processing Type, 2020 to 2035
  • Table 79: Middle East and Africa Market Value (USD Million) Forecast by Distribution Channel, 2020 to 2035
  • Table 80: Middle East and Africa Market Volume (Unit Pack) Forecast by Distribution Channel, 2020 to 2035

List of Figures

  • Figure 1: Global Market Value (USD Million) by Product Type, 2025 to 2035
  • Figure 2: Global Market Value (USD Million) by Source, 2025 to 2035
  • Figure 3: Global Market Value (USD Million) by Processing Type, 2025 to 2035
  • Figure 4: Global Market Value (USD Million) by Distribution Channel, 2025 to 2035
  • Figure 5: Global Market Value (USD Million) by Region, 2025 to 2035
  • Figure 6: Global Market Value (USD Million) Analysis by Region, 2020 to 2035
  • Figure 7: Global Market Volume (Unit Pack) Analysis by Region, 2020 to 2035
  • Figure 8: Global Market Value Share (%) and BPS Analysis by Region, 2025 to 2035
  • Figure 9: Global Market Y-o-Y Growth (%) Projections by Region, 2025 to 2035
  • Figure 10: Global Market Value (USD Million) Analysis by Product Type, 2020 to 2035
  • Figure 11: Global Market Volume (Unit Pack) Analysis by Product Type, 2020 to 2035
  • Figure 12: Global Market Value Share (%) and BPS Analysis by Product Type, 2025 to 2035
  • Figure 13: Global Market Y-o-Y Growth (%) Projections by Product Type, 2025 to 2035
  • Figure 14: Global Market Value (USD Million) Analysis by Source, 2020 to 2035
  • Figure 15: Global Market Volume (Unit Pack) Analysis by Source, 2020 to 2035
  • Figure 16: Global Market Value Share (%) and BPS Analysis by Source, 2025 to 2035
  • Figure 17: Global Market Y-o-Y Growth (%) Projections by Source, 2025 to 2035
  • Figure 18: Global Market Value (USD Million) Analysis by Processing Type, 2020 to 2035
  • Figure 19: Global Market Volume (Unit Pack) Analysis by Processing Type, 2020 to 2035
  • Figure 20: Global Market Value Share (%) and BPS Analysis by Processing Type, 2025 to 2035
  • Figure 21: Global Market Y-o-Y Growth (%) Projections by Processing Type, 2025 to 2035
  • Figure 22: Global Market Value (USD Million) Analysis by Distribution Channel, 2020 to 2035
  • Figure 23: Global Market Volume (Unit Pack) Analysis by Distribution Channel, 2020 to 2035
  • Figure 24: Global Market Value Share (%) and BPS Analysis by Distribution Channel, 2025 to 2035
  • Figure 25: Global Market Y-o-Y Growth (%) Projections by Distribution Channel, 2025 to 2035
  • Figure 26: Global Market Attractiveness by Product Type, 2025 to 2035
  • Figure 27: Global Market Attractiveness by Source, 2025 to 2035
  • Figure 28: Global Market Attractiveness by Processing Type, 2025 to 2035
  • Figure 29: Global Market Attractiveness by Distribution Channel, 2025 to 2035
  • Figure 30: Global Market Attractiveness by Region, 2025 to 2035
  • Figure 31: North America Market Value (USD Million) by Product Type, 2025 to 2035
  • Figure 32: North America Market Value (USD Million) by Source, 2025 to 2035
  • Figure 33: North America Market Value (USD Million) by Processing Type, 2025 to 2035
  • Figure 34: North America Market Value (USD Million) by Distribution Channel, 2025 to 2035
  • Figure 35: North America Market Value (USD Million) by Country, 2025 to 2035
  • Figure 36: North America Market Value (USD Million) Analysis by Country, 2020 to 2035
  • Figure 37: North America Market Volume (Unit Pack) Analysis by Country, 2020 to 2035
  • Figure 38: North America Market Value Share (%) and BPS Analysis by Country, 2025 to 2035
  • Figure 39: North America Market Y-o-Y Growth (%) Projections by Country, 2025 to 2035
  • Figure 40: North America Market Value (USD Million) Analysis by Product Type, 2020 to 2035
  • Figure 41: North America Market Volume (Unit Pack) Analysis by Product Type, 2020 to 2035
  • Figure 42: North America Market Value Share (%) and BPS Analysis by Product Type, 2025 to 2035
  • Figure 43: North America Market Y-o-Y Growth (%) Projections by Product Type, 2025 to 2035
  • Figure 44: North America Market Value (USD Million) Analysis by Source, 2020 to 2035
  • Figure 45: North America Market Volume (Unit Pack) Analysis by Source, 2020 to 2035
  • Figure 46: North America Market Value Share (%) and BPS Analysis by Source, 2025 to 2035
  • Figure 47: North America Market Y-o-Y Growth (%) Projections by Source, 2025 to 2035
  • Figure 48: North America Market Value (USD Million) Analysis by Processing Type, 2020 to 2035
  • Figure 49: North America Market Volume (Unit Pack) Analysis by Processing Type, 2020 to 2035
  • Figure 50: North America Market Value Share (%) and BPS Analysis by Processing Type, 2025 to 2035
  • Figure 51: North America Market Y-o-Y Growth (%) Projections by Processing Type, 2025 to 2035
  • Figure 52: North America Market Value (USD Million) Analysis by Distribution Channel, 2020 to 2035
  • Figure 53: North America Market Volume (Unit Pack) Analysis by Distribution Channel, 2020 to 2035
  • Figure 54: North America Market Value Share (%) and BPS Analysis by Distribution Channel, 2025 to 2035
  • Figure 55: North America Market Y-o-Y Growth (%) Projections by Distribution Channel, 2025 to 2035
  • Figure 56: North America Market Attractiveness by Product Type, 2025 to 2035
  • Figure 57: North America Market Attractiveness by Source, 2025 to 2035
  • Figure 58: North America Market Attractiveness by Processing Type, 2025 to 2035
  • Figure 59: North America Market Attractiveness by Distribution Channel, 2025 to 2035
  • Figure 60: North America Market Attractiveness by Country, 2025 to 2035
  • Figure 61: Latin America Market Value (USD Million) by Product Type, 2025 to 2035
  • Figure 62: Latin America Market Value (USD Million) by Source, 2025 to 2035
  • Figure 63: Latin America Market Value (USD Million) by Processing Type, 2025 to 2035
  • Figure 64: Latin America Market Value (USD Million) by Distribution Channel, 2025 to 2035
  • Figure 65: Latin America Market Value (USD Million) by Country, 2025 to 2035
  • Figure 66: Latin America Market Value (USD Million) Analysis by Country, 2020 to 2035
  • Figure 67: Latin America Market Volume (Unit Pack) Analysis by Country, 2020 to 2035
  • Figure 68: Latin America Market Value Share (%) and BPS Analysis by Country, 2025 to 2035
  • Figure 69: Latin America Market Y-o-Y Growth (%) Projections by Country, 2025 to 2035
  • Figure 70: Latin America Market Value (USD Million) Analysis by Product Type, 2020 to 2035
  • Figure 71: Latin America Market Volume (Unit Pack) Analysis by Product Type, 2020 to 2035
  • Figure 72: Latin America Market Value Share (%) and BPS Analysis by Product Type, 2025 to 2035
  • Figure 73: Latin America Market Y-o-Y Growth (%) Projections by Product Type, 2025 to 2035
  • Figure 74: Latin America Market Value (USD Million) Analysis by Source, 2020 to 2035
  • Figure 75: Latin America Market Volume (Unit Pack) Analysis by Source, 2020 to 2035
  • Figure 76: Latin America Market Value Share (%) and BPS Analysis by Source, 2025 to 2035
  • Figure 77: Latin America Market Y-o-Y Growth (%) Projections by Source, 2025 to 2035
  • Figure 78: Latin America Market Value (USD Million) Analysis by Processing Type, 2020 to 2035
  • Figure 79: Latin America Market Volume (Unit Pack) Analysis by Processing Type, 2020 to 2035
  • Figure 80: Latin America Market Value Share (%) and BPS Analysis by Processing Type, 2025 to 2035
  • Figure 81: Latin America Market Y-o-Y Growth (%) Projections by Processing Type, 2025 to 2035
  • Figure 82: Latin America Market Value (USD Million) Analysis by Distribution Channel, 2020 to 2035
  • Figure 83: Latin America Market Volume (Unit Pack) Analysis by Distribution Channel, 2020 to 2035
  • Figure 84: Latin America Market Value Share (%) and BPS Analysis by Distribution Channel, 2025 to 2035
  • Figure 85: Latin America Market Y-o-Y Growth (%) Projections by Distribution Channel, 2025 to 2035
  • Figure 86: Latin America Market Attractiveness by Product Type, 2025 to 2035
  • Figure 87: Latin America Market Attractiveness by Source, 2025 to 2035
  • Figure 88: Latin America Market Attractiveness by Processing Type, 2025 to 2035
  • Figure 89: Latin America Market Attractiveness by Distribution Channel, 2025 to 2035
  • Figure 90: Latin America Market Attractiveness by Country, 2025 to 2035
  • Figure 91: Western Europe Market Value (USD Million) by Product Type, 2025 to 2035
  • Figure 92: Western Europe Market Value (USD Million) by Source, 2025 to 2035
  • Figure 93: Western Europe Market Value (USD Million) by Processing Type, 2025 to 2035
  • Figure 94: Western Europe Market Value (USD Million) by Distribution Channel, 2025 to 2035
  • Figure 95: Western Europe Market Value (USD Million) by Country, 2025 to 2035
  • Figure 96: Western Europe Market Value (USD Million) Analysis by Country, 2020 to 2035
  • Figure 97: Western Europe Market Volume (Unit Pack) Analysis by Country, 2020 to 2035
  • Figure 98: Western Europe Market Value Share (%) and BPS Analysis by Country, 2025 to 2035
  • Figure 99: Western Europe Market Y-o-Y Growth (%) Projections by Country, 2025 to 2035
  • Figure 100: Western Europe Market Value (USD Million) Analysis by Product Type, 2020 to 2035
  • Figure 101: Western Europe Market Volume (Unit Pack) Analysis by Product Type, 2020 to 2035
  • Figure 102: Western Europe Market Value Share (%) and BPS Analysis by Product Type, 2025 to 2035
  • Figure 103: Western Europe Market Y-o-Y Growth (%) Projections by Product Type, 2025 to 2035
  • Figure 104: Western Europe Market Value (USD Million) Analysis by Source, 2020 to 2035
  • Figure 105: Western Europe Market Volume (Unit Pack) Analysis by Source, 2020 to 2035
  • Figure 106: Western Europe Market Value Share (%) and BPS Analysis by Source, 2025 to 2035
  • Figure 107: Western Europe Market Y-o-Y Growth (%) Projections by Source, 2025 to 2035
  • Figure 108: Western Europe Market Value (USD Million) Analysis by Processing Type, 2020 to 2035
  • Figure 109: Western Europe Market Volume (Unit Pack) Analysis by Processing Type, 2020 to 2035
  • Figure 110: Western Europe Market Value Share (%) and BPS Analysis by Processing Type, 2025 to 2035
  • Figure 111: Western Europe Market Y-o-Y Growth (%) Projections by Processing Type, 2025 to 2035
  • Figure 112: Western Europe Market Value (USD Million) Analysis by Distribution Channel, 2020 to 2035
  • Figure 113: Western Europe Market Volume (Unit Pack) Analysis by Distribution Channel, 2020 to 2035
  • Figure 114: Western Europe Market Value Share (%) and BPS Analysis by Distribution Channel, 2025 to 2035
  • Figure 115: Western Europe Market Y-o-Y Growth (%) Projections by Distribution Channel, 2025 to 2035
  • Figure 116: Western Europe Market Attractiveness by Product Type, 2025 to 2035
  • Figure 117: Western Europe Market Attractiveness by Source, 2025 to 2035
  • Figure 118: Western Europe Market Attractiveness by Processing Type, 2025 to 2035
  • Figure 119: Western Europe Market Attractiveness by Distribution Channel, 2025 to 2035
  • Figure 120: Western Europe Market Attractiveness by Country, 2025 to 2035
  • Figure 121: Eastern Europe Market Value (USD Million) by Product Type, 2025 to 2035
  • Figure 122: Eastern Europe Market Value (USD Million) by Source, 2025 to 2035
  • Figure 123: Eastern Europe Market Value (USD Million) by Processing Type, 2025 to 2035
  • Figure 124: Eastern Europe Market Value (USD Million) by Distribution Channel, 2025 to 2035
  • Figure 125: Eastern Europe Market Value (USD Million) by Country, 2025 to 2035
  • Figure 126: Eastern Europe Market Value (USD Million) Analysis by Country, 2020 to 2035
  • Figure 127: Eastern Europe Market Volume (Unit Pack) Analysis by Country, 2020 to 2035
  • Figure 128: Eastern Europe Market Value Share (%) and BPS Analysis by Country, 2025 to 2035
  • Figure 129: Eastern Europe Market Y-o-Y Growth (%) Projections by Country, 2025 to 2035
  • Figure 130: Eastern Europe Market Value (USD Million) Analysis by Product Type, 2020 to 2035
  • Figure 131: Eastern Europe Market Volume (Unit Pack) Analysis by Product Type, 2020 to 2035
  • Figure 132: Eastern Europe Market Value Share (%) and BPS Analysis by Product Type, 2025 to 2035
  • Figure 133: Eastern Europe Market Y-o-Y Growth (%) Projections by Product Type, 2025 to 2035
  • Figure 134: Eastern Europe Market Value (USD Million) Analysis by Source, 2020 to 2035
  • Figure 135: Eastern Europe Market Volume (Unit Pack) Analysis by Source, 2020 to 2035
  • Figure 136: Eastern Europe Market Value Share (%) and BPS Analysis by Source, 2025 to 2035
  • Figure 137: Eastern Europe Market Y-o-Y Growth (%) Projections by Source, 2025 to 2035
  • Figure 138: Eastern Europe Market Value (USD Million) Analysis by Processing Type, 2020 to 2035
  • Figure 139: Eastern Europe Market Volume (Unit Pack) Analysis by Processing Type, 2020 to 2035
  • Figure 140: Eastern Europe Market Value Share (%) and BPS Analysis by Processing Type, 2025 to 2035
  • Figure 141: Eastern Europe Market Y-o-Y Growth (%) Projections by Processing Type, 2025 to 2035
  • Figure 142: Eastern Europe Market Value (USD Million) Analysis by Distribution Channel, 2020 to 2035
  • Figure 143: Eastern Europe Market Volume (Unit Pack) Analysis by Distribution Channel, 2020 to 2035
  • Figure 144: Eastern Europe Market Value Share (%) and BPS Analysis by Distribution Channel, 2025 to 2035
  • Figure 145: Eastern Europe Market Y-o-Y Growth (%) Projections by Distribution Channel, 2025 to 2035
  • Figure 146: Eastern Europe Market Attractiveness by Product Type, 2025 to 2035
  • Figure 147: Eastern Europe Market Attractiveness by Source, 2025 to 2035
  • Figure 148: Eastern Europe Market Attractiveness by Processing Type, 2025 to 2035
  • Figure 149: Eastern Europe Market Attractiveness by Distribution Channel, 2025 to 2035
  • Figure 150: Eastern Europe Market Attractiveness by Country, 2025 to 2035
  • Figure 151: South Asia and Pacific Market Value (USD Million) by Product Type, 2025 to 2035
  • Figure 152: South Asia and Pacific Market Value (USD Million) by Source, 2025 to 2035
  • Figure 153: South Asia and Pacific Market Value (USD Million) by Processing Type, 2025 to 2035
  • Figure 154: South Asia and Pacific Market Value (USD Million) by Distribution Channel, 2025 to 2035
  • Figure 155: South Asia and Pacific Market Value (USD Million) by Country, 2025 to 2035
  • Figure 156: South Asia and Pacific Market Value (USD Million) Analysis by Country, 2020 to 2035
  • Figure 157: South Asia and Pacific Market Volume (Unit Pack) Analysis by Country, 2020 to 2035
  • Figure 158: South Asia and Pacific Market Value Share (%) and BPS Analysis by Country, 2025 to 2035
  • Figure 159: South Asia and Pacific Market Y-o-Y Growth (%) Projections by Country, 2025 to 2035
  • Figure 160: South Asia and Pacific Market Value (USD Million) Analysis by Product Type, 2020 to 2035
  • Figure 161: South Asia and Pacific Market Volume (Unit Pack) Analysis by Product Type, 2020 to 2035
  • Figure 162: South Asia and Pacific Market Value Share (%) and BPS Analysis by Product Type, 2025 to 2035
  • Figure 163: South Asia and Pacific Market Y-o-Y Growth (%) Projections by Product Type, 2025 to 2035
  • Figure 164: South Asia and Pacific Market Value (USD Million) Analysis by Source, 2020 to 2035
  • Figure 165: South Asia and Pacific Market Volume (Unit Pack) Analysis by Source, 2020 to 2035
  • Figure 166: South Asia and Pacific Market Value Share (%) and BPS Analysis by Source, 2025 to 2035
  • Figure 167: South Asia and Pacific Market Y-o-Y Growth (%) Projections by Source, 2025 to 2035
  • Figure 168: South Asia and Pacific Market Value (USD Million) Analysis by Processing Type, 2020 to 2035
  • Figure 169: South Asia and Pacific Market Volume (Unit Pack) Analysis by Processing Type, 2020 to 2035
  • Figure 170: South Asia and Pacific Market Value Share (%) and BPS Analysis by Processing Type, 2025 to 2035
  • Figure 171: South Asia and Pacific Market Y-o-Y Growth (%) Projections by Processing Type, 2025 to 2035
  • Figure 172: South Asia and Pacific Market Value (USD Million) Analysis by Distribution Channel, 2020 to 2035
  • Figure 173: South Asia and Pacific Market Volume (Unit Pack) Analysis by Distribution Channel, 2020 to 2035
  • Figure 174: South Asia and Pacific Market Value Share (%) and BPS Analysis by Distribution Channel, 2025 to 2035
  • Figure 175: South Asia and Pacific Market Y-o-Y Growth (%) Projections by Distribution Channel, 2025 to 2035
  • Figure 176: South Asia and Pacific Market Attractiveness by Product Type, 2025 to 2035
  • Figure 177: South Asia and Pacific Market Attractiveness by Source, 2025 to 2035
  • Figure 178: South Asia and Pacific Market Attractiveness by Processing Type, 2025 to 2035
  • Figure 179: South Asia and Pacific Market Attractiveness by Distribution Channel, 2025 to 2035
  • Figure 180: South Asia and Pacific Market Attractiveness by Country, 2025 to 2035
  • Figure 181: East Asia Market Value (USD Million) by Product Type, 2025 to 2035
  • Figure 182: East Asia Market Value (USD Million) by Source, 2025 to 2035
  • Figure 183: East Asia Market Value (USD Million) by Processing Type, 2025 to 2035
  • Figure 184: East Asia Market Value (USD Million) by Distribution Channel, 2025 to 2035
  • Figure 185: East Asia Market Value (USD Million) by Country, 2025 to 2035
  • Figure 186: East Asia Market Value (USD Million) Analysis by Country, 2020 to 2035
  • Figure 187: East Asia Market Volume (Unit Pack) Analysis by Country, 2020 to 2035
  • Figure 188: East Asia Market Value Share (%) and BPS Analysis by Country, 2025 to 2035
  • Figure 189: East Asia Market Y-o-Y Growth (%) Projections by Country, 2025 to 2035
  • Figure 190: East Asia Market Value (USD Million) Analysis by Product Type, 2020 to 2035
  • Figure 191: East Asia Market Volume (Unit Pack) Analysis by Product Type, 2020 to 2035
  • Figure 192: East Asia Market Value Share (%) and BPS Analysis by Product Type, 2025 to 2035
  • Figure 193: East Asia Market Y-o-Y Growth (%) Projections by Product Type, 2025 to 2035
  • Figure 194: East Asia Market Value (USD Million) Analysis by Source, 2020 to 2035
  • Figure 195: East Asia Market Volume (Unit Pack) Analysis by Source, 2020 to 2035
  • Figure 196: East Asia Market Value Share (%) and BPS Analysis by Source, 2025 to 2035
  • Figure 197: East Asia Market Y-o-Y Growth (%) Projections by Source, 2025 to 2035
  • Figure 198: East Asia Market Value (USD Million) Analysis by Processing Type, 2020 to 2035
  • Figure 199: East Asia Market Volume (Unit Pack) Analysis by Processing Type, 2020 to 2035
  • Figure 200: East Asia Market Value Share (%) and BPS Analysis by Processing Type, 2025 to 2035
  • Figure 201: East Asia Market Y-o-Y Growth (%) Projections by Processing Type, 2025 to 2035
  • Figure 202: East Asia Market Value (USD Million) Analysis by Distribution Channel, 2020 to 2035
  • Figure 203: East Asia Market Volume (Unit Pack) Analysis by Distribution Channel, 2020 to 2035
  • Figure 204: East Asia Market Value Share (%) and BPS Analysis by Distribution Channel, 2025 to 2035
  • Figure 205: East Asia Market Y-o-Y Growth (%) Projections by Distribution Channel, 2025 to 2035
  • Figure 206: East Asia Market Attractiveness by Product Type, 2025 to 2035
  • Figure 207: East Asia Market Attractiveness by Source, 2025 to 2035
  • Figure 208: East Asia Market Attractiveness by Processing Type, 2025 to 2035
  • Figure 209: East Asia Market Attractiveness by Distribution Channel, 2025 to 2035
  • Figure 210: East Asia Market Attractiveness by Country, 2025 to 2035
  • Figure 211: Middle East and Africa Market Value (USD Million) by Product Type, 2025 to 2035
  • Figure 212: Middle East and Africa Market Value (USD Million) by Source, 2025 to 2035
  • Figure 213: Middle East and Africa Market Value (USD Million) by Processing Type, 2025 to 2035
  • Figure 214: Middle East and Africa Market Value (USD Million) by Distribution Channel, 2025 to 2035
  • Figure 215: Middle East and Africa Market Value (USD Million) by Country, 2025 to 2035
  • Figure 216: Middle East and Africa Market Value (USD Million) Analysis by Country, 2020 to 2035
  • Figure 217: Middle East and Africa Market Volume (Unit Pack) Analysis by Country, 2020 to 2035
  • Figure 218: Middle East and Africa Market Value Share (%) and BPS Analysis by Country, 2025 to 2035
  • Figure 219: Middle East and Africa Market Y-o-Y Growth (%) Projections by Country, 2025 to 2035
  • Figure 220: Middle East and Africa Market Value (USD Million) Analysis by Product Type, 2020 to 2035
  • Figure 221: Middle East and Africa Market Volume (Unit Pack) Analysis by Product Type, 2020 to 2035
  • Figure 222: Middle East and Africa Market Value Share (%) and BPS Analysis by Product Type, 2025 to 2035
  • Figure 223: Middle East and Africa Market Y-o-Y Growth (%) Projections by Product Type, 2025 to 2035
  • Figure 224: Middle East and Africa Market Value (USD Million) Analysis by Source, 2020 to 2035
  • Figure 225: Middle East and Africa Market Volume (Unit Pack) Analysis by Source, 2020 to 2035
  • Figure 226: Middle East and Africa Market Value Share (%) and BPS Analysis by Source, 2025 to 2035
  • Figure 227: Middle East and Africa Market Y-o-Y Growth (%) Projections by Source, 2025 to 2035
  • Figure 228: Middle East and Africa Market Value (USD Million) Analysis by Processing Type, 2020 to 2035
  • Figure 229: Middle East and Africa Market Volume (Unit Pack) Analysis by Processing Type, 2020 to 2035
  • Figure 230: Middle East and Africa Market Value Share (%) and BPS Analysis by Processing Type, 2025 to 2035
  • Figure 231: Middle East and Africa Market Y-o-Y Growth (%) Projections by Processing Type, 2025 to 2035
  • Figure 232: Middle East and Africa Market Value (USD Million) Analysis by Distribution Channel, 2020 to 2035
  • Figure 233: Middle East and Africa Market Volume (Unit Pack) Analysis by Distribution Channel, 2020 to 2035
  • Figure 234: Middle East and Africa Market Value Share (%) and BPS Analysis by Distribution Channel, 2025 to 2035
  • Figure 235: Middle East and Africa Market Y-o-Y Growth (%) Projections by Distribution Channel, 2025 to 2035
  • Figure 236: Middle East and Africa Market Attractiveness by Product Type, 2025 to 2035
  • Figure 237: Middle East and Africa Market Attractiveness by Source, 2025 to 2035
  • Figure 238: Middle East and Africa Market Attractiveness by Processing Type, 2025 to 2035
  • Figure 239: Middle East and Africa Market Attractiveness by Distribution Channel, 2025 to 2035
  • Figure 240: Middle East and Africa Market Attractiveness by Country, 2025 to 2035

Frequently Asked Questions

What is the projected size of the global tortilla market by 2035?

The industry is expected to reach USD 79.2 billion by 2035, up from USD 47.7 billion in 2025.

Which product type generates the highest revenue in the tortilla category?

Corn segment lead the industry with estimated sales of USD 21.4 billion in 2025, accounting for nearly 45% of total revenue.

What is the expected growth for flour tortillas between 2025 and 2035?

Flour segment are projected to grow from USD 10.8 billion in 2025 to USD 17.3 billion by 2035, registering a CAGR of 4.8%.

Which distribution channel is expected to grow fastest in the coming decade?

Online retail is forecasted to grow at a 5.6% CAGR, reaching USD 11.3 billion by 2035 from USD 6.5 billion in 2025.

Which countries are the top contributors to global tortilla sales?

The United States, Mexico, Spain, France, and the United Kingdom are the leading markets, contributing over 60% of total global sales in 2025.

Explore Similar Insights

Future Market Insights

Tortilla Market