The total aflatoxin test kit market is valued at USD 149.6 million in 2025 and is anticipated to reach USD 335.2 million by 2035, reflecting a CAGR of 8.4%. This steady growth trajectory reflects growing global concerns over food safety, rising regulatory standards, and increasing adoption of rapid and accurate aflatoxin detection methods. Over the forecast period, the market is expected to more than double, with sustained expansion driven by demand from the agriculture, food processing, and feed industries. The CAGR of 8.4% highlights a strong long-term growth outlook, supported by innovation in test kits, increasing automation, and expanding use in emerging markets.
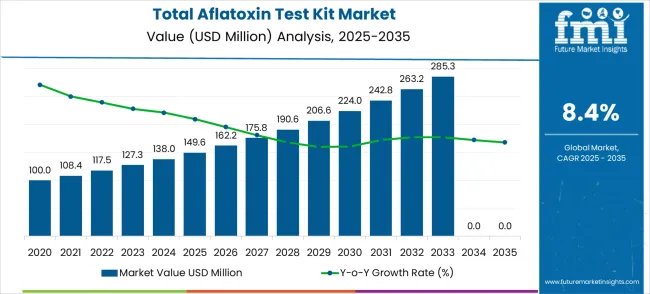
In the short term (2025–2027), the market grows from USD 149.6 million to USD 175.8 million, an increase of USD 26.2 million. This represents an average annual growth rate of approximately 8.4%, consistent with the overall forecasted CAGR. YoY growth in this period ranges between 8.4% and 8.5%, with the highest annual increment occurring in 2026, driven by greater implementation of aflatoxin detection solutions in large-scale food production and regulatory enforcement. This phase reflects stable growth supported by investments in testing infrastructure and rising awareness of aflatoxin-related health hazards.
| Metric | Value |
|---|---|
| Estimated Value in (2025E) | USD 149.6 million |
| Forecast Value in (2035F) | USD 335.2 million |
| Forecast CAGR (2025 to 2035) | 8.4% |
For long-term forecasting (2028–2035), combining CAGR with trend analysis suggests robust and constant growth. The market expands from USD 190.6 million in 2028 to USD 335.2 million in 2035, adding USD 144.6 million, which accounts for over 60% of the decade’s total growth. Annual growth rates in this phase remain consistent, with small fluctuations due to varying adoption rates in different regions. By 2031, growth momentum peaks slightly, driven by innovations in portable and multiplex aflatoxin test kits, increased demand in export-driven agricultural economies, and stricter food safety regulations globally.
Scenario analysis highlights the market’s sensitivity to regulatory changes, technological innovation, and regional adoption rates. In the optimistic scenario, adoption of advanced aflatoxin test kits and rapid regulatory enforcement could push the CAGR above 9%, leading to a market size exceeding USD 360 million by 2035. The base scenario aligns with the stated CAGR of 8.4%, resulting in USD 335.2 million by 2035. Slower regulatory progress and reduced adoption in developing regions could lower the CAGR to around 7.5%, bringing the market size closer to USD 310 million. The market exhibits a strong upward trajectory, driven by steady demand and innovative testing solutions.
Market expansion is being supported by increasingly stringent food safety regulations governing mycotoxin contamination and the corresponding demand for reliable testing solutions that can detect aflatoxin presence in food and feed products at regulatory limits. Modern food safety systems are increasingly focused on comprehensive mycotoxin monitoring that can ensure regulatory compliance while protecting consumer health and maintaining product quality. The proven capability of aflatoxin test kits to deliver accurate detection, quantitative results, and operational simplicity makes them essential tools for food and feed safety quality assurance programs.
The growing focus on preventive food safety management and supply chain transparency is driving demand for testing technologies that can support hazard analysis and critical control point systems while ensuring comprehensive contamination screening. Industry preference for testing solutions that can provide rapid results, integrate with existing quality systems, and support regulatory reporting requirements is creating opportunities for advanced test kit development. The rising influence of consumer awareness regarding food safety and mycotoxin risks is also contributing to increased adoption of comprehensive testing programs across different agricultural and food production sectors.
The market is segmented by classification, application, and region. By classification, the market is divided into ELISA kits, colloidal gold test kits, and others. Based on application, the market is categorized into food processing, feed industry, and others. Regionally, the market is divided into Asia Pacific, North America, Europe, Latin America, and Middle East & Africa.
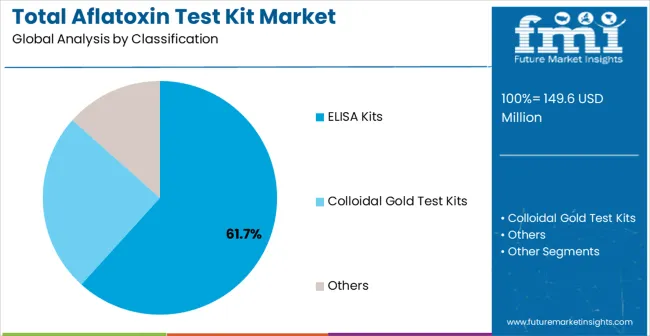
The ELISA kits classification is projected to account for 61.7% of the total aflatoxin test kit market in 2025, reaffirming its position as the category's dominant testing methodology. Laboratory professionals increasingly recognize the superior analytical performance and quantitative capabilities provided by enzyme-linked immunosorbent assay systems for accurate aflatoxin detection and measurement. This classification addresses the most demanding analytical requirements while providing essential sensitivity and specificity characteristics.
This classification forms the foundation of most regulatory testing programs and quality assurance laboratories, as it represents the most analytically robust and widely accepted approach for mycotoxin testing. Technology development and assay optimization continue to strengthen confidence in ELISA kit performance for regulatory compliance applications. With increasing recognition of the importance of quantitative results and analytical precision, ELISA systems align with both current regulatory requirements and laboratory quality objectives. Their comprehensive analytical capabilities across multiple sample types ensures steady market dominance, making them the central growth driver of aflatoxin test kit adoption.
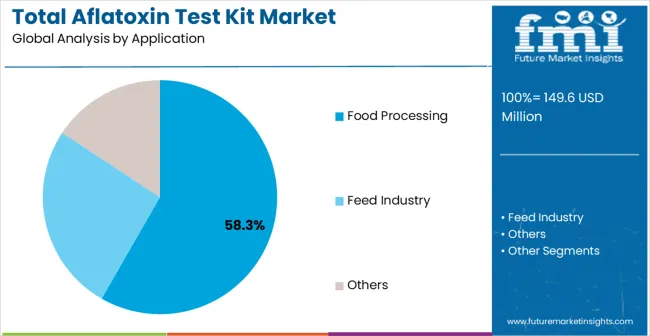
Food processing applications are projected to represent 58.3% of total aflatoxin test kit demand in 2025, highlighting their role as the primary application driving market development. Food processors and manufacturers recognize that mycotoxin testing requires the most reliable and comprehensive contamination monitoring to ensure consumer safety and regulatory compliance. Food processing applications demand exceptional accuracy and regulatory acceptance that aflatoxin test kits are uniquely positioned to deliver.
The segment is supported by the continuous tightening of food safety regulations requiring comprehensive mycotoxin monitoring and the increasing adoption of preventive food safety management systems across food manufacturing facilities. Food processing operations are increasingly implementing rapid testing technologies that can support both quality assurance and regulatory compliance objectives while maintaining production efficiency. As understanding of mycotoxin contamination risks advances, food processing applications will continue to serve as the primary commercial driver, reinforcing their essential position within the food safety testing market.
The market is advancing steadily due to increasing food safety regulations and growing awareness of mycotoxin health risks. The market faces challenges including complex regulatory requirements across different regions, competition from alternative testing methods, and varying detection limit requirements. Innovation in assay sensitivity enhancement and user experience improvement continue to influence product development and market expansion patterns.
The growing focus on agricultural supply chain transparency is creating enhanced opportunities for aflatoxin test kit integration with comprehensive traceability and quality management systems. Advanced supply chain monitoring requires reliable testing methods that can identify contamination at multiple points from farm to consumer. Traceability systems provide opportunities for integrated testing protocols that can support both quality assurance and risk management throughout agricultural value chains.
Modern biotechnology companies are incorporating digital connectivity, automated result recording, and quality management system integration to enhance aflatoxin test kit utility and operational efficiency. These technologies improve result traceability, enable automated compliance monitoring, and provide enhanced data analysis throughout testing operations. Advanced integration also enables optimized testing workflows and improved regulatory reporting capabilities.
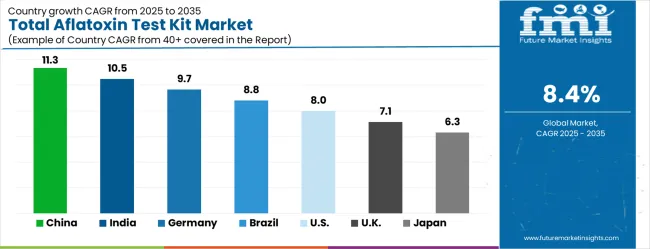
| Country | CAGR (2025-2035) |
|---|---|
| China | 11.3% |
| India | 10.5% |
| Germany | 9.7% |
| Brazil | 8.8% |
| USA | 8.0% |
| UK | 7.1% |
| Japan | 6.3% |
The market is experiencing robust growth globally, with China leading at an 11.3% CAGR through 2035, driven by expanding food safety regulatory framework, growing agricultural production, and increasing focus on mycotoxin monitoring in food and feed products. India follows at 10.5%, supported by growing food processing industry, increasing export quality requirements, and expanding awareness of aflatoxin contamination risks. Germany shows growth at 9.7%, focusing food safety excellence and comprehensive mycotoxin monitoring systems. Brazil records 8.8% growth, focusing on expanding agricultural exports and growing adoption of food safety testing programs. The USA shows 8.0% growth, representing steady demand from established food safety systems and regulatory compliance programs.
The report covers an in-depth analysis of 40+ countries; top-performing countries are highlighted below.
China is projected to grow at a CAGR of 11.3% between 2025 and 2035, driven by rising food safety regulations and demand for advanced detection systems in the agricultural and food processing sectors. Total aflatoxin test kits are becoming critical for ensuring quality in cereals, nuts, spices, and animal feed products. Increasing exports of agricultural produce to markets with strict aflatoxin limits are boosting demand. Chinese manufacturers are investing heavily in developing rapid, portable, and highly accurate test kits that combine immunoassay and biosensor technology. Government-backed food safety programs are accelerating adoption across the domestic food industry. These trends, combined with rising consumer awareness about food safety and contamination, make China one of the fastest-growing markets globally for aflatoxin testing solutions.
India is expected to record a CAGR of 10.5% from 2025 to 2035, driven by rising awareness of food contamination risks and stricter food safety regulations. Aflatoxin contamination in grains, oilseeds, and spices is a critical concern, which is increasing adoption of advanced test kits. Demand is supported by growth in food processing industries, especially exports of processed foods that require certification for aflatoxin levels. Government programs promoting agricultural quality and food safety further encourage adoption. Local manufacturers are focusing on cost-effective, field-deployable kits that offer fast results without sacrificing accuracy. Rising interest in quality assurance in the supply chain is also fueling growth. This makes India one of the fastest-growing markets for aflatoxin test kits globally.
Germany is forecasted to grow at a CAGR of 9.7% from 2025 to 2035, supported by high standards for food safety and rigorous EU regulations. Total aflatoxin test kits are in high demand in grains, dairy, nuts, and feed industries to ensure compliance and consumer safety. Germany’s strong research infrastructure encourages development of high-sensitivity, rapid test kits that deliver accurate results within shorter timeframes. Adoption is fueled by a growing export sector for processed foods requiring stringent contamination control. Manufacturers focus on integrating digital solutions and automation into testing systems to boost efficiency. This combination of quality, technology, and regulation ensures Germany remains a significant player in aflatoxin testing innovation.
Brazil is projected to grow at a CAGR of 8.8% between 2025 and 2035, driven by the need to comply with stringent safety regulations and maintain export competitiveness. Aflatoxin contamination in cereals, oilseeds, and feed products poses significant risks, which makes testing vital. Growth in agricultural production and exports is creating steady demand for reliable and fast aflatoxin test kits. Brazil’s strong agricultural base allows scaling of testing facilities and adoption of portable solutions for on-site verification. Collaboration with international suppliers is enhancing technology access. Local manufacturers are also improving kit performance for quicker detection and reporting, meeting both domestic and international market needs.
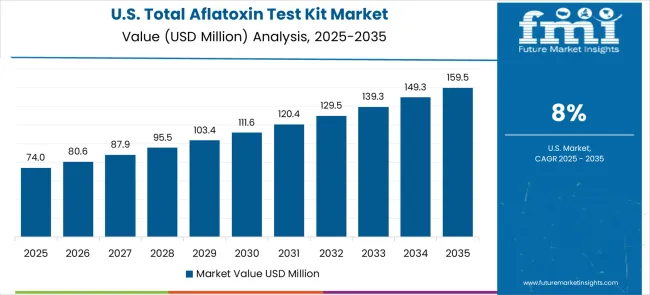
The United States is forecasted to expand at a CAGR of 8.0% between 2025 and 2035, driven by regulatory frameworks and a strong focus on food safety and contamination control. Aflatoxin test kits are essential for protecting cereals, nuts, dairy products, and animal feed from contamination that affects health and marketability. Growing exports of agricultural products to stringent markets drive demand for certified testing methods. USA manufacturers are investing in portable kits and high-throughput laboratory systems for rapid detection. Government programs supporting food safety infrastructure further fuel adoption. Innovations in biosensor and immunoassay technologies improve test speed and accuracy, making the USA a key adopter of advanced aflatoxin testing solutions.
The United Kingdom is projected to expand at a CAGR of 7.1% from 2025 to 2035, driven by high food safety standards and demand for rapid contamination detection. Total aflatoxin test kits are becoming critical for grains, nuts, dairy, and processed food products to meet export requirements and ensure quality. Growth in organic and high-value food production strengthens demand for on-site testing solutions. Manufacturers are investing in developing portable kits with faster turnaround times without sacrificing accuracy. Government policies and industry initiatives further encourage adoption. Rising exports and stricter safety compliance create constant opportunities for growth in the UK aflatoxin test kit market.
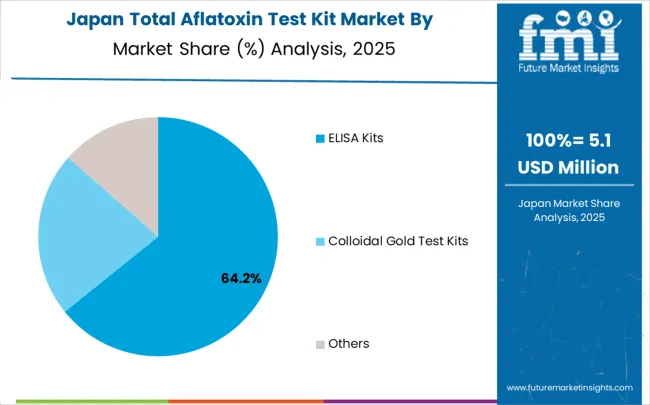
Japan is expected to grow at a CAGR of 6.3% from 2025 to 2035, supported by strong government oversight and a focus on food safety and quality. Aflatoxin test kits are essential in ensuring compliance with safety standards for cereals, nuts, animal feed, and processed foods. Japan’s advanced manufacturing and analytical capabilities support development of high-precision kits. Growing export demand and stringent domestic regulations encourage adoption of both portable and laboratory-based solutions. Government initiatives promoting quality control in agriculture and food supply chains enhance testing infrastructure. Japanese manufacturers focus on innovative technologies to improve sensitivity, speed, and ease of use, making Japan a steady but important market for aflatoxin testing solutions.
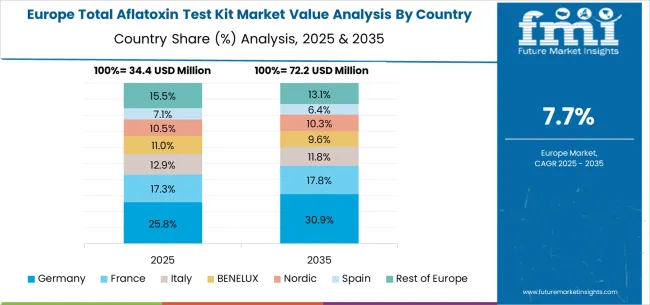
The total aflatoxin test kit market in Europe is projected to expand steadily through 2035, supported by established food safety regulations, comprehensive agricultural quality requirements, and ongoing innovation in analytical technologies. Germany will continue to lead the regional market, accounting for 29.8% in 2025 and rising to 30.6% by 2035, supported by strong food safety technology capabilities, advanced testing infrastructure, and comprehensive regulatory compliance frameworks. The United Kingdom follows with 18.4% in 2025, increasing to 18.7% by 2035, driven by food safety innovation initiatives, government support for testing technologies, and expanding quality assurance requirements.
France holds 16.7% in 2025, edging up to 17.0% by 2035 as food producers expand testing capabilities and demand grows for comprehensive mycotoxin monitoring solutions. Italy contributes 12.6% in 2025, remaining stable at 12.8% by 2035, supported by food industry strength and growing adoption of advanced testing technologies. Spain represents 9.2% in 2025, moving upward to 9.4% by 2035, underpinned by expanding agricultural production and increasing investment in food safety testing systems.
Nordic countries together account for 8.9% in 2025, maintaining their position at 9.0% by 2035, supported by advanced food safety initiatives and early adoption of innovative testing solutions. The Rest of Europe represents 4.4% in 2025, declining slightly to 2.5% by 2035, as larger markets capture greater investment focus and established food safety infrastructure advantages.
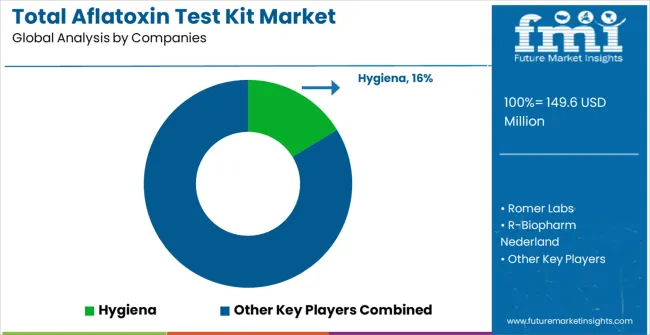
The market is characterized by competition among specialized biotechnology companies, established analytical testing providers, and innovative diagnostic technology manufacturers. Companies are investing in assay sensitivity enhancement, user experience improvement, strategic partnerships, and regulatory compliance to deliver high-performance, reliable, and cost-effective aflatoxin testing solutions. Technology development, quality assurance, and customer support strategies are central to strengthening competitive advantages and market presence.
Hygiena leads the market with significant expertise in food safety testing technologies, offering comprehensive aflatoxin test kit solutions with focus on rapid testing and ease of use. Romer Labs provides established mycotoxin testing capabilities with focus on analytical performance and regulatory compliance. R-Biopharm Nederland focuses on comprehensive food safety solutions with advanced immunoassay technologies. PerkinElmer delivers established analytical instrumentation and testing solutions with comprehensive laboratory capabilities.
Danaher operates with focus on life sciences and diagnostics with comprehensive testing portfolios. Merck provides established analytical capabilities with focus on laboratory reagents and testing systems. Abbexa, Gold Standard Diagnostics, Kassel, Olink Group, MyBioSource, ProGnosis Biotech, CheongMyung Science, Beijing Kwinbon Technology, Beijing Biolab, Shandong Meizheng Bio-Technology, Shanghai Fusheng Industrial, and Shanghai Yaji Biotechnology provide diverse technological approaches and regional market access strategies to enhance overall market development and testing capability advancement.
| Items | Values |
|---|---|
| Quantitative Units (2025) | USD 149.6 million |
| Classification | ELISA Kits, Colloidal Gold Test Kits, Others |
| Application | Food Processing, Feed Industry, Others |
| Regions Covered | Asia Pacific, North America, Europe, Latin America, Middle East & Africa |
| Countries Covered | China, India, Germany, Brazil, United States, United Kingdom, Japan and 40+ countries |
| Key Companies Profiled | Hygiena, Romer Labs, R-Biopharm Nederland, PerkinElmer, Danaher, Merck, Abbexa, Gold Standard Diagnostics, Kassel, Olink Group, MyBioSource, ProGnosis Biotech, CheongMyung Science, Beijing Kwinbon Technology, Beijing Biolab, Shandong Meizheng Bio-Technology, Shanghai Fusheng Industrial, Shanghai Yaji Biotechnology |
| Additional Attributes | Dollar sales by kit type and application, regional adoption trends, competitive landscape, regulatory compliance partnerships, integration with quality management systems, innovations in assay sensitivity and user experience, analytical performance analysis, and testing workflow optimization strategies |
The global total aflatoxin test kit market is estimated to be valued at USD 149.6 million in 2025.
The market size for the total aflatoxin test kit market is projected to reach USD 335.2 million by 2035.
The total aflatoxin test kit market is expected to grow at a 8.4% CAGR between 2025 and 2035.
The key product types in total aflatoxin test kit market are elisa kits, colloidal gold test kits and others.
In terms of application, food processing segment to command 58.3% share in the total aflatoxin test kit market in 2025.


Our Research Products

The "Full Research Suite" delivers actionable market intel, deep dives on markets or technologies, so clients act faster, cut risk, and unlock growth.

The Leaderboard benchmarks and ranks top vendors, classifying them as Established Leaders, Leading Challengers, or Disruptors & Challengers.

Locates where complements amplify value and substitutes erode it, forecasting net impact by horizon

We deliver granular, decision-grade intel: market sizing, 5-year forecasts, pricing, adoption, usage, revenue, and operational KPIs—plus competitor tracking, regulation, and value chains—across 60 countries broadly.

Spot the shifts before they hit your P&L. We track inflection points, adoption curves, pricing moves, and ecosystem plays to show where demand is heading, why it is changing, and what to do next across high-growth markets and disruptive tech

Real-time reads of user behavior. We track shifting priorities, perceptions of today’s and next-gen services, and provider experience, then pace how fast tech moves from trial to adoption, blending buyer, consumer, and channel inputs with social signals (#WhySwitch, #UX).

Partner with our analyst team to build a custom report designed around your business priorities. From analysing market trends to assessing competitors or crafting bespoke datasets, we tailor insights to your needs.
Supplier Intelligence
Discovery & Profiling
Capacity & Footprint
Performance & Risk
Compliance & Governance
Commercial Readiness
Who Supplies Whom
Scorecards & Shortlists
Playbooks & Docs
Category Intelligence
Definition & Scope
Demand & Use Cases
Cost Drivers
Market Structure
Supply Chain Map
Trade & Policy
Operating Norms
Deliverables
Buyer Intelligence
Account Basics
Spend & Scope
Procurement Model
Vendor Requirements
Terms & Policies
Entry Strategy
Pain Points & Triggers
Outputs
Pricing Analysis
Benchmarks
Trends
Should-Cost
Indexation
Landed Cost
Commercial Terms
Deliverables
Brand Analysis
Positioning & Value Prop
Share & Presence
Customer Evidence
Go-to-Market
Digital & Reputation
Compliance & Trust
KPIs & Gaps
Outputs
Full Research Suite comprises of:
Market outlook & trends analysis
Interviews & case studies
Strategic recommendations
Vendor profiles & capabilities analysis
5-year forecasts
8 regions and 60+ country-level data splits
Market segment data splits
12 months of continuous data updates
DELIVERED AS:
PDF EXCEL ONLINE
Soil Testing Kit Market Growth - Trends & Forecast 2025 to 2035
Water Testing Kit Market Analysis by Product, Test Type, Water Type, End User, and Region - Analysis for 2025 to 2035
Fungal Testing Kits Market Analysis – Size, Trends & Forecast 2025 to 2035
Ovulation Test Kit Market Analysis – Growth & Industry Trends 2024-2034
Cortisol Testing Kits Market Size and Share Forecast Outlook 2025 to 2035
Oxytocin Testing Kits Market Analysis - Size, Share, and Forecast Outlook 2025 to 2035
Global Bowie-Dick Test Kit Market Analysis – Size, Share & Forecast 2024-2034
Rapid RNA Testing Kits Market Trends- Growth & Forecast 2025 to 2035
HIV/HBV/HCV Test Kits Market Trends and Forecast 2025 to 2035
Irrigation testing kit Market
Streptomycin Test Kit Market Size and Share Forecast Outlook 2025 to 2035
Nucleic Acid Test Kits for Pets Market Size and Share Forecast Outlook 2025 to 2035
Lab Screening Test Kit Market
Chloramphenicol Test Kits Market Size and Share Forecast Outlook 2025 to 2035
Fluoroquinolone Test Kit Market Size and Share Forecast Outlook 2025 to 2035
Self-sampling HPV Test Kits Market Analysis - Size, Share, and Forecast Outlook 2025 to 2035
Demand for Water Testing Kit in Japan Size and Share Forecast Outlook 2025 to 2035
Lab Confirmation Testing Kit Market
At-Home Vaginal pH Test Kit Market Size and Share Forecast Outlook 2025 to 2035
Veterinary Pregnancy Test Kit Market Forecast and Outlook 2025 to 2035

Thank you!
You will receive an email from our Business Development Manager. Please be sure to check your SPAM/JUNK folder too.
Chat With
MaRIA