Underwater Modems Market Size and Share Forecast Outlook 2025 to 2035

The Underwater Modems Market is estimated to be valued at USD 783.3 million in 2025 and is projected to reach USD 1644.7 million by 2035, registering a compound annual growth rate (CAGR) of 7.7% over the forecast period.
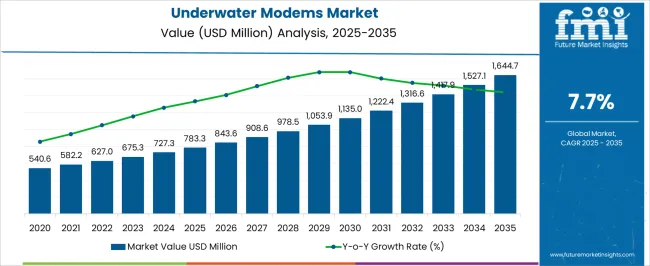
Quick Stats for Underwater Modems Market

  • Underwater Modems Market Value (2025): USD 783.3 million
  • Underwater Modems Market Forecast Value (2035): USD 1644.7 million
  • Underwater Modems Market Forecast CAGR: 7.7%
  • Leading Segment in Underwater Modems Market in 2025: Pipeline Monitoring Systems (21.5%)
  • Key Growth Regions in Underwater Modems Market: North America, Asia-Pacific, Europe
  • Top Key Players in Underwater Modems Market: EvoLogics, IXBlue, KONGSBERG, L3Harris, LinkQuest, Ocean Infinity, Popoto Modem, Sonardyne, Teledyne, Water Linked

Underwater Modems Market Market Value Analysis

Underwater Modems Market Key Takeaways

Metric Value
Underwater Modems Market Estimated Value in (2025 E) USD 783.3 million
Underwater Modems Market Forecast Value in (2035 F) USD 1644.7 million
Forecast CAGR (2025 to 2035) 7.7%

Why is the Underwater Modems Market Growing?

The Underwater Modems market is witnessing steady growth, driven by increasing demand for reliable underwater communication systems across sectors such as oil and gas, defense, environmental monitoring, and marine research. The adoption of underwater modems is being fueled by the need for real-time data transmission in challenging subsea environments, where conventional communication technologies are ineffective. Technological advancements, including low-power modulation, robust signal processing, and improved acoustic transceivers, are enhancing the reliability and efficiency of underwater communication systems.

The market is further supported by increasing offshore exploration activities, growing investments in subsea pipeline monitoring, and expanding applications in autonomous underwater vehicles and environmental sensing. Integration with networked monitoring platforms and remote operation systems is improving operational efficiency and decision-making.

Regulatory emphasis on maritime safety and environmental monitoring is further propelling demand As industries increasingly adopt automated and intelligent subsea systems, the Underwater Modems market is expected to experience sustained growth, with innovations in range, material durability, and signal integrity driving future adoption.

Segmental Analysis

The underwater modems market is segmented by application, range, material type, frequency band, end use industry, and geographic regions. By application, underwater modems market is divided into Pipeline Monitoring Systems, Environmental Monitoring System, Oceanographic Instrumentation, Corrosion Monitoring, Seismic Wave Monitoring, Autonomous Underwater Vehicle Communication, Diving, and Aquaculture. In terms of range, underwater modems market is classified into Short Range (1000M), Mid Range (2000M), and Long Range (6000M). Based on material type, underwater modems market is segmented into Aluminum Alloy, Stainless Steel, and Titanium. By frequency band, underwater modems market is segmented into 9-14 KHz, 16-21 KHz, and 25-20 KHz. By end use industry, underwater modems market is segmented into Oil And Gas Industry, Construction Industry, and Defense Industry. Regionally, the underwater modems industry is classified into North America, Latin America, Western Europe, Eastern Europe, Balkan & Baltic Countries, Russia & Belarus, Central Asia, East Asia, South Asia & Pacific, and the Middle East & Africa.
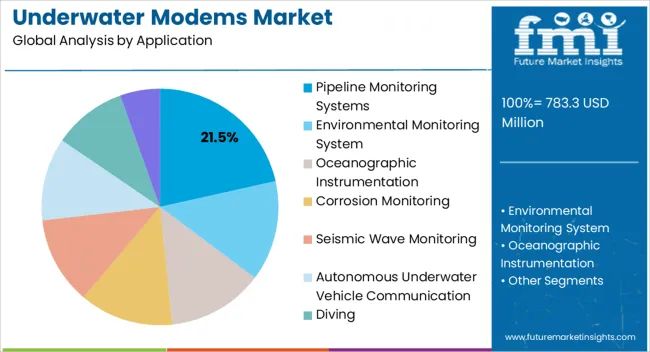
Insights into the Pipeline Monitoring Systems Application Segment

Underwater Modems Market Analysis By Application

The pipeline monitoring systems application segment is projected to hold 21.5% of the market revenue in 2025, establishing it as the leading application area. Its growth is being driven by the increasing requirement for real-time monitoring of subsea pipelines, ensuring safety, integrity, and leak detection. Underwater modems enable continuous transmission of critical data, allowing operators to respond quickly to potential faults and maintain regulatory compliance.

The ability to integrate modems with automated control systems and remote monitoring platforms reduces operational downtime and enhances efficiency. Technological advancements in acoustic communication, error correction, and energy-efficient designs have further improved reliability, making pipeline monitoring a primary use case.

Investments by energy companies and regulatory mandates for safe and environmentally responsible pipeline operations are reinforcing the segment’s adoption As the offshore oil and gas industry expands, and the demand for automated and connected subsea systems grows, the pipeline monitoring systems segment is expected to maintain its leading position, supported by innovations in data transmission and system integration.
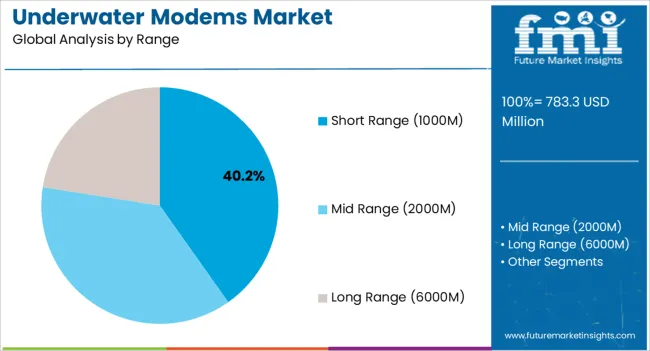
Insights into the Short Range (1000M) Range Segment

Underwater Modems Market Analysis By Range

The short range (1000M) segment is expected to account for 40.2% of the market revenue in 2025, making it the leading range category. Its prominence is being driven by applications that require reliable communication over moderate distances, such as subsea monitoring, scientific research, and underwater vehicle coordination. Short-range modems provide low-latency, energy-efficient communication that is suitable for dense network deployments where longer-range systems may face interference or higher power consumption.

Advancements in signal processing, acoustic transducers, and data compression have enhanced the effectiveness of short-range underwater communication. Organizations are increasingly adopting these systems due to their cost-effectiveness, ease of deployment, and integration capability with existing underwater infrastructure.

The segment’s growth is also supported by expanding applications in autonomous underwater vehicles, subsea robotics, and environmental sensing As the need for precise, real-time underwater data continues to rise, the short-range category is expected to maintain its market leadership, supported by innovations that enhance reliability, efficiency, and operational flexibility.
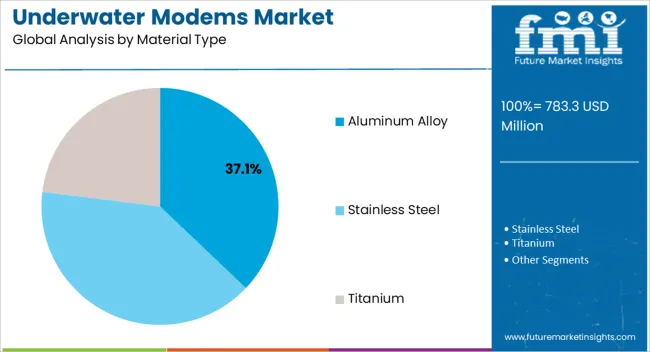
Insights into the Aluminum Alloy Material Type Segment

Underwater Modems Market Analysis By Material Type

The aluminum alloy material type segment is projected to hold 37.1% of the market revenue in 2025, establishing it as the leading material category. Its adoption is driven by the need for lightweight, corrosion-resistant, and mechanically robust housing for underwater modems. Aluminum alloys provide excellent structural integrity while reducing overall device weight, facilitating easier deployment and handling in subsea environments.

The material’s durability under high-pressure and saline conditions ensures long operational lifespans, reducing maintenance and replacement costs. Compatibility with advanced coating and sealing techniques enhances protection against corrosion, biofouling, and wear. The segment is further supported by applications in pipeline monitoring, underwater exploration, and marine research, where reliable performance is critical.

As industries increasingly prioritize equipment longevity, safety, and operational efficiency, aluminum alloy remains the preferred material choice for underwater modem construction Its combination of strength, durability, and cost-effectiveness continues to reinforce its leading position in the market.

Market Overview

Underwater Modems Market Overview

Underwater modems are used to transmit data wirelessly through water. With the introduction of underwater modems, users can now communicate, navigate and monitor under water. The use of technologies like Wi-Fi and GPS, beneath the water surface, has been made possible by the introduction of underwater modems.

These are also known as acoustic modems. Underwater acoustic communication has low data rates due to the acoustic waves used for transmission rather than the electromagnetic waves. Underwater modems are used in a variety of applications for data gathering and monitoring for marine applications.

Different modems are installed based on specific requirements like short-term deployment, long-term deployment and corrosion resistance. The use of underwater modems by the defense industry for communication between submarines is expected to drive the global underwater modem market.

Incre’asing investments made in research and development and data monitoring underwater, surveys and environmental studies has led to further growth in the underwater modems market. Moreover, underwater modems are also used for autonomous under vehicle communication. The market for underwater modems is expected to increase at a moderate CAGR over the forecast period.
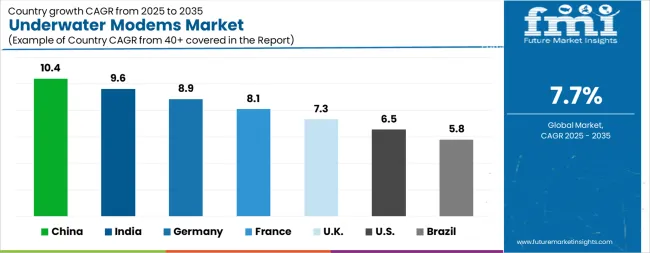
Analysis of Underwater Modems Market By Key Countries

Underwater Modems Market Cagr Analysis By Country

Country CAGR
China 10.4%
India 9.6%
Germany 8.9%
France 8.1%
UK 7.3%
USA 6.5%
Brazil 5.8%

Country-wise Analysis

The Underwater Modems Market is expected to register a CAGR of 7.7% during the forecast period, exhibiting varied country level momentum. China leads with the highest CAGR of 10.4%, followed by India at 9.6%. Developed markets such as Germany, France, and the UK continue to expand steadily, while the USA is likely to grow at consistent rates. Brazil posts the lowest CAGR at 5.8%, yet still underscores a broadly positive trajectory for the global Underwater Modems Market. In 2024, Germany held a dominant revenue in the Western Europe market and is expected to grow with a CAGR of 8.9%. The USA Underwater Modems Market is estimated to be valued at USD 296.5 million in 2025 and is anticipated to reach a valuation of USD 558.9 million by 2035. Sales are projected to rise at a CAGR of 6.5% over the forecast period between 2025 and 2035. While Japan and South Korea markets are estimated to be valued at USD 38.7 million and USD 19.7 million respectively in 2025.
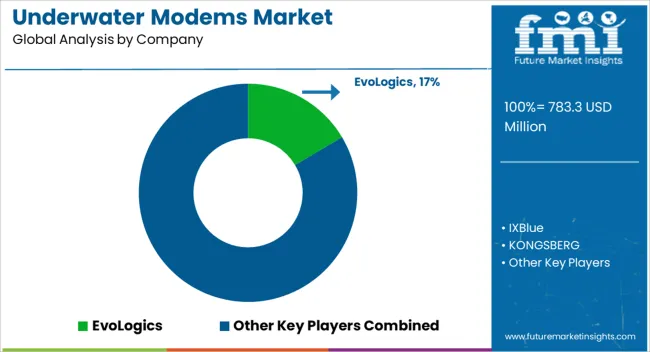
Key Players in the Underwater Modems Market

Underwater Modems Market Analysis By Company

  • EvoLogics
  • IXBlue
  • KONGSBERG
  • L3Harris
  • LinkQuest
  • Ocean Infinity
  • Popoto Modem
  • Sonardyne
  • Teledyne
  • Water Linked

Scope of the Report

Item Value
Quantitative Units USD 783.3 Million
Application Pipeline Monitoring Systems, Environmental Monitoring System, Oceanographic Instrumentation, Corrosion Monitoring, Seismic Wave Monitoring, Autonomous Underwater Vehicle Communication, Diving, and Aquaculture
Range Short Range (1000M), Mid Range (2000M), and Long Range (6000M)
Material Type Aluminum Alloy, Stainless Steel, and Titanium
Frequency Band 9-14 KHz, 16-21 KHz, and 25-20 KHz
End Use Industry Oil And Gas Industry, Construction Industry, and Defense Industry
Regions Covered North America, Europe, Asia-Pacific, Latin America, Middle East & Africa
Country Covered United States, Canada, Germany, France, United Kingdom, China, Japan, India, Brazil, South Africa
Key Companies Profiled EvoLogics, IXBlue, KONGSBERG, L3Harris, LinkQuest, Ocean Infinity, Popoto Modem, Sonardyne, Teledyne, and Water Linked

Underwater Modems Market by Segments

Application:

  • Pipeline Monitoring Systems
  • Environmental Monitoring System
  • Oceanographic Instrumentation
  • Corrosion Monitoring
  • Seismic Wave Monitoring
  • Autonomous Underwater Vehicle Communication
  • Diving
  • Aquaculture

Range:

  • Short Range (1000M)
  • Mid Range (2000M)
  • Long Range (6000M)

Material Type:

  • Aluminum Alloy
  • Stainless Steel
  • Titanium

Frequency Band:

  • 9-14 KHz
  • 16-21 KHz
  • 25-20 KHz

End Use Industry:

  • Oil And Gas Industry
  • Construction Industry
  • Defense Industry

Region:

  • North America
    • USA
    • Canada
    • Mexico
  • Latin America
    • Brazil
    • Chile
    • Rest of Latin America
  • Western Europe
    • Germany
    • UK
    • Italy
    • Spain
    • France
    • Nordic
    • BENELUX
    • Rest of Western Europe
  • Eastern Europe
    • Russia
    • Poland
    • Hungary
    • Balkan & Baltic
    • Rest of Eastern Europe
  • East Asia
    • China
    • Japan
    • South Korea
  • South Asia and Pacific
    • India
    • ASEAN
    • Australia & New Zealand
    • Rest of South Asia and Pacific
  • Middle East & Africa
    • Kingdom of Saudi Arabia
    • Other GCC Countries
    • Turkiye
    • South Africa
    • Other African Union
    • Rest of Middle East & Africa

Table of Content

  1. Executive Summary
    • Global Market Outlook
    • Demand-side Trends
    • Supply-side Trends
    • Technology Roadmap Analysis
    • Analysis and Recommendations
  2. Market Overview
    • Market Coverage / Taxonomy
    • Market Definition / Scope / Limitations
  3. Market Background
    • Market Dynamics
      • Drivers
      • Restraints
      • Opportunity
      • Trends
    • Scenario Forecast
      • Demand in Optimistic Scenario
      • Demand in Likely Scenario
      • Demand in Conservative Scenario
    • Opportunity Map Analysis
    • Product Life Cycle Analysis
    • Supply Chain Analysis
    • Investment Feasibility Matrix
    • Value Chain Analysis
    • PESTLE and Porter’s Analysis
    • Regulatory Landscape
    • Regional Parent Market Outlook
    • Production and Consumption Statistics
    • Import and Export Statistics
  4. Global Market Analysis 2020 to 2024 and Forecast, 2025 to 2035
    • Historical Market Size Value (USD Million) Analysis, 2020 to 2024
    • Current and Future Market Size Value (USD Million) Projections, 2025 to 2035
      • Y-o-Y Growth Trend Analysis
      • Absolute $ Opportunity Analysis
  5. Global Market Pricing Analysis 2020 to 2024 and Forecast 2025 to 2035
  6. Global Market Analysis 2020 to 2024 and Forecast 2025 to 2035, By Application
    • Introduction / Key Findings
    • Historical Market Size Value (USD Million) Analysis By Application , 2020 to 2024
    • Current and Future Market Size Value (USD Million) Analysis and Forecast By Application , 2025 to 2035
      • Pipeline Monitoring Systems
      • Environmental Monitoring System
      • Oceanographic Instrumentation
      • Corrosion Monitoring
      • Seismic Wave Monitoring
      • Autonomous Underwater Vehicle Communication
      • Diving
      • Aquaculture
    • Y-o-Y Growth Trend Analysis By Application , 2020 to 2024
    • Absolute $ Opportunity Analysis By Application , 2025 to 2035
  7. Global Market Analysis 2020 to 2024 and Forecast 2025 to 2035, By Range
    • Introduction / Key Findings
    • Historical Market Size Value (USD Million) Analysis By Range, 2020 to 2024
    • Current and Future Market Size Value (USD Million) Analysis and Forecast By Range, 2025 to 2035
      • Short Range (1000M)
      • Mid Range (2000M)
      • Long Range (6000M)
    • Y-o-Y Growth Trend Analysis By Range, 2020 to 2024
    • Absolute $ Opportunity Analysis By Range, 2025 to 2035
  8. Global Market Analysis 2020 to 2024 and Forecast 2025 to 2035, By Material Type
    • Introduction / Key Findings
    • Historical Market Size Value (USD Million) Analysis By Material Type, 2020 to 2024
    • Current and Future Market Size Value (USD Million) Analysis and Forecast By Material Type, 2025 to 2035
      • Aluminum Alloy
      • Stainless Steel
      • Titanium
    • Y-o-Y Growth Trend Analysis By Material Type, 2020 to 2024
    • Absolute $ Opportunity Analysis By Material Type, 2025 to 2035
  9. Global Market Analysis 2020 to 2024 and Forecast 2025 to 2035, By Frequency Band
    • Introduction / Key Findings
    • Historical Market Size Value (USD Million) Analysis By Frequency Band, 2020 to 2024
    • Current and Future Market Size Value (USD Million) Analysis and Forecast By Frequency Band, 2025 to 2035
      • 9-14 KHz
      • 16-21 KHz
      • 25-20 KHz
    • Y-o-Y Growth Trend Analysis By Frequency Band, 2020 to 2024
    • Absolute $ Opportunity Analysis By Frequency Band, 2025 to 2035
  10. Global Market Analysis 2020 to 2024 and Forecast 2025 to 2035, By End Use Industry
    • Introduction / Key Findings
    • Historical Market Size Value (USD Million) Analysis By End Use Industry, 2020 to 2024
    • Current and Future Market Size Value (USD Million) Analysis and Forecast By End Use Industry, 2025 to 2035
      • Oil And Gas Industry
      • Construction Industry
      • Defense Industry
    • Y-o-Y Growth Trend Analysis By End Use Industry, 2020 to 2024
    • Absolute $ Opportunity Analysis By End Use Industry, 2025 to 2035
  11. Global Market Analysis 2020 to 2024 and Forecast 2025 to 2035, By Region
    • Introduction
    • Historical Market Size Value (USD Million) Analysis By Region, 2020 to 2024
    • Current Market Size Value (USD Million) Analysis and Forecast By Region, 2025 to 2035
      • North America
      • Latin America
      • Western Europe
      • Eastern Europe
      • East Asia
      • South Asia and Pacific
      • Middle East & Africa
    • Market Attractiveness Analysis By Region
  12. North America Market Analysis 2020 to 2024 and Forecast 2025 to 2035, By Country
    • Historical Market Size Value (USD Million) Trend Analysis By Market Taxonomy, 2020 to 2024
    • Market Size Value (USD Million) Forecast By Market Taxonomy, 2025 to 2035
      • By Country
        • USA
        • Canada
        • Mexico
      • By Application
      • By Range
      • By Material Type
      • By Frequency Band
      • By End Use Industry
    • Market Attractiveness Analysis
      • By Country
      • By Application
      • By Range
      • By Material Type
      • By Frequency Band
      • By End Use Industry
    • Key Takeaways
  13. Latin America Market Analysis 2020 to 2024 and Forecast 2025 to 2035, By Country
    • Historical Market Size Value (USD Million) Trend Analysis By Market Taxonomy, 2020 to 2024
    • Market Size Value (USD Million) Forecast By Market Taxonomy, 2025 to 2035
      • By Country
        • Brazil
        • Chile
        • Rest of Latin America
      • By Application
      • By Range
      • By Material Type
      • By Frequency Band
      • By End Use Industry
    • Market Attractiveness Analysis
      • By Country
      • By Application
      • By Range
      • By Material Type
      • By Frequency Band
      • By End Use Industry
    • Key Takeaways
  14. Western Europe Market Analysis 2020 to 2024 and Forecast 2025 to 2035, By Country
    • Historical Market Size Value (USD Million) Trend Analysis By Market Taxonomy, 2020 to 2024
    • Market Size Value (USD Million) Forecast By Market Taxonomy, 2025 to 2035
      • By Country
        • Germany
        • UK
        • Italy
        • Spain
        • France
        • Nordic
        • BENELUX
        • Rest of Western Europe
      • By Application
      • By Range
      • By Material Type
      • By Frequency Band
      • By End Use Industry
    • Market Attractiveness Analysis
      • By Country
      • By Application
      • By Range
      • By Material Type
      • By Frequency Band
      • By End Use Industry
    • Key Takeaways
  15. Eastern Europe Market Analysis 2020 to 2024 and Forecast 2025 to 2035, By Country
    • Historical Market Size Value (USD Million) Trend Analysis By Market Taxonomy, 2020 to 2024
    • Market Size Value (USD Million) Forecast By Market Taxonomy, 2025 to 2035
      • By Country
        • Russia
        • Poland
        • Hungary
        • Balkan & Baltic
        • Rest of Eastern Europe
      • By Application
      • By Range
      • By Material Type
      • By Frequency Band
      • By End Use Industry
    • Market Attractiveness Analysis
      • By Country
      • By Application
      • By Range
      • By Material Type
      • By Frequency Band
      • By End Use Industry
    • Key Takeaways
  16. East Asia Market Analysis 2020 to 2024 and Forecast 2025 to 2035, By Country
    • Historical Market Size Value (USD Million) Trend Analysis By Market Taxonomy, 2020 to 2024
    • Market Size Value (USD Million) Forecast By Market Taxonomy, 2025 to 2035
      • By Country
        • China
        • Japan
        • South Korea
      • By Application
      • By Range
      • By Material Type
      • By Frequency Band
      • By End Use Industry
    • Market Attractiveness Analysis
      • By Country
      • By Application
      • By Range
      • By Material Type
      • By Frequency Band
      • By End Use Industry
    • Key Takeaways
  17. South Asia and Pacific Market Analysis 2020 to 2024 and Forecast 2025 to 2035, By Country
    • Historical Market Size Value (USD Million) Trend Analysis By Market Taxonomy, 2020 to 2024
    • Market Size Value (USD Million) Forecast By Market Taxonomy, 2025 to 2035
      • By Country
        • India
        • ASEAN
        • Australia & New Zealand
        • Rest of South Asia and Pacific
      • By Application
      • By Range
      • By Material Type
      • By Frequency Band
      • By End Use Industry
    • Market Attractiveness Analysis
      • By Country
      • By Application
      • By Range
      • By Material Type
      • By Frequency Band
      • By End Use Industry
    • Key Takeaways
  18. Middle East & Africa Market Analysis 2020 to 2024 and Forecast 2025 to 2035, By Country
    • Historical Market Size Value (USD Million) Trend Analysis By Market Taxonomy, 2020 to 2024
    • Market Size Value (USD Million) Forecast By Market Taxonomy, 2025 to 2035
      • By Country
        • Kingdom of Saudi Arabia
        • Other GCC Countries
        • Turkiye
        • South Africa
        • Other African Union
        • Rest of Middle East & Africa
      • By Application
      • By Range
      • By Material Type
      • By Frequency Band
      • By End Use Industry
    • Market Attractiveness Analysis
      • By Country
      • By Application
      • By Range
      • By Material Type
      • By Frequency Band
      • By End Use Industry
    • Key Takeaways
  19. Key Countries Market Analysis
    • USA
      • Pricing Analysis
      • Market Share Analysis, 2024
        • By Application
        • By Range
        • By Material Type
        • By Frequency Band
        • By End Use Industry
    • Canada
      • Pricing Analysis
      • Market Share Analysis, 2024
        • By Application
        • By Range
        • By Material Type
        • By Frequency Band
        • By End Use Industry
    • Mexico
      • Pricing Analysis
      • Market Share Analysis, 2024
        • By Application
        • By Range
        • By Material Type
        • By Frequency Band
        • By End Use Industry
    • Brazil
      • Pricing Analysis
      • Market Share Analysis, 2024
        • By Application
        • By Range
        • By Material Type
        • By Frequency Band
        • By End Use Industry
    • Chile
      • Pricing Analysis
      • Market Share Analysis, 2024
        • By Application
        • By Range
        • By Material Type
        • By Frequency Band
        • By End Use Industry
    • Germany
      • Pricing Analysis
      • Market Share Analysis, 2024
        • By Application
        • By Range
        • By Material Type
        • By Frequency Band
        • By End Use Industry
    • UK
      • Pricing Analysis
      • Market Share Analysis, 2024
        • By Application
        • By Range
        • By Material Type
        • By Frequency Band
        • By End Use Industry
    • Italy
      • Pricing Analysis
      • Market Share Analysis, 2024
        • By Application
        • By Range
        • By Material Type
        • By Frequency Band
        • By End Use Industry
    • Spain
      • Pricing Analysis
      • Market Share Analysis, 2024
        • By Application
        • By Range
        • By Material Type
        • By Frequency Band
        • By End Use Industry
    • France
      • Pricing Analysis
      • Market Share Analysis, 2024
        • By Application
        • By Range
        • By Material Type
        • By Frequency Band
        • By End Use Industry
    • India
      • Pricing Analysis
      • Market Share Analysis, 2024
        • By Application
        • By Range
        • By Material Type
        • By Frequency Band
        • By End Use Industry
    • ASEAN
      • Pricing Analysis
      • Market Share Analysis, 2024
        • By Application
        • By Range
        • By Material Type
        • By Frequency Band
        • By End Use Industry
    • Australia & New Zealand
      • Pricing Analysis
      • Market Share Analysis, 2024
        • By Application
        • By Range
        • By Material Type
        • By Frequency Band
        • By End Use Industry
    • China
      • Pricing Analysis
      • Market Share Analysis, 2024
        • By Application
        • By Range
        • By Material Type
        • By Frequency Band
        • By End Use Industry
    • Japan
      • Pricing Analysis
      • Market Share Analysis, 2024
        • By Application
        • By Range
        • By Material Type
        • By Frequency Band
        • By End Use Industry
    • South Korea
      • Pricing Analysis
      • Market Share Analysis, 2024
        • By Application
        • By Range
        • By Material Type
        • By Frequency Band
        • By End Use Industry
    • Russia
      • Pricing Analysis
      • Market Share Analysis, 2024
        • By Application
        • By Range
        • By Material Type
        • By Frequency Band
        • By End Use Industry
    • Poland
      • Pricing Analysis
      • Market Share Analysis, 2024
        • By Application
        • By Range
        • By Material Type
        • By Frequency Band
        • By End Use Industry
    • Hungary
      • Pricing Analysis
      • Market Share Analysis, 2024
        • By Application
        • By Range
        • By Material Type
        • By Frequency Band
        • By End Use Industry
    • Kingdom of Saudi Arabia
      • Pricing Analysis
      • Market Share Analysis, 2024
        • By Application
        • By Range
        • By Material Type
        • By Frequency Band
        • By End Use Industry
    • Turkiye
      • Pricing Analysis
      • Market Share Analysis, 2024
        • By Application
        • By Range
        • By Material Type
        • By Frequency Band
        • By End Use Industry
    • South Africa
      • Pricing Analysis
      • Market Share Analysis, 2024
        • By Application
        • By Range
        • By Material Type
        • By Frequency Band
        • By End Use Industry
  20. Market Structure Analysis
    • Competition Dashboard
    • Competition Benchmarking
    • Market Share Analysis of Top Players
      • By Regional
      • By Application
      • By Range
      • By Material Type
      • By Frequency Band
      • By End Use Industry
  21. Competition Analysis
    • Competition Deep Dive
      • EvoLogics
        • Overview
        • Product Portfolio
        • Profitability by Market Segments (Product/Age /Sales Channel/Region)
        • Sales Footprint
        • Strategy Overview
          • Marketing Strategy
          • Product Strategy
          • Channel Strategy
      • IXBlue
      • KONGSBERG
      • L3Harris
      • LinkQuest
      • Ocean Infinity
      • Popoto Modem
      • Sonardyne
      • Teledyne
      • Water Linked
  22. Assumptions & Acronyms Used
  23. Research Methodology

List of Tables

  • Table 1: Global Market Value (USD Million) Forecast by Region, 2020 to 2035
  • Table 2: Global Market Value (USD Million) Forecast by Application , 2020 to 2035
  • Table 3: Global Market Value (USD Million) Forecast by Range, 2020 to 2035
  • Table 4: Global Market Value (USD Million) Forecast by Material Type, 2020 to 2035
  • Table 5: Global Market Value (USD Million) Forecast by Frequency Band, 2020 to 2035
  • Table 6: Global Market Value (USD Million) Forecast by End Use Industry, 2020 to 2035
  • Table 7: North America Market Value (USD Million) Forecast by Country, 2020 to 2035
  • Table 8: North America Market Value (USD Million) Forecast by Application , 2020 to 2035
  • Table 9: North America Market Value (USD Million) Forecast by Range, 2020 to 2035
  • Table 10: North America Market Value (USD Million) Forecast by Material Type, 2020 to 2035
  • Table 11: North America Market Value (USD Million) Forecast by Frequency Band, 2020 to 2035
  • Table 12: North America Market Value (USD Million) Forecast by End Use Industry, 2020 to 2035
  • Table 13: Latin America Market Value (USD Million) Forecast by Country, 2020 to 2035
  • Table 14: Latin America Market Value (USD Million) Forecast by Application , 2020 to 2035
  • Table 15: Latin America Market Value (USD Million) Forecast by Range, 2020 to 2035
  • Table 16: Latin America Market Value (USD Million) Forecast by Material Type, 2020 to 2035
  • Table 17: Latin America Market Value (USD Million) Forecast by Frequency Band, 2020 to 2035
  • Table 18: Latin America Market Value (USD Million) Forecast by End Use Industry, 2020 to 2035
  • Table 19: Western Europe Market Value (USD Million) Forecast by Country, 2020 to 2035
  • Table 20: Western Europe Market Value (USD Million) Forecast by Application , 2020 to 2035
  • Table 21: Western Europe Market Value (USD Million) Forecast by Range, 2020 to 2035
  • Table 22: Western Europe Market Value (USD Million) Forecast by Material Type, 2020 to 2035
  • Table 23: Western Europe Market Value (USD Million) Forecast by Frequency Band, 2020 to 2035
  • Table 24: Western Europe Market Value (USD Million) Forecast by End Use Industry, 2020 to 2035
  • Table 25: Eastern Europe Market Value (USD Million) Forecast by Country, 2020 to 2035
  • Table 26: Eastern Europe Market Value (USD Million) Forecast by Application , 2020 to 2035
  • Table 27: Eastern Europe Market Value (USD Million) Forecast by Range, 2020 to 2035
  • Table 28: Eastern Europe Market Value (USD Million) Forecast by Material Type, 2020 to 2035
  • Table 29: Eastern Europe Market Value (USD Million) Forecast by Frequency Band, 2020 to 2035
  • Table 30: Eastern Europe Market Value (USD Million) Forecast by End Use Industry, 2020 to 2035
  • Table 31: East Asia Market Value (USD Million) Forecast by Country, 2020 to 2035
  • Table 32: East Asia Market Value (USD Million) Forecast by Application , 2020 to 2035
  • Table 33: East Asia Market Value (USD Million) Forecast by Range, 2020 to 2035
  • Table 34: East Asia Market Value (USD Million) Forecast by Material Type, 2020 to 2035
  • Table 35: East Asia Market Value (USD Million) Forecast by Frequency Band, 2020 to 2035
  • Table 36: East Asia Market Value (USD Million) Forecast by End Use Industry, 2020 to 2035
  • Table 37: South Asia and Pacific Market Value (USD Million) Forecast by Country, 2020 to 2035
  • Table 38: South Asia and Pacific Market Value (USD Million) Forecast by Application , 2020 to 2035
  • Table 39: South Asia and Pacific Market Value (USD Million) Forecast by Range, 2020 to 2035
  • Table 40: South Asia and Pacific Market Value (USD Million) Forecast by Material Type, 2020 to 2035
  • Table 41: South Asia and Pacific Market Value (USD Million) Forecast by Frequency Band, 2020 to 2035
  • Table 42: South Asia and Pacific Market Value (USD Million) Forecast by End Use Industry, 2020 to 2035
  • Table 43: Middle East & Africa Market Value (USD Million) Forecast by Country, 2020 to 2035
  • Table 44: Middle East & Africa Market Value (USD Million) Forecast by Application , 2020 to 2035
  • Table 45: Middle East & Africa Market Value (USD Million) Forecast by Range, 2020 to 2035
  • Table 46: Middle East & Africa Market Value (USD Million) Forecast by Material Type, 2020 to 2035
  • Table 47: Middle East & Africa Market Value (USD Million) Forecast by Frequency Band, 2020 to 2035
  • Table 48: Middle East & Africa Market Value (USD Million) Forecast by End Use Industry, 2020 to 2035

List of Figures

  • Figure 1: Global Market Pricing Analysis
  • Figure 2: Global Market Value (USD Million) Forecast 2020 to 2035
  • Figure 3: Global Market Value Share and BPS Analysis by Application , 2025 and 2035
  • Figure 4: Global Market Y-o-Y Growth Comparison by Application , 2025 to 2035
  • Figure 5: Global Market Attractiveness Analysis by Application
  • Figure 6: Global Market Value Share and BPS Analysis by Range, 2025 and 2035
  • Figure 7: Global Market Y-o-Y Growth Comparison by Range, 2025 to 2035
  • Figure 8: Global Market Attractiveness Analysis by Range
  • Figure 9: Global Market Value Share and BPS Analysis by Material Type, 2025 and 2035
  • Figure 10: Global Market Y-o-Y Growth Comparison by Material Type, 2025 to 2035
  • Figure 11: Global Market Attractiveness Analysis by Material Type
  • Figure 12: Global Market Value Share and BPS Analysis by Frequency Band, 2025 and 2035
  • Figure 13: Global Market Y-o-Y Growth Comparison by Frequency Band, 2025 to 2035
  • Figure 14: Global Market Attractiveness Analysis by Frequency Band
  • Figure 15: Global Market Value Share and BPS Analysis by End Use Industry, 2025 and 2035
  • Figure 16: Global Market Y-o-Y Growth Comparison by End Use Industry, 2025 to 2035
  • Figure 17: Global Market Attractiveness Analysis by End Use Industry
  • Figure 18: Global Market Value (USD Million) Share and BPS Analysis by Region, 2025 and 2035
  • Figure 19: Global Market Y-o-Y Growth Comparison by Region, 2025 to 2035
  • Figure 20: Global Market Attractiveness Analysis by Region
  • Figure 21: North America Market Incremental Dollar Opportunity, 2025 to 2035
  • Figure 22: Latin America Market Incremental Dollar Opportunity, 2025 to 2035
  • Figure 23: Western Europe Market Incremental Dollar Opportunity, 2025 to 2035
  • Figure 24: Eastern Europe Market Incremental Dollar Opportunity, 2025 to 2035
  • Figure 25: East Asia Market Incremental Dollar Opportunity, 2025 to 2035
  • Figure 26: South Asia and Pacific Market Incremental Dollar Opportunity, 2025 to 2035
  • Figure 27: Middle East & Africa Market Incremental Dollar Opportunity, 2025 to 2035
  • Figure 28: North America Market Value Share and BPS Analysis by Country, 2025 and 2035
  • Figure 29: North America Market Value Share and BPS Analysis by Application , 2025 and 2035
  • Figure 30: North America Market Y-o-Y Growth Comparison by Application , 2025 to 2035
  • Figure 31: North America Market Attractiveness Analysis by Application
  • Figure 32: North America Market Value Share and BPS Analysis by Range, 2025 and 2035
  • Figure 33: North America Market Y-o-Y Growth Comparison by Range, 2025 to 2035
  • Figure 34: North America Market Attractiveness Analysis by Range
  • Figure 35: North America Market Value Share and BPS Analysis by Material Type, 2025 and 2035
  • Figure 36: North America Market Y-o-Y Growth Comparison by Material Type, 2025 to 2035
  • Figure 37: North America Market Attractiveness Analysis by Material Type
  • Figure 38: North America Market Value Share and BPS Analysis by Frequency Band, 2025 and 2035
  • Figure 39: North America Market Y-o-Y Growth Comparison by Frequency Band, 2025 to 2035
  • Figure 40: North America Market Attractiveness Analysis by Frequency Band
  • Figure 41: North America Market Value Share and BPS Analysis by End Use Industry, 2025 and 2035
  • Figure 42: North America Market Y-o-Y Growth Comparison by End Use Industry, 2025 to 2035
  • Figure 43: North America Market Attractiveness Analysis by End Use Industry
  • Figure 44: Latin America Market Value Share and BPS Analysis by Country, 2025 and 2035
  • Figure 45: Latin America Market Value Share and BPS Analysis by Application , 2025 and 2035
  • Figure 46: Latin America Market Y-o-Y Growth Comparison by Application , 2025 to 2035
  • Figure 47: Latin America Market Attractiveness Analysis by Application
  • Figure 48: Latin America Market Value Share and BPS Analysis by Range, 2025 and 2035
  • Figure 49: Latin America Market Y-o-Y Growth Comparison by Range, 2025 to 2035
  • Figure 50: Latin America Market Attractiveness Analysis by Range
  • Figure 51: Latin America Market Value Share and BPS Analysis by Material Type, 2025 and 2035
  • Figure 52: Latin America Market Y-o-Y Growth Comparison by Material Type, 2025 to 2035
  • Figure 53: Latin America Market Attractiveness Analysis by Material Type
  • Figure 54: Latin America Market Value Share and BPS Analysis by Frequency Band, 2025 and 2035
  • Figure 55: Latin America Market Y-o-Y Growth Comparison by Frequency Band, 2025 to 2035
  • Figure 56: Latin America Market Attractiveness Analysis by Frequency Band
  • Figure 57: Latin America Market Value Share and BPS Analysis by End Use Industry, 2025 and 2035
  • Figure 58: Latin America Market Y-o-Y Growth Comparison by End Use Industry, 2025 to 2035
  • Figure 59: Latin America Market Attractiveness Analysis by End Use Industry
  • Figure 60: Western Europe Market Value Share and BPS Analysis by Country, 2025 and 2035
  • Figure 61: Western Europe Market Value Share and BPS Analysis by Application , 2025 and 2035
  • Figure 62: Western Europe Market Y-o-Y Growth Comparison by Application , 2025 to 2035
  • Figure 63: Western Europe Market Attractiveness Analysis by Application
  • Figure 64: Western Europe Market Value Share and BPS Analysis by Range, 2025 and 2035
  • Figure 65: Western Europe Market Y-o-Y Growth Comparison by Range, 2025 to 2035
  • Figure 66: Western Europe Market Attractiveness Analysis by Range
  • Figure 67: Western Europe Market Value Share and BPS Analysis by Material Type, 2025 and 2035
  • Figure 68: Western Europe Market Y-o-Y Growth Comparison by Material Type, 2025 to 2035
  • Figure 69: Western Europe Market Attractiveness Analysis by Material Type
  • Figure 70: Western Europe Market Value Share and BPS Analysis by Frequency Band, 2025 and 2035
  • Figure 71: Western Europe Market Y-o-Y Growth Comparison by Frequency Band, 2025 to 2035
  • Figure 72: Western Europe Market Attractiveness Analysis by Frequency Band
  • Figure 73: Western Europe Market Value Share and BPS Analysis by End Use Industry, 2025 and 2035
  • Figure 74: Western Europe Market Y-o-Y Growth Comparison by End Use Industry, 2025 to 2035
  • Figure 75: Western Europe Market Attractiveness Analysis by End Use Industry
  • Figure 76: Eastern Europe Market Value Share and BPS Analysis by Country, 2025 and 2035
  • Figure 77: Eastern Europe Market Value Share and BPS Analysis by Application , 2025 and 2035
  • Figure 78: Eastern Europe Market Y-o-Y Growth Comparison by Application , 2025 to 2035
  • Figure 79: Eastern Europe Market Attractiveness Analysis by Application
  • Figure 80: Eastern Europe Market Value Share and BPS Analysis by Range, 2025 and 2035
  • Figure 81: Eastern Europe Market Y-o-Y Growth Comparison by Range, 2025 to 2035
  • Figure 82: Eastern Europe Market Attractiveness Analysis by Range
  • Figure 83: Eastern Europe Market Value Share and BPS Analysis by Material Type, 2025 and 2035
  • Figure 84: Eastern Europe Market Y-o-Y Growth Comparison by Material Type, 2025 to 2035
  • Figure 85: Eastern Europe Market Attractiveness Analysis by Material Type
  • Figure 86: Eastern Europe Market Value Share and BPS Analysis by Frequency Band, 2025 and 2035
  • Figure 87: Eastern Europe Market Y-o-Y Growth Comparison by Frequency Band, 2025 to 2035
  • Figure 88: Eastern Europe Market Attractiveness Analysis by Frequency Band
  • Figure 89: Eastern Europe Market Value Share and BPS Analysis by End Use Industry, 2025 and 2035
  • Figure 90: Eastern Europe Market Y-o-Y Growth Comparison by End Use Industry, 2025 to 2035
  • Figure 91: Eastern Europe Market Attractiveness Analysis by End Use Industry
  • Figure 92: East Asia Market Value Share and BPS Analysis by Country, 2025 and 2035
  • Figure 93: East Asia Market Value Share and BPS Analysis by Application , 2025 and 2035
  • Figure 94: East Asia Market Y-o-Y Growth Comparison by Application , 2025 to 2035
  • Figure 95: East Asia Market Attractiveness Analysis by Application
  • Figure 96: East Asia Market Value Share and BPS Analysis by Range, 2025 and 2035
  • Figure 97: East Asia Market Y-o-Y Growth Comparison by Range, 2025 to 2035
  • Figure 98: East Asia Market Attractiveness Analysis by Range
  • Figure 99: East Asia Market Value Share and BPS Analysis by Material Type, 2025 and 2035
  • Figure 100: East Asia Market Y-o-Y Growth Comparison by Material Type, 2025 to 2035
  • Figure 101: East Asia Market Attractiveness Analysis by Material Type
  • Figure 102: East Asia Market Value Share and BPS Analysis by Frequency Band, 2025 and 2035
  • Figure 103: East Asia Market Y-o-Y Growth Comparison by Frequency Band, 2025 to 2035
  • Figure 104: East Asia Market Attractiveness Analysis by Frequency Band
  • Figure 105: East Asia Market Value Share and BPS Analysis by End Use Industry, 2025 and 2035
  • Figure 106: East Asia Market Y-o-Y Growth Comparison by End Use Industry, 2025 to 2035
  • Figure 107: East Asia Market Attractiveness Analysis by End Use Industry
  • Figure 108: South Asia and Pacific Market Value Share and BPS Analysis by Country, 2025 and 2035
  • Figure 109: South Asia and Pacific Market Value Share and BPS Analysis by Application , 2025 and 2035
  • Figure 110: South Asia and Pacific Market Y-o-Y Growth Comparison by Application , 2025 to 2035
  • Figure 111: South Asia and Pacific Market Attractiveness Analysis by Application
  • Figure 112: South Asia and Pacific Market Value Share and BPS Analysis by Range, 2025 and 2035
  • Figure 113: South Asia and Pacific Market Y-o-Y Growth Comparison by Range, 2025 to 2035
  • Figure 114: South Asia and Pacific Market Attractiveness Analysis by Range
  • Figure 115: South Asia and Pacific Market Value Share and BPS Analysis by Material Type, 2025 and 2035
  • Figure 116: South Asia and Pacific Market Y-o-Y Growth Comparison by Material Type, 2025 to 2035
  • Figure 117: South Asia and Pacific Market Attractiveness Analysis by Material Type
  • Figure 118: South Asia and Pacific Market Value Share and BPS Analysis by Frequency Band, 2025 and 2035
  • Figure 119: South Asia and Pacific Market Y-o-Y Growth Comparison by Frequency Band, 2025 to 2035
  • Figure 120: South Asia and Pacific Market Attractiveness Analysis by Frequency Band
  • Figure 121: South Asia and Pacific Market Value Share and BPS Analysis by End Use Industry, 2025 and 2035
  • Figure 122: South Asia and Pacific Market Y-o-Y Growth Comparison by End Use Industry, 2025 to 2035
  • Figure 123: South Asia and Pacific Market Attractiveness Analysis by End Use Industry
  • Figure 124: Middle East & Africa Market Value Share and BPS Analysis by Country, 2025 and 2035
  • Figure 125: Middle East & Africa Market Value Share and BPS Analysis by Application , 2025 and 2035
  • Figure 126: Middle East & Africa Market Y-o-Y Growth Comparison by Application , 2025 to 2035
  • Figure 127: Middle East & Africa Market Attractiveness Analysis by Application
  • Figure 128: Middle East & Africa Market Value Share and BPS Analysis by Range, 2025 and 2035
  • Figure 129: Middle East & Africa Market Y-o-Y Growth Comparison by Range, 2025 to 2035
  • Figure 130: Middle East & Africa Market Attractiveness Analysis by Range
  • Figure 131: Middle East & Africa Market Value Share and BPS Analysis by Material Type, 2025 and 2035
  • Figure 132: Middle East & Africa Market Y-o-Y Growth Comparison by Material Type, 2025 to 2035
  • Figure 133: Middle East & Africa Market Attractiveness Analysis by Material Type
  • Figure 134: Middle East & Africa Market Value Share and BPS Analysis by Frequency Band, 2025 and 2035
  • Figure 135: Middle East & Africa Market Y-o-Y Growth Comparison by Frequency Band, 2025 to 2035
  • Figure 136: Middle East & Africa Market Attractiveness Analysis by Frequency Band
  • Figure 137: Middle East & Africa Market Value Share and BPS Analysis by End Use Industry, 2025 and 2035
  • Figure 138: Middle East & Africa Market Y-o-Y Growth Comparison by End Use Industry, 2025 to 2035
  • Figure 139: Middle East & Africa Market Attractiveness Analysis by End Use Industry
  • Figure 140: Global Market – Tier Structure Analysis
  • Figure 141: Global Market – Company Share Analysis

Frequently Asked Questions

How big is the underwater modems market in 2025?

The global underwater modems market is estimated to be valued at USD 783.3 million in 2025.

What will be the size of underwater modems market in 2035?

The market size for the underwater modems market is projected to reach USD 1,644.7 million by 2035.

How much will be the underwater modems market growth between 2025 and 2035?

The underwater modems market is expected to grow at a 7.7% CAGR between 2025 and 2035.

What are the key product types in the underwater modems market?

The key product types in underwater modems market are pipeline monitoring systems, environmental monitoring system, oceanographic instrumentation, corrosion monitoring, seismic wave monitoring, autonomous underwater vehicle communication, diving and aquaculture.

Which range segment to contribute significant share in the underwater modems market in 2025?

In terms of range, short range (1000m) segment to command 40.2% share in the underwater modems market in 2025.

Explore Similar Insights

Future Market Insights

Underwater Modems Market

Chat With MaRIA

Chat With

MaRIA

Hi There, I am MaRIA, Your Market Research Intelligence Assistant. How may I help you?