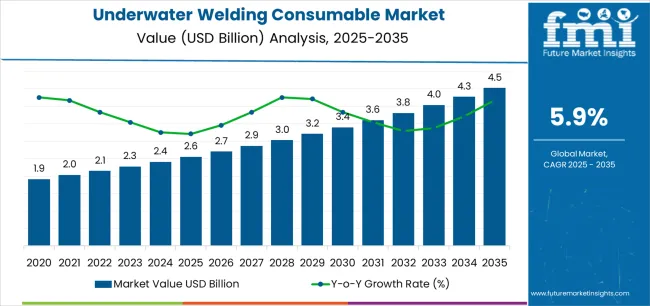
The Underwater Welding Consumable Market is estimated to be valued at USD 2.6 billion in 2025 and is projected to reach USD 4.5 billion by 2035, registering a compound annual growth rate (CAGR) of 5.9% over the forecast period.
The underwater welding consumable market is experiencing steady growth driven by increasing offshore infrastructure development, rising demand for underwater maintenance, and the expansion of oil and gas exploration activities. Current market conditions are shaped by growing investments in marine construction and ship repair operations, which require reliable consumables capable of performing under extreme conditions. Technological advancements in welding materials and coating compositions are improving performance, corrosion resistance, and deposition efficiency.
The future outlook is supported by continuous development of underwater fabrication techniques and enhanced safety standards, which are promoting broader adoption. Growth rationale is based on the consistent requirement for robust underwater joining solutions in both shallow and deep-water applications.
Ongoing innovation in consumable formulations and electrode design is strengthening durability and operational reliability Increasing global focus on renewable marine energy structures and underwater pipelines is expected to sustain long-term demand, ensuring the market remains on a stable expansion trajectory through the forecast period.
| Metric | Value |
|---|---|
| Underwater Welding Consumable Market Estimated Value in (2025 E) | USD 2.6 billion |
| Underwater Welding Consumable Market Forecast Value in (2035 F) | USD 4.5 billion |
| Forecast CAGR (2025 to 2035) | 5.9% |
The market is segmented by Product Type, Welding Technique, and End-Use and region. By Product Type, the market is divided into Electrodes, Wires, Fluxes, Welding Stinger, and Others. In terms of Welding Technique, the market is classified into Wet Welding and Dry Welding. Based on End-Use, the market is segmented into Oil And Gas Industry, Marine Infrastructure, Ship Repair And Maintenance, Offshore Renewable Energy, and Others. Regionally, the market is classified into North America, Latin America, Western Europe, Eastern Europe, Balkan & Baltic Countries, Russia & Belarus, Central Asia, East Asia, South Asia & Pacific, and the Middle East & Africa.
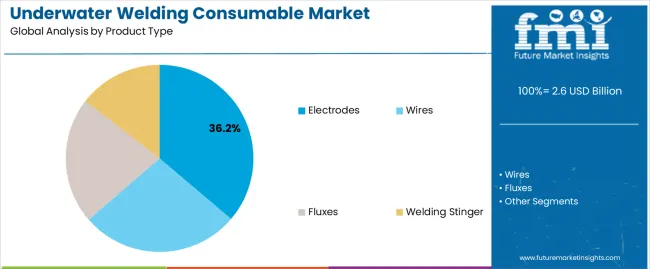
The electrodes segment, accounting for 36.20% of the product type category, has emerged as the leading segment due to its high adaptability, ease of application, and cost-effectiveness in underwater environments. Demand is being driven by its reliability in providing consistent weld quality despite challenging underwater conditions.
The segment benefits from extensive availability, simple handling procedures, and compatibility with a wide range of base materials. Advancements in flux coating technology are enhancing arc stability and reducing hydrogen-induced cracking, leading to improved weld integrity.
The segment’s dominance is further reinforced by continuous R&D efforts aimed at developing electrodes with enhanced waterproofing and higher deposition rates Widespread use across offshore repair, ship maintenance, and subsea construction activities ensures strong consumption trends, positioning the electrode segment as the primary contributor to overall market growth.
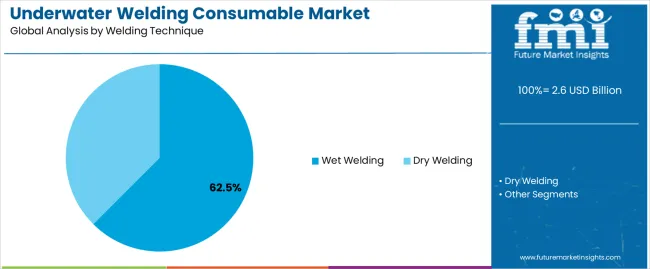
The wet welding technique, representing 62.50% of the welding technique category, holds the largest share due to its operational flexibility and cost advantages in field repair operations. Its adoption is driven by the ability to perform direct underwater welding without requiring costly habitat enclosures. The segment’s growth is supported by advancements in electrode coatings that improve arc stability and visibility underwater.
Continuous innovation in diver safety systems and power source optimization has further improved process efficiency. Although challenges related to hydrogen embrittlement persist, ongoing improvements in consumable design are minimizing these risks.
The wet welding method remains preferred for emergency repairs, offshore structures, and ship maintenance due to its efficiency and reduced setup time Its extensive use in offshore and marine applications ensures that it continues to dominate the underwater welding consumables market.
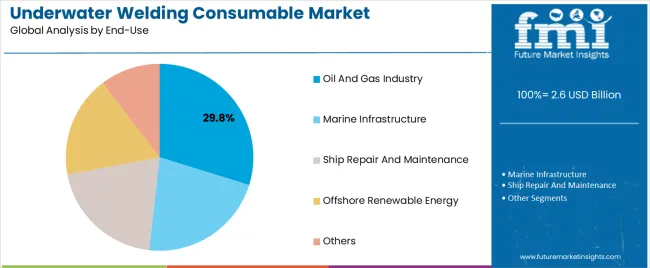
The oil and gas industry segment, holding 29.80% of the end-use category, has remained the primary revenue contributor due to its extensive use of underwater welding in offshore platform maintenance and subsea pipeline fabrication. High operational demand in exploration, extraction, and infrastructure repair has sustained consistent consumption levels. The segment’s share is reinforced by ongoing investments in offshore drilling projects and the refurbishment of aging installations.
Increasing deep-water exploration activities and the need for structural integrity assurance have heightened dependence on high-performance welding consumables. Companies are emphasizing the development of specialized consumables capable of withstanding high pressure, salinity, and corrosion exposure.
Strategic collaborations between equipment manufacturers and oilfield service providers are also enhancing product adoption As offshore energy projects expand globally, the oil and gas segment is expected to maintain its leading position within the underwater welding consumable market.
Market to Expand Over 1.8x through 2035
The global underwater welding consumable market is projected to expand over 1.8x through 2035, amid a 2.8% increase in expected CAGR compared to the historical one. This is due to rising demand in offshore industries, growth in the renewable energy sector, and infrastructure development.
North America Shows Considerable Underwater Welding Consumable Market Growth
North America is poised to direct the underwater welding consumable market, projecting a substantial 32.4% share by 2035. This dominance can be attributed to several key factors.
Global sales of underwater welding consumables grew at a CAGR of 3.4% between 2020 and 2025. The market reached USD 2,261.9 million in 2025.
| Historical CAGR (2020 to 2025) | 3.4% |
|---|---|
| Forecast CAGR (2025 to 2035) | 6.2% |
In the forecast period, the global underwater welding consumable industry is set to thrive at a CAGR of 6.2%. Over the forecast period, the global underwater welding consumable market is poised to exhibit healthy growth, totaling a valuation of USD 4,383.8 million by 2035.
Expanding Marine Infrastructure
The global expansion of marine infrastructure is a key driver propelling demand for underwater welding consumables. As maritime activities continue to surge, with a particular focus on ports and offshore wind farms, the necessity for reliable underwater welding solutions intensifies.
Ports serve as crucial hubs for international trade, demanding constant construction and maintenance to accommodate growing shipping needs.
Development of offshore wind farms, a sustainable energy frontier, necessitates the deployment of underwater welding consumables. These are set to be mainly used for installing, repairing, and maintaining submerged structures.
Aging Underwater Structures
The aging of underwater structures, such as bridges and pipelines, is driving demand for underwater welding consumables. These critical infrastructures require regular maintenance and repair to ensure structural integrity and prevent leaks. Welding plays a crucial role in rejuvenating and reinforcing these structures.
Global Demand for Offshore Oil and Gas Expands
The escalating global demand for energy is a primary driver propelling substantial investments in offshore oil and gas exploration. It is catalyzing a heightened need for underwater welding consumables.
As the world's population grows, so does the thirst for energy resources, prompting the exploration and extraction of hydrocarbons from offshore reserves. This surge in offshore activities necessitates using advanced and reliable underwater welding solutions.
These are used for constructing, repairing, and maintaining critical infrastructure, such as subsea pipelines and drilling platforms.
Underwater welding consumables play a pivotal role in facilitating the structural integrity of submerged installations. As technological advancements continue to enhance the capabilities of underwater welding, consumables used in these operations become indispensable components of the exploration and extraction process.
The table below highlights key countries’ underwater welding consumable market revenues. The United States, China, Germany, and India are expected to remain the key customers of underwater welding consumables, with expected valuations of USD 4.5 million, USD 632.3 million, USD 360.2 million, and USD 333.8 million, respectively, in 2035.
| Countries | Market Revenue (2035) |
|---|---|
| United States | USD 4.5 million |
| China | USD 632.3 million |
| Germany | USD 360.2 million |
| India | USD 333.8 million |
| Japan | USD 235.7 million |
| United Kingdom | USD 194.4 million |
The table below shows the estimated growth rates of several countries in the market. Japan, India, and the United Kingdom are set to record CAGRs of 7.9%, 7.1%, and 6.9%, respectively, through 2035.
| Countries | Projected CAGR (2025 to 2035) |
|---|---|
| Japan | 7.9% |
| India | 7.1% |
| United Kingdom | 6.9% |
| China | 6.7% |
| Germany | 6.1% |
| United States | 5.9% |
Sales of underwater welding consumables in the United States are projected to soar at a CAGR of around 5.9% during the assessment period. Total valuation in the country is anticipated to reach USD 4.5 million by 2035, driven by factors like:
China's underwater welding consumable market is projected to reach USD 632.3 million by 2035. Over the assessment period, demand for underwater welding consumables in China is set to rise at 6.7% CAGR. Key factors supporting the market growth are:
India's underwater welding consumable market is poised to exhibit a CAGR of 7.1% during the evaluation period. It is expected to attain a market valuation of USD 333.8 million by 2035. Some of the factors driving growth are as follows:
By 2035, underwater welding consumable sales in Germany are expected to reach USD 360.2 million. Some of the key drivers/trends include:
Japan's underwater welding consumable market is expected to rise at a CAGR of 7.9% over the forecast period. Several factors are expected to drive growth of Japan's underwater welding consumable industry. These include:
The section below shows the electrode segment dominating based on product type. It is forecast to thrive at 6.3% CAGR between 2025 and 2035. Based on end-use, the oil & gas industry segment is anticipated to hold a dominant share through 2035. It is set to exhibit a CAGR of 5.7% during the forecast period.
| Top Segment (Product Type) | Electrodes |
|---|---|
| Predicted CAGR (2025 to 2035) | 6.3% |
| Top Segment (End-use) | Oil and Gas Industry |
|---|---|
| Projected CAGR (2025 to 2035) | 5.7% |
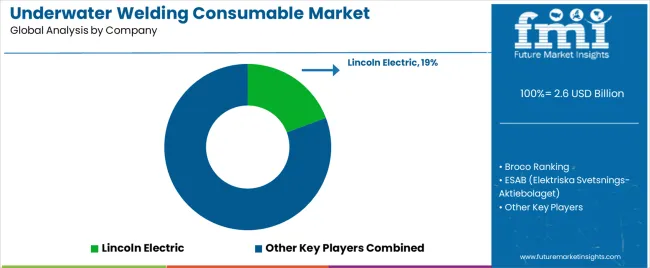
The global underwater welding consumable market is consolidated, with leading players accounting for around 25% to 30% share. Broco Ranking, ESAB (Elektriska Svetsnings-Aktiebolaget), Lincoln Electric, and Air Liquide Welding are the leading manufacturers and suppliers of underwater welding consumables listed in the report.
Key underwater welding consumables manufacturers invest in continuous research to produce new products and increase their production capacity to meet end-user demand. They are also inclined toward adopting strategies to strengthen their footprint, including acquisitions, partnerships, mergers, and facility expansions.
Recent Developments
The global underwater welding consumable market is estimated to be valued at USD 2.6 billion in 2025.
The market size for the underwater welding consumable market is projected to reach USD 4.5 billion by 2035.
The underwater welding consumable market is expected to grow at a 5.9% CAGR between 2025 and 2035.
The key product types in underwater welding consumable market are electrodes, _metal core electrodes, _cellulosic electrodes, _rutile electrodes, _others, wires, _solid wires, _flux-cored wires, _submerged arc wires, fluxes, _fused fluxes, _agglomerated fluxes, _submerged arc fluxes, welding stinger and others.
In terms of welding technique, wet welding segment to command 62.5% share in the underwater welding consumable market in 2025.


Our Research Products

The "Full Research Suite" delivers actionable market intel, deep dives on markets or technologies, so clients act faster, cut risk, and unlock growth.

The Leaderboard benchmarks and ranks top vendors, classifying them as Established Leaders, Leading Challengers, or Disruptors & Challengers.

Locates where complements amplify value and substitutes erode it, forecasting net impact by horizon

We deliver granular, decision-grade intel: market sizing, 5-year forecasts, pricing, adoption, usage, revenue, and operational KPIs—plus competitor tracking, regulation, and value chains—across 60 countries broadly.

Spot the shifts before they hit your P&L. We track inflection points, adoption curves, pricing moves, and ecosystem plays to show where demand is heading, why it is changing, and what to do next across high-growth markets and disruptive tech

Real-time reads of user behavior. We track shifting priorities, perceptions of today’s and next-gen services, and provider experience, then pace how fast tech moves from trial to adoption, blending buyer, consumer, and channel inputs with social signals (#WhySwitch, #UX).

Partner with our analyst team to build a custom report designed around your business priorities. From analysing market trends to assessing competitors or crafting bespoke datasets, we tailor insights to your needs.
Supplier Intelligence
Discovery & Profiling
Capacity & Footprint
Performance & Risk
Compliance & Governance
Commercial Readiness
Who Supplies Whom
Scorecards & Shortlists
Playbooks & Docs
Category Intelligence
Definition & Scope
Demand & Use Cases
Cost Drivers
Market Structure
Supply Chain Map
Trade & Policy
Operating Norms
Deliverables
Buyer Intelligence
Account Basics
Spend & Scope
Procurement Model
Vendor Requirements
Terms & Policies
Entry Strategy
Pain Points & Triggers
Outputs
Pricing Analysis
Benchmarks
Trends
Should-Cost
Indexation
Landed Cost
Commercial Terms
Deliverables
Brand Analysis
Positioning & Value Prop
Share & Presence
Customer Evidence
Go-to-Market
Digital & Reputation
Compliance & Trust
KPIs & Gaps
Outputs
Full Research Suite comprises of:
Market outlook & trends analysis
Interviews & case studies
Strategic recommendations
Vendor profiles & capabilities analysis
5-year forecasts
8 regions and 60+ country-level data splits
Market segment data splits
12 months of continuous data updates
DELIVERED AS:
PDF EXCEL ONLINE
Welding Consumables Market Growth - Trends & Forecast 2025 to 2035
Underwater Welding Equipment Market Growth – Trends & Forecast 2024-2034
Welding Equipment And Consumables Market Size and Share Forecast Outlook 2025 to 2035
Demand for Welding Consumables in Japan Size and Share Forecast Outlook 2025 to 2035
Demand for Welding Consumables in USA Size and Share Forecast Outlook 2025 to 2035
Welding Electrodes and Rods Market Size and Share Forecast Outlook 2025 to 2035
Welding Filler Metal Market Size and Share Forecast Outlook 2025 to 2035
Underwater Light Market Size and Share Forecast Outlook 2025 to 2035
Underwater Hotel Market Forecast and Outlook 2025 to 2035
Consumable Parts for Semiconductor Equipment Market Size and Share Forecast Outlook 2025 to 2035
Underwater Modems Market Size and Share Forecast Outlook 2025 to 2035
Underwater Bikes Market Size and Share Forecast Outlook 2025 to 2035
Welding Fume Extraction Equipment Market Size and Share Forecast Outlook 2025 to 2035
Underwater Pelletizing Market Size and Share Forecast Outlook 2025 to 2035
Underwater Connectors Market Size and Share Forecast Outlook 2025 to 2035
Underwater Camera Market Size and Share Forecast Outlook 2025 to 2035
Welding Material Market Analysis by Type, Technology, End User, and Region 2025 to 2035
Underwater Acoustic Communication Market Growth - Trends & Forecast 2025 to 2035
Welding Guns Market Growth - Trends & Forecast 2025 to 2035
Welding Torch and Tip Changing Robotic Station Market Growth – Trends & Forecast 2024-2034

Thank you!
You will receive an email from our Business Development Manager. Please be sure to check your SPAM/JUNK folder too.
Chat With
MaRIA