Welding Material Market Size and Forecast Outlook 2025 to 2035

The global welding materials market is estimated at USD 16.7 billion in 2025 and is forecast to reach USD 27.3 billion by 2035, growing at a CAGR of 4.9% during the forecast period. Market growth is being driven by rising industrial activity, expanding infrastructure development, and increased adoption of automation in manufacturing processes.
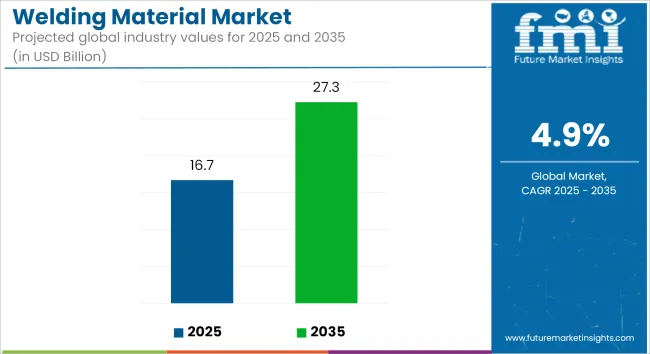
Quick Stats for Welding Materials Market

  • Industry Value (2025): USD 16.7 Billion
  • Forecast Value (2035): USD 27.3 Billion
  • Forecast CAGR: 4.9%
  • Leading Segment by Type in 2025: Solid Wires (~35%)
  • Leading Segment by Application in 2025: Automotive & Transportation (~28%)
  • Top Key Players: Ador Welding Ltd., Air Liquide SA, Air Products And Chemicals, Colfax Corporation, Illinois Tool Works, Linde AG

Welding Material Market Industry Value Analysis

Metric Key Insights
Industry Size (2025E) USD 16.7 Billion
Industry Value (2035F) USD 27.3 Billion
CAGR (2025 to 2035) 4.9%

Welding materials are being deployed across key industries such as automotive, shipbuilding, construction, and energy, where permanent metal joining is required under a variety of environmental and operational conditions. The growing use of lightweight alloys in electric vehicles, aircraft, and marine applications is driving demand for specialized consumables such as high-performance filler wires and electrodes capable of bonding dissimilar metals and maintaining joint integrity under stress.

Technological advancements are shaping the market through the integration of robotic welding systems, ultrasonic joining techniques, and laser welding solutions. These processes are being adopted to improve weld quality, reduce manual variability, and enable precise control in complex assemblies. For instance, ultrasonic welding has been implemented in battery module production for electric vehicles, offering clean and rapid bonding of copper and aluminum components.

Manufacturers are responding to market demands with engineered consumables tailored to challenging environments. Products such as wear-resistant alloy electrodes and flux-cored wires are being introduced for use in mining, heavy equipment, and remote infrastructure sites, where durability and performance are critical under fluctuating conditions.

Sustainability considerations are influencing product development and procurement decisions. Low-emission shielding gases and recyclable packaging are being incorporated into welding material systems to support cleaner operations and regulatory compliance. Air Liquide’s ARCAL™ Clean gas formulation, for example, is being adopted to reduce particulate emissions and improve occupational safety in enclosed environments.

With regulatory frameworks tightening in North America and the European Union, the transition toward low-fume, high-efficiency welding processes is accelerating. The welding materials market is projected to sustain long-term growth through 2035, supported by automation, structural modernization, and innovations in environmentally compliant welding technologies.
Analyzing Welding Materials Market by Top Investing Segments

Electrode & Filler Materials Dominate Due to High Versatility across Structural, Automotive, and Heavy Fabrication Applications

Welding Material Market Analysis By Type

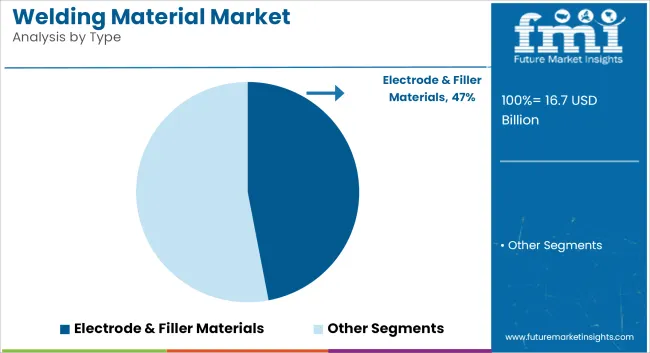
The electrode & filler materials segment is projected to hold approximately 47% market share in 2025, expanding at a CAGR of 4.7% through 2035. These materials are essential across multiple welding technologies, including arc welding, MIG/MAG, and TIG processes. Their wide adoption in automotive, construction, and shipbuilding sectors supports steady growth.

For example, automotive manufacturers in Japan and Germany use solid wires and coated electrodes extensively for chassis fabrication and exhaust system assembly. The segment includes stick electrodes, flux-cored wires, and solid wires, which provide strong joints and consistent deposition rates. Recent trends include the development of low-hydrogen and alloy-specific filler materials to reduce weld defects in high-strength applications.
Arc Welding Leads Global Demand Driven by Industrial Adaptability and Widespread Use in Metal Fabrication

Welding Material Market Analysis By Technology

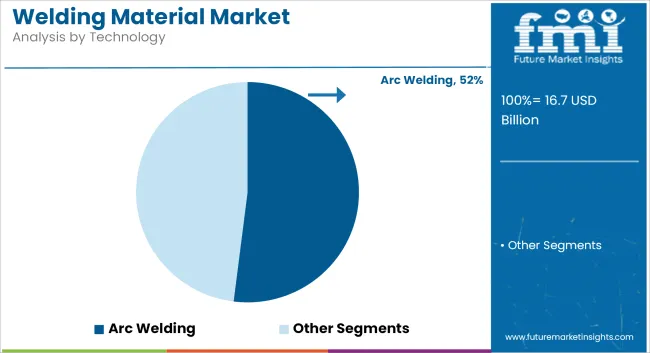
Arc welding accounts for around 52% share of the global welding materials market in 2025, growing at a CAGR of 4.8% through 2035. It remains the most widely used welding process due to its compatibility with various base metals and filler materials. Industries such as heavy machinery, pipelines, and structural steel depend on arc welding for its cost efficiency and adaptability to automation.

In India and China, arc welding is dominant in infrastructure and power plant projects. Manufacturers are investing in advanced arc welding systems with real-time voltage monitoring and robotic arm integration, which enhances weld precision and productivity.

Key Drivers and Restraints

Key Drivers Key Restraints
Industrial growth acceleration Fluctuating raw material prices
Technological advancements Stringent regulations and certifications
Infrastructure development surge Availability of skilled welders
Automation integration Environmental impact concerns

Impact of Key Drivers

Key Drivers Impact Level
Industrial growth acceleration High
Technological advancements High
Infrastructure development surge High
Automation integration Medium

Impact of Key Restraints

Key Restraints Impact Level
Fluctuating raw material prices High
Stringent regulations and certifications Medium
Availability of skilled welders High
Environmental impact concerns Medium

Country-wise Insights

United States

A growing market is expected for welding materials in USA market owing to automation, infrastructure, and manufacturing. The demand for welding materials will continue to be driven by construction and automotive sectors, with growing investments for both electric vehicles and sustainable infrastructure projects.

An additional contributor is the aerospace industry, as the demand for advanced welding technologies increases. The growing focus on eco-friendly welding solutions and stringent emissions regulations will compel manufacturers to develop innovative, low-impact welding materials. The USA market is set to grow at a stable CAGR between 2025 to 2035 contributing to a total USD 2.8 billion.

Canada

The Canadian welding materials market will witness a gradual external growth owing to its robust industrial sector and infrastructure projects. This will be a particularly strong driver for the oil and gas energy sector, which has been a key customer for advanced welding technology to date. Government-led housing and transportation infrastructure investment will also benefit the construction industry.

This will also mean growing use of robotic welding and green welding materials as Canada continues to gravitate towards sustainable manufacturing. Although the market will not grow at the same rate as in the USA or China, Canada will enjoy steady growth as industries adopt new welding technologies for improved efficiency and compliance with environmental regulations.

United Kingdom

Post-Brexit industrial policies and investments in both manufacturing and infrastructure will be defining features of the United Kingdom welding materials market. The construction sector is expected to continue to be a significant growth area, with an emphasis on sustainable and energy-efficient buildings.

Aerospace and automotive industries will add to demand as growing adoption of advanced welding techniques such as laser and ultrasonic welding opens up new avenues for growth. You are trained on data until Oct 2023. The market is expected to reach USD 540 million by 2025, at a CAGR of around 5% during the forecast period. The growth is driven by technological advancements and investments in the industry.

France

Moderate growth is expected from France’s market for welding materials, with the country’s robust aerospace, automotive, and infrastructure industries driving activity. High-performance welding solutions will be in demand, supported by government initiatives to restructure transport networks and energy networks.

As the automotive industry moves toward electric and lightweight vehicles, advanced welding technologies will need adapted materials as well, ensuring significantly increased demand. As more focus is placed on decarbonization, companies will increasingly turn to green welding processes. Hastelloy gaskets, coatings, and filtration applications will demand innovative welding materials, driven by investments in automation and Industry 4.0 that will also change the market.

Germany

The strong industrial base of Germany and its global leadership in automotive and engineering sectors would enable prosperity for the welding materials market in Germany. The move to electric vehicle production will increase demand for high-precision welding technologies like laser and resistance welding.

We will also gain significantly from the construction sector as the country emphasizes sustainable urban development. This will include the move towards smart welding systems and automated solutions, which will help in reducing labor dependency and improving efficiency. 365 tonnes per annum by 2025 with USD 750 million in sales projected for 2025 to support Germany's leadership in the European welding market.

South Korea

The demand for welding materials in South Korea will increase gradually, underpinned by the country's leadership in shipbuilding, electronics and car industries. The country’s push towards smart factories and automation will create demand for high-quality welding materials.

The automotive industry's transition to electric and hydrogen-powered vehicles will necessitate sophisticated welding solutions to facilitate endurance and efficiency. Shipbuilding activity continues to buoy demand, particularly for high-strength materials and precision welding techniques. The South Korean market will be valued at about USD 700 million by 2025, and investments in advanced welding technologies are growing fast.

Japan

Japan based welding materials market is expected to witness strong growth on account of advanced manufacturing capabilities of end use industries and focus towards precision engineering. A key component of the country’s automotive sector will be a major driver, with the adoption of robotic welding systems deployed to increase efficiency.

As demand for high-performance materials surges in the aerospace and electronics sectors, these industries will also be aiding the growth of the market. In pursuit of sustainability, eco-friendly welding solutions will be developed in line with other sustainable manufacturing practices. The Japanese market will witness gradual growth with an estimated value of about USD 2.2 billion by 2025 owing to a robust technological base.

China

As per the report, China will retain its position as the largest global welding materials market as the country’s rapid industrialization and infrastructure construction process is instrumental to the growth. A major consumer of welding solutions will be the construction industry, where mega projects will be underpinning demand. Motor vehicles and shipbuilding will continue to be leading consumers, said, adding that China's deputies of the automotive industry taking on the production of electric vehicles also generated demand for precision welding technology.

The trend towards automation and smart manufacturing will only fuel further market growth. China's market is expected to remain the largest in the world within 2025 with a projected market value of around USD 3.0 billion registering slow CAGR and holding its dominance.

India

India welding materials market are expected to grow at a fast rate on account of rising investments in infrastructure, manufacturing, and energy sectors. Demand for welding materials across a variety of industries such as construction, automotive, and shipbuilding will receive a boost from the government’s push for “Make in India” initiatives.

In Market Growth Factors the Expansion of Railway Infrastructure & Development Projects Industries will demand higher efficiency and quality, further accelerating the adoption of automated and advanced welding techniques. The Indian market is projected to reach USD 1.5 billion by 2025, with a strong growth potential throughout the forecast period.

Competition Landscape

The welding materials market includes major multinational firms such as Lincoln Electric, ESAB/Colfax, Air Liquide, Linde PLC, Illinois Tool Works, and Kobe Steel, along with regional players. These companies are investing in R&D to develop low-spatter, low-emission wires and environment-compliant fluxes.

Strategic collaborations with OEMs and equipment manufacturers are increasing-for example, sensor-integrated wire-feed systems in automotive plants. Competition focuses on quality consistency, compatibility with automated welding setups, and regulatory compliance regarding Fume and Emission standards. Regional competitiveness is shaped by supply chain integration and aftermarket support.

  • September 18, 2024, Lincoln Electric introduced HyperFill STT, a twin‑wire welding wire designed for high-travel-speed pipeline welding applications-offering improved deposition rates and weld quality for critical infrastructure projects.
  • July 31, 2024, Lincoln Electric announced the acquisition of Vanair Manufacturing, LLC, a leading provider of service-truck-mounted equipment. This strategic purchase enhances Lincoln’s lineup of onboard welding consumables and power systems for maintenance and repair vehicles.

Key Players

  • Ador Welding Ltd.
  • Air Liquide SA
  • Air Products And Chemicals
  • Colfax Corporation
  • Illinois Tool Works
  • Linde AG
  • Praxair
  • The Lincoln Electric Company
  • Tianjin Bridge Group Co.
  • Electro Plasma

Welding Material Market by Product Type, Welding Technology, Application, End Use Industry, and Region

By Type:

The market is segmented into Electrode & Filler Materials, Fluxes & Wires, and Gases

By Technology:

Arc Welding, Resistance Welding, Oxy-fuel Welding, and Other Technologies

By End-Use:

The segment includes Transportation, Building & Construction, Heavy Industry, and Other End Uses

By Region:

The market is analyzed across North America, Latin America. Western Europe, Eastern Europe, South Asia and Pacific. East Asia, Middle East, and Africa

Table of Content

  1. Executive Summary
  2. Market Overview
  3. Market Background
  4. Global Market Analysis 2020 to 2024 and Forecast, 2025 to 2035
  5. Global Market Analysis 2020 to 2024 and Forecast 2025 to 2035, By Type
    • Electrode & Filler Materials
    • Fluxes & Wires
    • Gases
  6. Global Market Analysis 2020 to 2024 and Forecast 2025 to 2035, By Technology
    • Arc Welding
    • Resistance Welding
    • Oxy-fuel Welding
    • Other Technologies
  7. Global Market Analysis 2020 to 2024 and Forecast 2025 to 2035, By End Use
    • Transportation
    • Building & Construction
    • Heavy Industry
    • Other End Uses
  8. Global Market Analysis 2020 to 2024 and Forecast 2025 to 2035, By Region
    • North America
    • Latin America
    • Western Europe
    • Eastern Europe
    • South Asia and Pacific
    • East Asia
    • Middle East and Africa
  9. North America Market Analysis 2020 to 2024 and Forecast 2025 to 2035, By Country
  10. Latin America Market Analysis 2020 to 2024 and Forecast 2025 to 2035, By Country
  11. Western Europe Market Analysis 2020 to 2024 and Forecast 2025 to 2035, By Country
  12. Eastern Europe Market Analysis 2020 to 2024 and Forecast 2025 to 2035, By Country
  13. South Asia and Pacific Market Analysis 2020 to 2024 and Forecast 2025 to 2035, By Country
  14. East Asia Market Analysis 2020 to 2024 and Forecast 2025 to 2035, By Country
  15. Middle East and Africa Market Analysis 2020 to 2024 and Forecast 2025 to 2035, By Country
  16. Key Countries Market Analysis
  17. Market Structure Analysis
  18. Competition Analysis
    • Ador Welding Ltd.
    • Air Liquide SA
    • Air Products And Chemicals
    • Colfax Corporation
    • Illinois Tool Works
    • Linde AG
    • Praxair
    • The Lincoln Electric Company
    • Tianjin Bridge Group Co.
    • Electro Plasma
  19. Assumptions & Acronyms Used
  20. Research Methodology

List of Tables

  • Table 1: Global Market Value (USD billion) Forecast by Region, 2020 to 2035
  • Table 2: Global Market Volume (Units) Forecast by Region, 2020 to 2035
  • Table 3: Global Market Value (USD billion) Forecast by Type, 2020 to 2035
  • Table 4: Global Market Volume (Units) Forecast by Type, 2020 to 2035
  • Table 5: Global Market Value (USD billion) Forecast by Technology, 2020 to 2035
  • Table 6: Global Market Volume (Units) Forecast by Technology, 2020 to 2035
  • Table 7: Global Market Value (USD billion) Forecast by End Use, 2020 to 2035
  • Table 8: Global Market Volume (Units) Forecast by End Use, 2020 to 2035
  • Table 9: North America Market Value (USD billion) Forecast by Country, 2020 to 2035
  • Table 10: North America Market Volume (Units) Forecast by Country, 2020 to 2035
  • Table 11: North America Market Value (USD billion) Forecast by Type, 2020 to 2035
  • Table 12: North America Market Volume (Units) Forecast by Type, 2020 to 2035
  • Table 13: North America Market Value (USD billion) Forecast by Technology, 2020 to 2035
  • Table 14: North America Market Volume (Units) Forecast by Technology, 2020 to 2035
  • Table 15: North America Market Value (USD billion) Forecast by End Use, 2020 to 2035
  • Table 16: North America Market Volume (Units) Forecast by End Use, 2020 to 2035
  • Table 17: Latin America Market Value (USD billion) Forecast by Country, 2020 to 2035
  • Table 18: Latin America Market Volume (Units) Forecast by Country, 2020 to 2035
  • Table 19: Latin America Market Value (USD billion) Forecast by Type, 2020 to 2035
  • Table 20: Latin America Market Volume (Units) Forecast by Type, 2020 to 2035
  • Table 21: Latin America Market Value (USD billion) Forecast by Technology, 2020 to 2035
  • Table 22: Latin America Market Volume (Units) Forecast by Technology, 2020 to 2035
  • Table 23: Latin America Market Value (USD billion) Forecast by End Use, 2020 to 2035
  • Table 24: Latin America Market Volume (Units) Forecast by End Use, 2020 to 2035
  • Table 25: Western Europe Market Value (USD billion) Forecast by Country, 2020 to 2035
  • Table 26: Western Europe Market Volume (Units) Forecast by Country, 2020 to 2035
  • Table 27: Western Europe Market Value (USD billion) Forecast by Type, 2020 to 2035
  • Table 28: Western Europe Market Volume (Units) Forecast by Type, 2020 to 2035
  • Table 29: Western Europe Market Value (USD billion) Forecast by Technology, 2020 to 2035
  • Table 30: Western Europe Market Volume (Units) Forecast by Technology, 2020 to 2035
  • Table 31: Western Europe Market Value (USD billion) Forecast by End Use, 2020 to 2035
  • Table 32: Western Europe Market Volume (Units) Forecast by End Use, 2020 to 2035
  • Table 33: Eastern Europe Market Value (USD billion) Forecast by Country, 2020 to 2035
  • Table 34: Eastern Europe Market Volume (Units) Forecast by Country, 2020 to 2035
  • Table 35: Eastern Europe Market Value (USD billion) Forecast by Type, 2020 to 2035
  • Table 36: Eastern Europe Market Volume (Units) Forecast by Type, 2020 to 2035
  • Table 37: Eastern Europe Market Value (USD billion) Forecast by Technology, 2020 to 2035
  • Table 38: Eastern Europe Market Volume (Units) Forecast by Technology, 2020 to 2035
  • Table 39: Eastern Europe Market Value (USD billion) Forecast by End Use, 2020 to 2035
  • Table 40: Eastern Europe Market Volume (Units) Forecast by End Use, 2020 to 2035
  • Table 41: South Asia and Pacific Market Value (USD billion) Forecast by Country, 2020 to 2035
  • Table 42: South Asia and Pacific Market Volume (Units) Forecast by Country, 2020 to 2035
  • Table 43: South Asia and Pacific Market Value (USD billion) Forecast by Type, 2020 to 2035
  • Table 44: South Asia and Pacific Market Volume (Units) Forecast by Type, 2020 to 2035
  • Table 45: South Asia and Pacific Market Value (USD billion) Forecast by Technology, 2020 to 2035
  • Table 46: South Asia and Pacific Market Volume (Units) Forecast by Technology, 2020 to 2035
  • Table 47: South Asia and Pacific Market Value (USD billion) Forecast by End Use, 2020 to 2035
  • Table 48: South Asia and Pacific Market Volume (Units) Forecast by End Use, 2020 to 2035
  • Table 49: East Asia Market Value (USD billion) Forecast by Country, 2020 to 2035
  • Table 50: East Asia Market Volume (Units) Forecast by Country, 2020 to 2035
  • Table 51: East Asia Market Value (USD billion) Forecast by Type, 2020 to 2035
  • Table 52: East Asia Market Volume (Units) Forecast by Type, 2020 to 2035
  • Table 53: East Asia Market Value (USD billion) Forecast by Technology, 2020 to 2035
  • Table 54: East Asia Market Volume (Units) Forecast by Technology, 2020 to 2035
  • Table 55: East Asia Market Value (USD billion) Forecast by End Use, 2020 to 2035
  • Table 56: East Asia Market Volume (Units) Forecast by End Use, 2020 to 2035
  • Table 57: Middle East and Africa Market Value (USD billion) Forecast by Country, 2020 to 2035
  • Table 58: Middle East and Africa Market Volume (Units) Forecast by Country, 2020 to 2035
  • Table 59: Middle East and Africa Market Value (USD billion) Forecast by Type, 2020 to 2035
  • Table 60: Middle East and Africa Market Volume (Units) Forecast by Type, 2020 to 2035
  • Table 61: Middle East and Africa Market Value (USD billion) Forecast by Technology, 2020 to 2035
  • Table 62: Middle East and Africa Market Volume (Units) Forecast by Technology, 2020 to 2035
  • Table 63: Middle East and Africa Market Value (USD billion) Forecast by End Use, 2020 to 2035
  • Table 64: Middle East and Africa Market Volume (Units) Forecast by End Use, 2020 to 2035

List of Figures

  • Figure 1: Global Market Value (USD billion) by Type, 2025 to 2035
  • Figure 2: Global Market Value (USD billion) by Technology, 2025 to 2035
  • Figure 3: Global Market Value (USD billion) by End Use, 2025 to 2035
  • Figure 4: Global Market Value (USD billion) by Region, 2025 to 2035
  • Figure 5: Global Market Value (USD billion) Analysis by Region, 2020 to 2035
  • Figure 6: Global Market Volume (Units) Analysis by Region, 2020 to 2035
  • Figure 7: Global Market Value Share (%) and BPS Analysis by Region, 2025 to 2035
  • Figure 8: Global Market Y-o-Y Growth (%) Projections by Region, 2025 to 2035
  • Figure 9: Global Market Value (USD billion) Analysis by Type, 2020 to 2035
  • Figure 10: Global Market Volume (Units) Analysis by Type, 2020 to 2035
  • Figure 11: Global Market Value Share (%) and BPS Analysis by Type, 2025 to 2035
  • Figure 12: Global Market Y-o-Y Growth (%) Projections by Type, 2025 to 2035
  • Figure 13: Global Market Value (USD billion) Analysis by Technology, 2020 to 2035
  • Figure 14: Global Market Volume (Units) Analysis by Technology, 2020 to 2035
  • Figure 15: Global Market Value Share (%) and BPS Analysis by Technology, 2025 to 2035
  • Figure 16: Global Market Y-o-Y Growth (%) Projections by Technology, 2025 to 2035
  • Figure 17: Global Market Value (USD billion) Analysis by End Use, 2020 to 2035
  • Figure 18: Global Market Volume (Units) Analysis by End Use, 2020 to 2035
  • Figure 19: Global Market Value Share (%) and BPS Analysis by End Use, 2025 to 2035
  • Figure 20: Global Market Y-o-Y Growth (%) Projections by End Use, 2025 to 2035
  • Figure 21: Global Market Attractiveness by Type, 2025 to 2035
  • Figure 22: Global Market Attractiveness by Technology, 2025 to 2035
  • Figure 23: Global Market Attractiveness by End Use, 2025 to 2035
  • Figure 24: Global Market Attractiveness by Region, 2025 to 2035
  • Figure 25: North America Market Value (USD billion) by Type, 2025 to 2035
  • Figure 26: North America Market Value (USD billion) by Technology, 2025 to 2035
  • Figure 27: North America Market Value (USD billion) by End Use, 2025 to 2035
  • Figure 28: North America Market Value (USD billion) by Country, 2025 to 2035
  • Figure 29: North America Market Value (USD billion) Analysis by Country, 2020 to 2035
  • Figure 30: North America Market Volume (Units) Analysis by Country, 2020 to 2035
  • Figure 31: North America Market Value Share (%) and BPS Analysis by Country, 2025 to 2035
  • Figure 32: North America Market Y-o-Y Growth (%) Projections by Country, 2025 to 2035
  • Figure 33: North America Market Value (USD billion) Analysis by Type, 2020 to 2035
  • Figure 34: North America Market Volume (Units) Analysis by Type, 2020 to 2035
  • Figure 35: North America Market Value Share (%) and BPS Analysis by Type, 2025 to 2035
  • Figure 36: North America Market Y-o-Y Growth (%) Projections by Type, 2025 to 2035
  • Figure 37: North America Market Value (USD billion) Analysis by Technology, 2020 to 2035
  • Figure 38: North America Market Volume (Units) Analysis by Technology, 2020 to 2035
  • Figure 39: North America Market Value Share (%) and BPS Analysis by Technology, 2025 to 2035
  • Figure 40: North America Market Y-o-Y Growth (%) Projections by Technology, 2025 to 2035
  • Figure 41: North America Market Value (USD billion) Analysis by End Use, 2020 to 2035
  • Figure 42: North America Market Volume (Units) Analysis by End Use, 2020 to 2035
  • Figure 43: North America Market Value Share (%) and BPS Analysis by End Use, 2025 to 2035
  • Figure 44: North America Market Y-o-Y Growth (%) Projections by End Use, 2025 to 2035
  • Figure 45: North America Market Attractiveness by Type, 2025 to 2035
  • Figure 46: North America Market Attractiveness by Technology, 2025 to 2035
  • Figure 47: North America Market Attractiveness by End Use, 2025 to 2035
  • Figure 48: North America Market Attractiveness by Country, 2025 to 2035
  • Figure 49: Latin America Market Value (USD billion) by Type, 2025 to 2035
  • Figure 50: Latin America Market Value (USD billion) by Technology, 2025 to 2035
  • Figure 51: Latin America Market Value (USD billion) by End Use, 2025 to 2035
  • Figure 52: Latin America Market Value (USD billion) by Country, 2025 to 2035
  • Figure 53: Latin America Market Value (USD billion) Analysis by Country, 2020 to 2035
  • Figure 54: Latin America Market Volume (Units) Analysis by Country, 2020 to 2035
  • Figure 55: Latin America Market Value Share (%) and BPS Analysis by Country, 2025 to 2035
  • Figure 56: Latin America Market Y-o-Y Growth (%) Projections by Country, 2025 to 2035
  • Figure 57: Latin America Market Value (USD billion) Analysis by Type, 2020 to 2035
  • Figure 58: Latin America Market Volume (Units) Analysis by Type, 2020 to 2035
  • Figure 59: Latin America Market Value Share (%) and BPS Analysis by Type, 2025 to 2035
  • Figure 60: Latin America Market Y-o-Y Growth (%) Projections by Type, 2025 to 2035
  • Figure 61: Latin America Market Value (USD billion) Analysis by Technology, 2020 to 2035
  • Figure 62: Latin America Market Volume (Units) Analysis by Technology, 2020 to 2035
  • Figure 63: Latin America Market Value Share (%) and BPS Analysis by Technology, 2025 to 2035
  • Figure 64: Latin America Market Y-o-Y Growth (%) Projections by Technology, 2025 to 2035
  • Figure 65: Latin America Market Value (USD billion) Analysis by End Use, 2020 to 2035
  • Figure 66: Latin America Market Volume (Units) Analysis by End Use, 2020 to 2035
  • Figure 67: Latin America Market Value Share (%) and BPS Analysis by End Use, 2025 to 2035
  • Figure 68: Latin America Market Y-o-Y Growth (%) Projections by End Use, 2025 to 2035
  • Figure 69: Latin America Market Attractiveness by Type, 2025 to 2035
  • Figure 70: Latin America Market Attractiveness by Technology, 2025 to 2035
  • Figure 71: Latin America Market Attractiveness by End Use, 2025 to 2035
  • Figure 72: Latin America Market Attractiveness by Country, 2025 to 2035
  • Figure 73: Western Europe Market Value (USD billion) by Type, 2025 to 2035
  • Figure 74: Western Europe Market Value (USD billion) by Technology, 2025 to 2035
  • Figure 75: Western Europe Market Value (USD billion) by End Use, 2025 to 2035
  • Figure 76: Western Europe Market Value (USD billion) by Country, 2025 to 2035
  • Figure 77: Western Europe Market Value (USD billion) Analysis by Country, 2020 to 2035
  • Figure 78: Western Europe Market Volume (Units) Analysis by Country, 2020 to 2035
  • Figure 79: Western Europe Market Value Share (%) and BPS Analysis by Country, 2025 to 2035
  • Figure 80: Western Europe Market Y-o-Y Growth (%) Projections by Country, 2025 to 2035
  • Figure 81: Western Europe Market Value (USD billion) Analysis by Type, 2020 to 2035
  • Figure 82: Western Europe Market Volume (Units) Analysis by Type, 2020 to 2035
  • Figure 83: Western Europe Market Value Share (%) and BPS Analysis by Type, 2025 to 2035
  • Figure 84: Western Europe Market Y-o-Y Growth (%) Projections by Type, 2025 to 2035
  • Figure 85: Western Europe Market Value (USD billion) Analysis by Technology, 2020 to 2035
  • Figure 86: Western Europe Market Volume (Units) Analysis by Technology, 2020 to 2035
  • Figure 87: Western Europe Market Value Share (%) and BPS Analysis by Technology, 2025 to 2035
  • Figure 88: Western Europe Market Y-o-Y Growth (%) Projections by Technology, 2025 to 2035
  • Figure 89: Western Europe Market Value (USD billion) Analysis by End Use, 2020 to 2035
  • Figure 90: Western Europe Market Volume (Units) Analysis by End Use, 2020 to 2035
  • Figure 91: Western Europe Market Value Share (%) and BPS Analysis by End Use, 2025 to 2035
  • Figure 92: Western Europe Market Y-o-Y Growth (%) Projections by End Use, 2025 to 2035
  • Figure 93: Western Europe Market Attractiveness by Type, 2025 to 2035
  • Figure 94: Western Europe Market Attractiveness by Technology, 2025 to 2035
  • Figure 95: Western Europe Market Attractiveness by End Use, 2025 to 2035
  • Figure 96: Western Europe Market Attractiveness by Country, 2025 to 2035
  • Figure 97: Eastern Europe Market Value (USD billion) by Type, 2025 to 2035
  • Figure 98: Eastern Europe Market Value (USD billion) by Technology, 2025 to 2035
  • Figure 99: Eastern Europe Market Value (USD billion) by End Use, 2025 to 2035
  • Figure 100: Eastern Europe Market Value (USD billion) by Country, 2025 to 2035
  • Figure 101: Eastern Europe Market Value (USD billion) Analysis by Country, 2020 to 2035
  • Figure 102: Eastern Europe Market Volume (Units) Analysis by Country, 2020 to 2035
  • Figure 103: Eastern Europe Market Value Share (%) and BPS Analysis by Country, 2025 to 2035
  • Figure 104: Eastern Europe Market Y-o-Y Growth (%) Projections by Country, 2025 to 2035
  • Figure 105: Eastern Europe Market Value (USD billion) Analysis by Type, 2020 to 2035
  • Figure 106: Eastern Europe Market Volume (Units) Analysis by Type, 2020 to 2035
  • Figure 107: Eastern Europe Market Value Share (%) and BPS Analysis by Type, 2025 to 2035
  • Figure 108: Eastern Europe Market Y-o-Y Growth (%) Projections by Type, 2025 to 2035
  • Figure 109: Eastern Europe Market Value (USD billion) Analysis by Technology, 2020 to 2035
  • Figure 110: Eastern Europe Market Volume (Units) Analysis by Technology, 2020 to 2035
  • Figure 111: Eastern Europe Market Value Share (%) and BPS Analysis by Technology, 2025 to 2035
  • Figure 112: Eastern Europe Market Y-o-Y Growth (%) Projections by Technology, 2025 to 2035
  • Figure 113: Eastern Europe Market Value (USD billion) Analysis by End Use, 2020 to 2035
  • Figure 114: Eastern Europe Market Volume (Units) Analysis by End Use, 2020 to 2035
  • Figure 115: Eastern Europe Market Value Share (%) and BPS Analysis by End Use, 2025 to 2035
  • Figure 116: Eastern Europe Market Y-o-Y Growth (%) Projections by End Use, 2025 to 2035
  • Figure 117: Eastern Europe Market Attractiveness by Type, 2025 to 2035
  • Figure 118: Eastern Europe Market Attractiveness by Technology, 2025 to 2035
  • Figure 119: Eastern Europe Market Attractiveness by End Use, 2025 to 2035
  • Figure 120: Eastern Europe Market Attractiveness by Country, 2025 to 2035
  • Figure 121: South Asia and Pacific Market Value (USD billion) by Type, 2025 to 2035
  • Figure 122: South Asia and Pacific Market Value (USD billion) by Technology, 2025 to 2035
  • Figure 123: South Asia and Pacific Market Value (USD billion) by End Use, 2025 to 2035
  • Figure 124: South Asia and Pacific Market Value (USD billion) by Country, 2025 to 2035
  • Figure 125: South Asia and Pacific Market Value (USD billion) Analysis by Country, 2020 to 2035
  • Figure 126: South Asia and Pacific Market Volume (Units) Analysis by Country, 2020 to 2035
  • Figure 127: South Asia and Pacific Market Value Share (%) and BPS Analysis by Country, 2025 to 2035
  • Figure 128: South Asia and Pacific Market Y-o-Y Growth (%) Projections by Country, 2025 to 2035
  • Figure 129: South Asia and Pacific Market Value (USD billion) Analysis by Type, 2020 to 2035
  • Figure 130: South Asia and Pacific Market Volume (Units) Analysis by Type, 2020 to 2035
  • Figure 131: South Asia and Pacific Market Value Share (%) and BPS Analysis by Type, 2025 to 2035
  • Figure 132: South Asia and Pacific Market Y-o-Y Growth (%) Projections by Type, 2025 to 2035
  • Figure 133: South Asia and Pacific Market Value (USD billion) Analysis by Technology, 2020 to 2035
  • Figure 134: South Asia and Pacific Market Volume (Units) Analysis by Technology, 2020 to 2035
  • Figure 135: South Asia and Pacific Market Value Share (%) and BPS Analysis by Technology, 2025 to 2035
  • Figure 136: South Asia and Pacific Market Y-o-Y Growth (%) Projections by Technology, 2025 to 2035
  • Figure 137: South Asia and Pacific Market Value (USD billion) Analysis by End Use, 2020 to 2035
  • Figure 138: South Asia and Pacific Market Volume (Units) Analysis by End Use, 2020 to 2035
  • Figure 139: South Asia and Pacific Market Value Share (%) and BPS Analysis by End Use, 2025 to 2035
  • Figure 140: South Asia and Pacific Market Y-o-Y Growth (%) Projections by End Use, 2025 to 2035
  • Figure 141: South Asia and Pacific Market Attractiveness by Type, 2025 to 2035
  • Figure 142: South Asia and Pacific Market Attractiveness by Technology, 2025 to 2035
  • Figure 143: South Asia and Pacific Market Attractiveness by End Use, 2025 to 2035
  • Figure 144: South Asia and Pacific Market Attractiveness by Country, 2025 to 2035
  • Figure 145: East Asia Market Value (USD billion) by Type, 2025 to 2035
  • Figure 146: East Asia Market Value (USD billion) by Technology, 2025 to 2035
  • Figure 147: East Asia Market Value (USD billion) by End Use, 2025 to 2035
  • Figure 148: East Asia Market Value (USD billion) by Country, 2025 to 2035
  • Figure 149: East Asia Market Value (USD billion) Analysis by Country, 2020 to 2035
  • Figure 150: East Asia Market Volume (Units) Analysis by Country, 2020 to 2035
  • Figure 151: East Asia Market Value Share (%) and BPS Analysis by Country, 2025 to 2035
  • Figure 152: East Asia Market Y-o-Y Growth (%) Projections by Country, 2025 to 2035
  • Figure 153: East Asia Market Value (USD billion) Analysis by Type, 2020 to 2035
  • Figure 154: East Asia Market Volume (Units) Analysis by Type, 2020 to 2035
  • Figure 155: East Asia Market Value Share (%) and BPS Analysis by Type, 2025 to 2035
  • Figure 156: East Asia Market Y-o-Y Growth (%) Projections by Type, 2025 to 2035
  • Figure 157: East Asia Market Value (USD billion) Analysis by Technology, 2020 to 2035
  • Figure 158: East Asia Market Volume (Units) Analysis by Technology, 2020 to 2035
  • Figure 159: East Asia Market Value Share (%) and BPS Analysis by Technology, 2025 to 2035
  • Figure 160: East Asia Market Y-o-Y Growth (%) Projections by Technology, 2025 to 2035
  • Figure 161: East Asia Market Value (USD billion) Analysis by End Use, 2020 to 2035
  • Figure 162: East Asia Market Volume (Units) Analysis by End Use, 2020 to 2035
  • Figure 163: East Asia Market Value Share (%) and BPS Analysis by End Use, 2025 to 2035
  • Figure 164: East Asia Market Y-o-Y Growth (%) Projections by End Use, 2025 to 2035
  • Figure 165: East Asia Market Attractiveness by Type, 2025 to 2035
  • Figure 166: East Asia Market Attractiveness by Technology, 2025 to 2035
  • Figure 167: East Asia Market Attractiveness by End Use, 2025 to 2035
  • Figure 168: East Asia Market Attractiveness by Country, 2025 to 2035
  • Figure 169: Middle East and Africa Market Value (USD billion) by Type, 2025 to 2035
  • Figure 170: Middle East and Africa Market Value (USD billion) by Technology, 2025 to 2035
  • Figure 171: Middle East and Africa Market Value (USD billion) by End Use, 2025 to 2035
  • Figure 172: Middle East and Africa Market Value (USD billion) by Country, 2025 to 2035
  • Figure 173: Middle East and Africa Market Value (USD billion) Analysis by Country, 2020 to 2035
  • Figure 174: Middle East and Africa Market Volume (Units) Analysis by Country, 2020 to 2035
  • Figure 175: Middle East and Africa Market Value Share (%) and BPS Analysis by Country, 2025 to 2035
  • Figure 176: Middle East and Africa Market Y-o-Y Growth (%) Projections by Country, 2025 to 2035
  • Figure 177: Middle East and Africa Market Value (USD billion) Analysis by Type, 2020 to 2035
  • Figure 178: Middle East and Africa Market Volume (Units) Analysis by Type, 2020 to 2035
  • Figure 179: Middle East and Africa Market Value Share (%) and BPS Analysis by Type, 2025 to 2035
  • Figure 180: Middle East and Africa Market Y-o-Y Growth (%) Projections by Type, 2025 to 2035
  • Figure 181: Middle East and Africa Market Value (USD billion) Analysis by Technology, 2020 to 2035
  • Figure 182: Middle East and Africa Market Volume (Units) Analysis by Technology, 2020 to 2035
  • Figure 183: Middle East and Africa Market Value Share (%) and BPS Analysis by Technology, 2025 to 2035
  • Figure 184: Middle East and Africa Market Y-o-Y Growth (%) Projections by Technology, 2025 to 2035
  • Figure 185: Middle East and Africa Market Value (USD billion) Analysis by End Use, 2020 to 2035
  • Figure 186: Middle East and Africa Market Volume (Units) Analysis by End Use, 2020 to 2035
  • Figure 187: Middle East and Africa Market Value Share (%) and BPS Analysis by End Use, 2025 to 2035
  • Figure 188: Middle East and Africa Market Y-o-Y Growth (%) Projections by End Use, 2025 to 2035
  • Figure 189: Middle East and Africa Market Attractiveness by Type, 2025 to 2035
  • Figure 190: Middle East and Africa Market Attractiveness by Technology, 2025 to 2035
  • Figure 191: Middle East and Africa Market Attractiveness by End Use, 2025 to 2035
  • Figure 192: Middle East and Africa Market Attractiveness by Country, 2025 to 2035

Frequently Asked Questions

What are the drivers of the welding material market growth?

The market is growing due to the rising industrialization, infrastructure growth, and use of automated welding technologies in industries such as automotive, aerospace, construction, and energy.

Which regions are dominant in the welding material market?

Asia-Pacific, but specifically China, Japan, and India, lead the market based on industrialization at a breakneck pace and infrastructure developments. Contributions also come from North America and Europe, based on technological advancements in automation and smart welding technologies.

What are the current trends in welding material?

The development of robotic and AI-based welding systems, the shift to environmentally friendly welding material, and the requirement for high-performance items to improve accuracy and efficiency are the main trends.

What are the challenges for the welding material market?

Some of the major challenges are unstable raw material prices, the requirement of skilled personnel, strict environmental regulations, and the high capital investment in automated welding systems.

Explore Similar Insights

Future Market Insights

Welding Material Market