Stud Welding Equipment Market Size and Share Forecast Outlook From 2024 to 2034

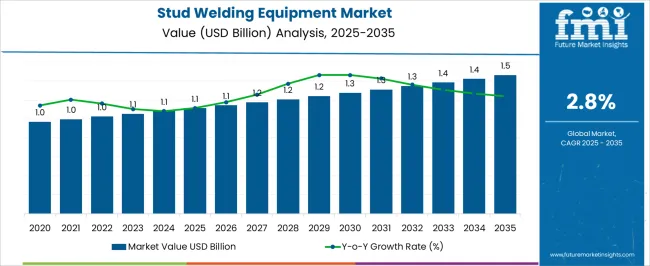
The global stud welding equipment market size is projected to surpass a valuation of USD 1,526.20 million by 2034. Sales of stud welding equipment are expected to expand at a CAGR of 2.90% through 2034, with a current valuation of USD 1,113.9 million in 2024.

Attributes Details
Stud Welding Equipment Market Size, 2023 USD 1,081.20 million
Stud Welding Equipment Market Size, 2024 USD 1,113.9 million
Projected Market Size, 2034 USD 1,526.20 million
Value-based CAGR (2024 to 2034) 2.90%

Top Stud Welding Equipment Market Dynamics and Industry Trends

Manufacturers Aim to Capture a Niche Segment by Developing Energy-efficient Solutions

Developing welding technology solutions that are energy-efficient, meet sustainability targets, and earn environmental credits and certifications is a strategic opportunity for market players. Equipment that helps fulfill energy efficiency criteria is frequently given priority by clients in sectors with strict sustainability regulations. Businesses can capitalize on the growing consumer focus on green certifications and sustainable manufacturing methods by marketing their products as energy-efficient and ecologically responsible.

Trend of Integrating Collaborative Robots in Stud Welding Operations

Collaborative robots, or cobots, are being strategically incorporated into stud welding processes to improve industrial safety and agility. Collaboration between humans and robots can provide firms with more operational flexibility, allowing them to adapt quickly to shifting needs for manufacturing. In addition to highlighting the value of flexible work conditions, this trend puts businesses at the forefront of technical advancements. It demonstrates their dedication to productivity, security, and forward-thinking production techniques.

Industry 4.0 Revolution Stimulates Wireless Connectivity Integration in Welding Equipment

Welding process equipment has strategically adapted to the Industry 4.0 revolution by integrating wireless communication characteristics. Through the provision of real-time monitoring, remote control, and data transmission, enterprises augment the flexibility and mobility of welding procedures. This trend portrays a dedication to digital transformation by offering solutions that meet the current industrial operations' needs for connectedness and agility. Businesses that integrate wireless connectivity into their stud welding equipment are demonstrating that they are forward-thinking in their approach to operational efficiency and responsiveness, positioning themselves as leaders in adopting cutting-edge technology.

Sales Trend Analysis from 2019 to 2023 Compared to Market Outlook for 2024 to 2034

Attributes Details
Stud Welding Equipment Market Size (2019) USD 953.2 million
Historical Market Size (2023) USD 1,081.20 million
Historical CAGR (2019 to 2023) 3.20%

The stud welding equipment market expanded at a 3.20% CAGR during the historical period from 2019 to 2023. The minor drop in the growth rate can be attributed to the slowdown in investment and project activities in certain regions. Nonetheless, the global economic boom and widespread industrialization have increased the demand for accurate and productive welding techniques. Stud welding is a common industrial technique used to attach parts in a variety of sectors, including electronics, appliances, and equipment. Consequently, the need for stud welding equipment is rising due to the growing manufacturing sector.

Existing infrastructure frequently needs repair and maintenance, which contributes to the continued demand for stud welding equipment in renovation and refurbishing projects. Several governments across the world are investing in large-scale infrastructure investments, such as roads, bridges, airports, and public buildings. Stud welding is a popular way to build these structures, raising the demand for stud welding equipment.

The market is expected to develop at a slightly lower CAGR of 2.90% over the next decade. The prefabrication trend in building and industry is projected to continue to rise. Arc stud welding, being a viable method for attaching prefabricated components, is likely to experience an increase in demand as companies embrace off-site building procedures. As companies seek ways to reduce weight in buildings and goods, demand for welding equipment capable of combining lightweight materials is likely to increase over the forecast period.

Lucrative Opportunities Driving Demand Growth in the Stud Welding Equipment Market

Trends
  • Businesses are considering subscription models and Equipment-as-a-Service (EaaS) solutions in response to changing market demands.
  • Collaborative robots are increasingly being used in welding technology solutions
  • The capacity to remotely monitor and control welding operations is becoming increasingly important, particularly in large-scale and complicated projects
  • The incorporation of modern technology and the Internet of Things (IoT) into welding equipment is a growing trend that enables improved monitoring, data collecting, and analysis
  • Businesses are proactively installing comprehensive cybersecurity safeguards in their stud welding equipment in accordance with industry best practices
Opportunities
  • As the emphasis on renewable energy sources grows, stud welding equipment could experience increased demand in the development and maintenance of renewable energy infrastructure
  • Given the tendency toward lightweight materials in numerous sectors, stud welding equipment can play an important role in connecting these materials
  • Incorporating Industry 4.0 concepts, such as IoT and data analytics, allows manufacturers to provide smart welding solutions, which contribute to enhanced efficiency and predictive maintenance capabilities
  • Integration of stud welding techniques with building information modeling (BIM) systems allows for improved project planning, coordination, and efficiency in building projects
  • The increased emphasis on offshore wind energy projects creates a demand for durable and corrosion-resistant stud welding solutions, providing a market expansion potential
Challenges
  • Traditional stud welding processes could be exposed to a threat from advances in substitute joining technologies or the introduction of disruptive technology
  • The initial cost of procuring stud welding equipment and providing sufficient operator training is often substantial, which can act as a barrier to entrance for certain organizations
  • Some stud welding equipment verticals could be hesitant to adopt Industry 4.0 technologies, restricting their capacity to exploit data analytics, automation, and other sophisticated features

Stud Welding Equipment Industry Analysis by Top Investment Segments

Transition to New Construction Methods Bolsters Demand in Metal Fabrication

Top End Use Metal Fabrication
Value Share (2024) 22.00%

The use of stud welding for quick and efficient procedures in metal fabrication is contributing to the segment’s growth. The stud welding process's speed is beneficial in achieving project deadlines, which is an important aspect in the fast-paced world of metal fabrication. The ever-growing trend toward prefabrication and modular building in metal fabrication fits well with stud welding capabilities. Its effectiveness in constructing prefabricated metal components supports the industry's transition to new construction methods.

Application in Heavy-duty Construction Projects Surging Demand for Arc Stud Welding

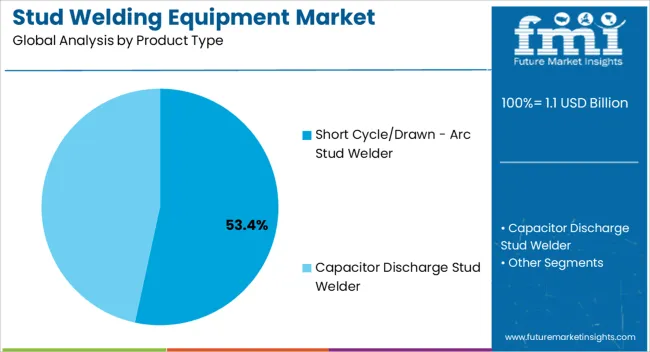
Top Product Type Arc Stud Welder
Value Share (2024) 29.00%

The popularity of arc stud welders is driven by their exceptional efficiency and quick welding capabilities. The speed with which it finishes welds is in sync with the desire for quick and simplified procedures in various sectors, strengthening its market dominance. Arc stud welding is in high demand because of its application in heavy-duty building projects. Its ability to form strong and long-lasting connections in large-scale building projects makes it a vital tool in the toolbox of builders and fabricators.

Analysis of Top Countries Manufacturing,Supplying,Using,and Exporting Stud Welding Equipment

Countries Value CAGR (2024 to 2034)
United States 2.50%
United Kingdom 2.50%
Germany 2.30%
India 3.60%
China 3.40%

Rising Use of Stud Welders Demand in Defense and Aerospace Industries in the United States

The demand for stud welding equipment in the United States is predicted to rise at a 2.50% CAGR through 2034. Due to significant developments in the defense and aerospace industries, stud welding machines are gaining significance in the United States market.

Stud welding methods' accuracy and durability make them necessary for manufacturing parts critical to national defense and aerospace applications, promoting long-term market growth. Additionally, the increased emphasis on strengthening manufacturing resilience in the United States drives up demand for stud welding equipment. Stud welding pops up as a vital component of a wider effort to enhance local manufacturing capabilities, harmonizing with the national objective for industrial resurrection.

Expansion of Offshore Wind Energy Projects and Maritime Infrastructure Nurtures Growth in the United Kingdom Market

Sales of stud welding equipment in the United Kingdom are projected to surge at a 2.50% CAGR through 2034. The broadening offshore wind energy projects and marine infrastructure expansions in the United Kingdom create a push for the proliferation of the stud welding equipment industry.

The toughness and endurance of stud welding make it a popular choice in constructing and maintaining structures in harsh maritime environments, adding to the momentum in these industries. Furthermore, the surge in demand for stud welding equipment in the United Kingdom is strongly related to the nation's concentration on high-speed rail and transportation projects. The capacity of stud welding to create quick and strong connections is vital in the development of critical infrastructure, supporting its crucial role in the developing landscape of transportation efforts.

Focus on Technological Leadership in Automotive Manufacturing Bolsters Demand in Germany

The analysis of the stud welding equipment market in Germany signifies expansion at a 2.30% CAGR through 2034. Germany's surge in demand for stud welding equipment is fueled by the country's dedication to technical leadership, notably in the automobile manufacturing industry.

The significance of stud welding in forming strong, lightweight connections is critical to the precise engineering necessary in Germany's modern vehicle manufacturing processes. Furthermore, the growing stud welding equipment market in Germany is driven by its adaptability to a wide range of metal alloys and its effectiveness in connecting complicated structures. Because of its adaptability, stud welding continues to be a versatile and favored solution for German companies involved in sophisticated and innovative production processes.

Rapid Growth in Renewable Energy Projects Foster Expansion in India

The stud welding equipment market size in India is projected to expand at a 3.60% CAGR through 2034. The fast expansion of renewable energy projects is driving the rapid rise of stud welding equipment in India.

The relevance of stud welding in the construction and maintenance of buildings for solar and wind energy installations makes it a critical technology in India's quest for sustainable energy alternatives. Furthermore, the momentum in India's stud welding equipment market is being bolstered by a greater emphasis on skill development in welding techniques. The technology gets greater acceptability as the workforce acquires proficiency in stud welding procedures, supporting its growing application in a variety of sectors.

Government-driven Urbanization and Mega-city Projects Drive the Market in China

The stud welding equipment market in China is predicted to rise at a 3.40% CAGR through 2034. In China, the growing demand for stud welding equipment is inextricably linked to government-led urbanization plans and mega-city developments.

Stud welding is emerging as a critical component in the efficient building of new urban areas, in line with China's ambitious aspirations for urban expansion and economic growth. Furthermore, advances in high-speed rail and transportation infrastructure are driving up demand for stud welding equipment in China. The effectiveness of stud welding in establishing strong connections helps the country's commitment to growing and updating its transportation networks, contributing to the sector's development.
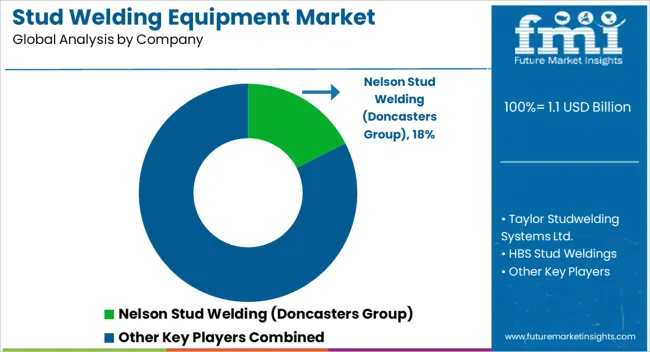
Leading Suppliers of Stud Welding Equipment

The stud welding equipment market's competitive landscape is defined by a dynamic interaction of prominent companies contending for market share and strategic positioning. Companies are engaged in an intensive rivalry typified by innovation, technical developments, and a focus on offering comprehensive welding solutions as demand for stud welding solutions continues to rise internationally. Established market giants are capitalizing on their deep knowledge and large distribution networks to preserve their dominance, while fresher competitors are attempting to carve out a niche through innovative technology and nimble business models.

Recent Developments in the Stud Welding Equipment Market

  • Ivostud GmbH recently completed the acquisition of OBTEC, a well-established brand in the stud welding sector, in September 2021. This strategic acquisition intends to offer OBTEC additional growth and expansion prospects.
  • HBS Bolzenschweiss-Systeme introduced its Visar 1200 stud welding equipment in September 2021. This unique device can weld steel, stainless steel, and aluminum. Furthermore, the Visar 1200 has a USB connector, allowing users to load and store welding applications easily.

Key Stud Welding Equipment Market Players and Concentration

  • Nelson Stud Welding (Doncasters Group)
  • Taylor Studwelding Systems Ltd.
  • HBS Stud Weldings
  • Soyer Group (ARO Technologies Inc.)
  • KÖCO - Kohlhoff & Co. GmbH
  • Tru-Weld Stud Welding
  • Stanley Engineered Fastening (STANLEY® Engineered Fastening brands: Nelson Fastener Systems, Tucker Stud Welding, Spiralock)
  • Heinz Soyer Bolzenschweißtechnik GmbH
  • Image Industries
  • Image Industries GmbH & Co. KG

Top Segments Studied in the Stud Welding Equipment Market Report

By Product Type:

  • Capacitor Discharge Stud Welder
  • Short Cycle/Drawn - Arc Stud Welder

By Operation:

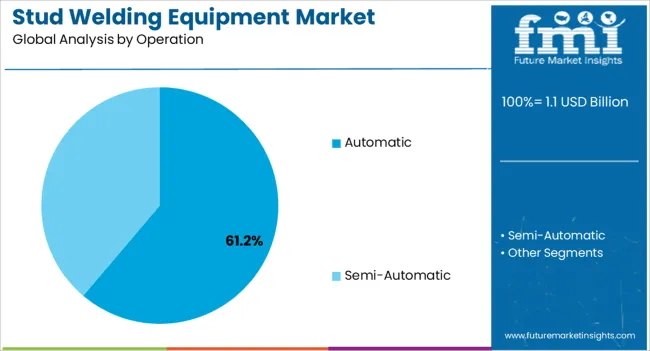
  • Automatic
  • Semi-automatic

By Stud Range:

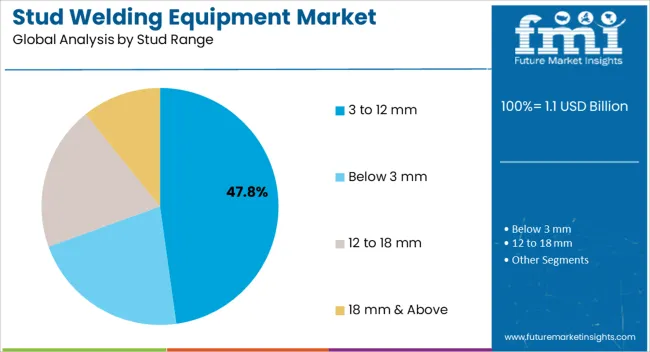
  • Below 3 mm
  • 3 to 12 mm
  • 12 to 18 mm
  • 18 mm & Above

By End Use/End-use Industry:

  • Automotive
  • Construction
  • Metal Fabrication
  • Decorative and Consumer Item
  • Electric Item
  • Furniture
  • Shipbuilding
  • Others

By Region:

  • North America
  • Latin America
  • Western Europe
  • Eastern Europe
  • Asia Pacific (APAC)
  • Middle East & Africa (MEA)
  • Japan

Table of Content

  • 1. Executive Summary
  • 2. Market Overview
  • 3. Market Background
  • 4. Global Market Analysis 2019 to 2023 and Forecast, 2024 to 2034
  • 5. Global Market Analysis 2019 to 2023 and Forecast 2024 to 2034, By Type of Arc Ignition
    • 5.1. Capacitor Discharge Stud Welding
    • 5.2. Drawn Arc Stud Welding
  • 6. Global Market Analysis 2019 to 2023 and Forecast 2024 to 2034, By Material
    • 6.1. Steel
    • 6.2. Aluminium
    • 6.3. Copper
    • 6.4. Brass
  • 7. Global Market Analysis 2019 to 2023 and Forecast 2024 to 2034, By Stud Diameter
    • 7.1. Below 3 mm
    • 7.2. 3-12 mm
    • 7.3. 12-18 mm
    • 7.4. 18 mm and above
  • 8. Global Market Analysis 2019 to 2023 and Forecast 2024 to 2034, By Operation
    • 8.1. Automatic
    • 8.2. Semi-automatic
  • 9. Global Market Analysis 2019 to 2023 and Forecast 2024 to 2034, By End-use Industry
    • 9.1. Automotive
    • 9.2. Shipbuilding
    • 9.3. Electric Goods
    • 9.4. Construction
    • 9.5. Farm
    • 9.6. Others
  • 10. Global Market Analysis 2019 to 2023 and Forecast 2024 to 2034, By Region
    • 10.1. North America
    • 10.2. Latin America
    • 10.3. Europe
    • 10.4. East Asia
    • 10.5. South Asia
    • 10.6. Oceania
    • 10.7. MEA
  • 11. North America Market Analysis 2019 to 2023 and Forecast 2024 to 2034, By Country
  • 12. Latin America Market Analysis 2019 to 2023 and Forecast 2024 to 2034, By Country
  • 13. Europe Market Analysis 2019 to 2023 and Forecast 2024 to 2034, By Country
  • 14. East Asia Market Analysis 2019 to 2023 and Forecast 2024 to 2034, By Country
  • 15. South Asia Market Analysis 2019 to 2023 and Forecast 2024 to 2034, By Country
  • 16. Oceania Market Analysis 2019 to 2023 and Forecast 2024 to 2034, By Country
  • 17. MEA Market Analysis 2019 to 2023 and Forecast 2024 to 2034, By Country
  • 18. Key Countries Market Analysis
  • 19. Market Structure Analysis
  • 20. Competition Analysis
    • 20.1. TFP Corporation
    • 20.2. STANLEY Engineered Fastening
    • 20.3. Bolte GmbH
    • 20.4. ChangZhou Jinda Welding Co., Ltd
    • 20.5. Cruxweld Industrial Equipments Private Limited
    • 20.6. HEINZ SOYER
    • 20.7. Midwest Fasteners Inc
    • 20.8. KÖSTER & CO. GMBH
    • 20.9. Taylor Studwelding Systems Ltd
    • 20.10. HBS Bolzenschweiss-Systeme GmbH & Co. KG
  • 21. Assumptions & Acronyms Used
  • 22. Research Methodology

List of Tables

Table 1: Global Market Value (US$ Million) Forecast by Region, 2019 to 2034

Table 2: Global Market Volume (Units) Forecast by Region, 2019 to 2034

Table 3: Global Market Value (US$ Million) Forecast by Type of Arc Ignition, 2019 to 2034

Table 4: Global Market Volume (Units) Forecast by Type of Arc Ignition, 2019 to 2034

Table 5: Global Market Value (US$ Million) Forecast by Material, 2019 to 2034

Table 6: Global Market Volume (Units) Forecast by Material, 2019 to 2034

Table 7: Global Market Value (US$ Million) Forecast by Stud Diameter, 2019 to 2034

Table 8: Global Market Volume (Units) Forecast by Stud Diameter, 2019 to 2034

Table 9: Global Market Value (US$ Million) Forecast by Operation, 2019 to 2034

Table 10: Global Market Volume (Units) Forecast by Operation, 2019 to 2034

Table 11: Global Market Value (US$ Million) Forecast by End-use Industry, 2019 to 2034

Table 12: Global Market Volume (Units) Forecast by End-use Industry, 2019 to 2034

Table 13: North America Market Value (US$ Million) Forecast by Country, 2019 to 2034

Table 14: North America Market Volume (Units) Forecast by Country, 2019 to 2034

Table 15: North America Market Value (US$ Million) Forecast by Type of Arc Ignition, 2019 to 2034

Table 16: North America Market Volume (Units) Forecast by Type of Arc Ignition, 2019 to 2034

Table 17: North America Market Value (US$ Million) Forecast by Material, 2019 to 2034

Table 18: North America Market Volume (Units) Forecast by Material, 2019 to 2034

Table 19: North America Market Value (US$ Million) Forecast by Stud Diameter, 2019 to 2034

Table 20: North America Market Volume (Units) Forecast by Stud Diameter, 2019 to 2034

Table 21: North America Market Value (US$ Million) Forecast by Operation, 2019 to 2034

Table 22: North America Market Volume (Units) Forecast by Operation, 2019 to 2034

Table 23: North America Market Value (US$ Million) Forecast by End-use Industry, 2019 to 2034

Table 24: North America Market Volume (Units) Forecast by End-use Industry, 2019 to 2034

Table 25: Latin America Market Value (US$ Million) Forecast by Country, 2019 to 2034

Table 26: Latin America Market Volume (Units) Forecast by Country, 2019 to 2034

Table 27: Latin America Market Value (US$ Million) Forecast by Type of Arc Ignition, 2019 to 2034

Table 28: Latin America Market Volume (Units) Forecast by Type of Arc Ignition, 2019 to 2034

Table 29: Latin America Market Value (US$ Million) Forecast by Material, 2019 to 2034

Table 30: Latin America Market Volume (Units) Forecast by Material, 2019 to 2034

Table 31: Latin America Market Value (US$ Million) Forecast by Stud Diameter, 2019 to 2034

Table 32: Latin America Market Volume (Units) Forecast by Stud Diameter, 2019 to 2034

Table 33: Latin America Market Value (US$ Million) Forecast by Operation, 2019 to 2034

Table 34: Latin America Market Volume (Units) Forecast by Operation, 2019 to 2034

Table 35: Latin America Market Value (US$ Million) Forecast by End-use Industry, 2019 to 2034

Table 36: Latin America Market Volume (Units) Forecast by End-use Industry, 2019 to 2034

Table 37: Europe Market Value (US$ Million) Forecast by Country, 2019 to 2034

Table 38: Europe Market Volume (Units) Forecast by Country, 2019 to 2034

Table 39: Europe Market Value (US$ Million) Forecast by Type of Arc Ignition, 2019 to 2034

Table 40: Europe Market Volume (Units) Forecast by Type of Arc Ignition, 2019 to 2034

Table 41: Europe Market Value (US$ Million) Forecast by Material, 2019 to 2034

Table 42: Europe Market Volume (Units) Forecast by Material, 2019 to 2034

Table 43: Europe Market Value (US$ Million) Forecast by Stud Diameter, 2019 to 2034

Table 44: Europe Market Volume (Units) Forecast by Stud Diameter, 2019 to 2034

Table 45: Europe Market Value (US$ Million) Forecast by Operation, 2019 to 2034

Table 46: Europe Market Volume (Units) Forecast by Operation, 2019 to 2034

Table 47: Europe Market Value (US$ Million) Forecast by End-use Industry, 2019 to 2034

Table 48: Europe Market Volume (Units) Forecast by End-use Industry, 2019 to 2034

Table 49: East Asia Market Value (US$ Million) Forecast by Country, 2019 to 2034

Table 50: East Asia Market Volume (Units) Forecast by Country, 2019 to 2034

Table 51: East Asia Market Value (US$ Million) Forecast by Type of Arc Ignition, 2019 to 2034

Table 52: East Asia Market Volume (Units) Forecast by Type of Arc Ignition, 2019 to 2034

Table 53: East Asia Market Value (US$ Million) Forecast by Material, 2019 to 2034

Table 54: East Asia Market Volume (Units) Forecast by Material, 2019 to 2034

Table 55: East Asia Market Value (US$ Million) Forecast by Stud Diameter, 2019 to 2034

Table 56: East Asia Market Volume (Units) Forecast by Stud Diameter, 2019 to 2034

Table 57: East Asia Market Value (US$ Million) Forecast by Operation, 2019 to 2034

Table 58: East Asia Market Volume (Units) Forecast by Operation, 2019 to 2034

Table 59: East Asia Market Value (US$ Million) Forecast by End-use Industry, 2019 to 2034

Table 60: East Asia Market Volume (Units) Forecast by End-use Industry, 2019 to 2034

Table 61: South Asia Market Value (US$ Million) Forecast by Country, 2019 to 2034

Table 62: South Asia Market Volume (Units) Forecast by Country, 2019 to 2034

Table 63: South Asia Market Value (US$ Million) Forecast by Type of Arc Ignition, 2019 to 2034

Table 64: South Asia Market Volume (Units) Forecast by Type of Arc Ignition, 2019 to 2034

Table 65: South Asia Market Value (US$ Million) Forecast by Material, 2019 to 2034

Table 66: South Asia Market Volume (Units) Forecast by Material, 2019 to 2034

Table 67: South Asia Market Value (US$ Million) Forecast by Stud Diameter, 2019 to 2034

Table 68: South Asia Market Volume (Units) Forecast by Stud Diameter, 2019 to 2034

Table 69: South Asia Market Value (US$ Million) Forecast by Operation, 2019 to 2034

Table 70: South Asia Market Volume (Units) Forecast by Operation, 2019 to 2034

Table 71: South Asia Market Value (US$ Million) Forecast by End-use Industry, 2019 to 2034

Table 72: South Asia Market Volume (Units) Forecast by End-use Industry, 2019 to 2034

Table 73: Oceania Market Value (US$ Million) Forecast by Country, 2019 to 2034

Table 74: Oceania Market Volume (Units) Forecast by Country, 2019 to 2034

Table 75: Oceania Market Value (US$ Million) Forecast by Type of Arc Ignition, 2019 to 2034

Table 76: Oceania Market Volume (Units) Forecast by Type of Arc Ignition, 2019 to 2034

Table 77: Oceania Market Value (US$ Million) Forecast by Material, 2019 to 2034

Table 78: Oceania Market Volume (Units) Forecast by Material, 2019 to 2034

Table 79: Oceania Market Value (US$ Million) Forecast by Stud Diameter, 2019 to 2034

Table 80: Oceania Market Volume (Units) Forecast by Stud Diameter, 2019 to 2034

Table 81: Oceania Market Value (US$ Million) Forecast by Operation, 2019 to 2034

Table 82: Oceania Market Volume (Units) Forecast by Operation, 2019 to 2034

Table 83: Oceania Market Value (US$ Million) Forecast by End-use Industry, 2019 to 2034

Table 84: Oceania Market Volume (Units) Forecast by End-use Industry, 2019 to 2034

Table 85: MEA Market Value (US$ Million) Forecast by Country, 2019 to 2034

Table 86: MEA Market Volume (Units) Forecast by Country, 2019 to 2034

Table 87: MEA Market Value (US$ Million) Forecast by Type of Arc Ignition, 2019 to 2034

Table 88: MEA Market Volume (Units) Forecast by Type of Arc Ignition, 2019 to 2034

Table 89: MEA Market Value (US$ Million) Forecast by Material, 2019 to 2034

Table 90: MEA Market Volume (Units) Forecast by Material, 2019 to 2034

Table 91: MEA Market Value (US$ Million) Forecast by Stud Diameter, 2019 to 2034

Table 92: MEA Market Volume (Units) Forecast by Stud Diameter, 2019 to 2034

Table 93: MEA Market Value (US$ Million) Forecast by Operation, 2019 to 2034

Table 94: MEA Market Volume (Units) Forecast by Operation, 2019 to 2034

Table 95: MEA Market Value (US$ Million) Forecast by End-use Industry, 2019 to 2034

Table 96: MEA Market Volume (Units) Forecast by End-use Industry, 2019 to 2034

List of Figures

Figure 1: Global Market Value (US$ Million) by Type of Arc Ignition, 2024 to 2034

Figure 2: Global Market Value (US$ Million) by Material, 2024 to 2034

Figure 3: Global Market Value (US$ Million) by Stud Diameter, 2024 to 2034

Figure 4: Global Market Value (US$ Million) by Operation, 2024 to 2034

Figure 5: Global Market Value (US$ Million) by End-use Industry, 2024 to 2034

Figure 6: Global Market Value (US$ Million) by Region, 2024 to 2034

Figure 7: Global Market Value (US$ Million) Analysis by Region, 2019 to 2034

Figure 8: Global Market Volume (Units) Analysis by Region, 2019 to 2034

Figure 9: Global Market Value Share (%) and BPS Analysis by Region, 2024 to 2034

Figure 10: Global Market Y-o-Y Growth (%) Projections by Region, 2024 to 2034

Figure 11: Global Market Value (US$ Million) Analysis by Type of Arc Ignition, 2019 to 2034

Figure 12: Global Market Volume (Units) Analysis by Type of Arc Ignition, 2019 to 2034

Figure 13: Global Market Value Share (%) and BPS Analysis by Type of Arc Ignition, 2024 to 2034

Figure 14: Global Market Y-o-Y Growth (%) Projections by Type of Arc Ignition, 2024 to 2034

Figure 15: Global Market Value (US$ Million) Analysis by Material, 2019 to 2034

Figure 16: Global Market Volume (Units) Analysis by Material, 2019 to 2034

Figure 17: Global Market Value Share (%) and BPS Analysis by Material, 2024 to 2034

Figure 18: Global Market Y-o-Y Growth (%) Projections by Material, 2024 to 2034

Figure 19: Global Market Value (US$ Million) Analysis by Stud Diameter, 2019 to 2034

Figure 20: Global Market Volume (Units) Analysis by Stud Diameter, 2019 to 2034

Figure 21: Global Market Value Share (%) and BPS Analysis by Stud Diameter, 2024 to 2034

Figure 22: Global Market Y-o-Y Growth (%) Projections by Stud Diameter, 2024 to 2034

Figure 23: Global Market Value (US$ Million) Analysis by Operation, 2019 to 2034

Figure 24: Global Market Volume (Units) Analysis by Operation, 2019 to 2034

Figure 25: Global Market Value Share (%) and BPS Analysis by Operation, 2024 to 2034

Figure 26: Global Market Y-o-Y Growth (%) Projections by Operation, 2024 to 2034

Figure 27: Global Market Value (US$ Million) Analysis by End-use Industry, 2019 to 2034

Figure 28: Global Market Volume (Units) Analysis by End-use Industry, 2019 to 2034

Figure 29: Global Market Value Share (%) and BPS Analysis by End-use Industry, 2024 to 2034

Figure 30: Global Market Y-o-Y Growth (%) Projections by End-use Industry, 2024 to 2034

Figure 31: Global Market Attractiveness by Type of Arc Ignition, 2024 to 2034

Figure 32: Global Market Attractiveness by Material, 2024 to 2034

Figure 33: Global Market Attractiveness by Stud Diameter, 2024 to 2034

Figure 34: Global Market Attractiveness by Operation, 2024 to 2034

Figure 35: Global Market Attractiveness by End-use Industry, 2024 to 2034

Figure 36: Global Market Attractiveness by Region, 2024 to 2034

Figure 37: North America Market Value (US$ Million) by Type of Arc Ignition, 2024 to 2034

Figure 38: North America Market Value (US$ Million) by Material, 2024 to 2034

Figure 39: North America Market Value (US$ Million) by Stud Diameter, 2024 to 2034

Figure 40: North America Market Value (US$ Million) by Operation, 2024 to 2034

Figure 41: North America Market Value (US$ Million) by End-use Industry, 2024 to 2034

Figure 42: North America Market Value (US$ Million) by Country, 2024 to 2034

Figure 43: North America Market Value (US$ Million) Analysis by Country, 2019 to 2034

Figure 44: North America Market Volume (Units) Analysis by Country, 2019 to 2034

Figure 45: North America Market Value Share (%) and BPS Analysis by Country, 2024 to 2034

Figure 46: North America Market Y-o-Y Growth (%) Projections by Country, 2024 to 2034

Figure 47: North America Market Value (US$ Million) Analysis by Type of Arc Ignition, 2019 to 2034

Figure 48: North America Market Volume (Units) Analysis by Type of Arc Ignition, 2019 to 2034

Figure 49: North America Market Value Share (%) and BPS Analysis by Type of Arc Ignition, 2024 to 2034

Figure 50: North America Market Y-o-Y Growth (%) Projections by Type of Arc Ignition, 2024 to 2034

Figure 51: North America Market Value (US$ Million) Analysis by Material, 2019 to 2034

Figure 52: North America Market Volume (Units) Analysis by Material, 2019 to 2034

Figure 53: North America Market Value Share (%) and BPS Analysis by Material, 2024 to 2034

Figure 54: North America Market Y-o-Y Growth (%) Projections by Material, 2024 to 2034

Figure 55: North America Market Value (US$ Million) Analysis by Stud Diameter, 2019 to 2034

Figure 56: North America Market Volume (Units) Analysis by Stud Diameter, 2019 to 2034

Figure 57: North America Market Value Share (%) and BPS Analysis by Stud Diameter, 2024 to 2034

Figure 58: North America Market Y-o-Y Growth (%) Projections by Stud Diameter, 2024 to 2034

Figure 59: North America Market Value (US$ Million) Analysis by Operation, 2019 to 2034

Figure 60: North America Market Volume (Units) Analysis by Operation, 2019 to 2034

Figure 61: North America Market Value Share (%) and BPS Analysis by Operation, 2024 to 2034

Figure 62: North America Market Y-o-Y Growth (%) Projections by Operation, 2024 to 2034

Figure 63: North America Market Value (US$ Million) Analysis by End-use Industry, 2019 to 2034

Figure 64: North America Market Volume (Units) Analysis by End-use Industry, 2019 to 2034

Figure 65: North America Market Value Share (%) and BPS Analysis by End-use Industry, 2024 to 2034

Figure 66: North America Market Y-o-Y Growth (%) Projections by End-use Industry, 2024 to 2034

Figure 67: North America Market Attractiveness by Type of Arc Ignition, 2024 to 2034

Figure 68: North America Market Attractiveness by Material, 2024 to 2034

Figure 69: North America Market Attractiveness by Stud Diameter, 2024 to 2034

Figure 70: North America Market Attractiveness by Operation, 2024 to 2034

Figure 71: North America Market Attractiveness by End-use Industry, 2024 to 2034

Figure 72: North America Market Attractiveness by Country, 2024 to 2034

Figure 73: Latin America Market Value (US$ Million) by Type of Arc Ignition, 2024 to 2034

Figure 74: Latin America Market Value (US$ Million) by Material, 2024 to 2034

Figure 75: Latin America Market Value (US$ Million) by Stud Diameter, 2024 to 2034

Figure 76: Latin America Market Value (US$ Million) by Operation, 2024 to 2034

Figure 77: Latin America Market Value (US$ Million) by End-use Industry, 2024 to 2034

Figure 78: Latin America Market Value (US$ Million) by Country, 2024 to 2034

Figure 79: Latin America Market Value (US$ Million) Analysis by Country, 2019 to 2034

Figure 80: Latin America Market Volume (Units) Analysis by Country, 2019 to 2034

Figure 81: Latin America Market Value Share (%) and BPS Analysis by Country, 2024 to 2034

Figure 82: Latin America Market Y-o-Y Growth (%) Projections by Country, 2024 to 2034

Figure 83: Latin America Market Value (US$ Million) Analysis by Type of Arc Ignition, 2019 to 2034

Figure 84: Latin America Market Volume (Units) Analysis by Type of Arc Ignition, 2019 to 2034

Figure 85: Latin America Market Value Share (%) and BPS Analysis by Type of Arc Ignition, 2024 to 2034

Figure 86: Latin America Market Y-o-Y Growth (%) Projections by Type of Arc Ignition, 2024 to 2034

Figure 87: Latin America Market Value (US$ Million) Analysis by Material, 2019 to 2034

Figure 88: Latin America Market Volume (Units) Analysis by Material, 2019 to 2034

Figure 89: Latin America Market Value Share (%) and BPS Analysis by Material, 2024 to 2034

Figure 90: Latin America Market Y-o-Y Growth (%) Projections by Material, 2024 to 2034

Figure 91: Latin America Market Value (US$ Million) Analysis by Stud Diameter, 2019 to 2034

Figure 92: Latin America Market Volume (Units) Analysis by Stud Diameter, 2019 to 2034

Figure 93: Latin America Market Value Share (%) and BPS Analysis by Stud Diameter, 2024 to 2034

Figure 94: Latin America Market Y-o-Y Growth (%) Projections by Stud Diameter, 2024 to 2034

Figure 95: Latin America Market Value (US$ Million) Analysis by Operation, 2019 to 2034

Figure 96: Latin America Market Volume (Units) Analysis by Operation, 2019 to 2034

Figure 97: Latin America Market Value Share (%) and BPS Analysis by Operation, 2024 to 2034

Figure 98: Latin America Market Y-o-Y Growth (%) Projections by Operation, 2024 to 2034

Figure 99: Latin America Market Value (US$ Million) Analysis by End-use Industry, 2019 to 2034

Figure 100: Latin America Market Volume (Units) Analysis by End-use Industry, 2019 to 2034

Figure 101: Latin America Market Value Share (%) and BPS Analysis by End-use Industry, 2024 to 2034

Figure 102: Latin America Market Y-o-Y Growth (%) Projections by End-use Industry, 2024 to 2034

Figure 103: Latin America Market Attractiveness by Type of Arc Ignition, 2024 to 2034

Figure 104: Latin America Market Attractiveness by Material, 2024 to 2034

Figure 105: Latin America Market Attractiveness by Stud Diameter, 2024 to 2034

Figure 106: Latin America Market Attractiveness by Operation, 2024 to 2034

Figure 107: Latin America Market Attractiveness by End-use Industry, 2024 to 2034

Figure 108: Latin America Market Attractiveness by Country, 2024 to 2034

Figure 109: Europe Market Value (US$ Million) by Type of Arc Ignition, 2024 to 2034

Figure 110: Europe Market Value (US$ Million) by Material, 2024 to 2034

Figure 111: Europe Market Value (US$ Million) by Stud Diameter, 2024 to 2034

Figure 112: Europe Market Value (US$ Million) by Operation, 2024 to 2034

Figure 113: Europe Market Value (US$ Million) by End-use Industry, 2024 to 2034

Figure 114: Europe Market Value (US$ Million) by Country, 2024 to 2034

Figure 115: Europe Market Value (US$ Million) Analysis by Country, 2019 to 2034

Figure 116: Europe Market Volume (Units) Analysis by Country, 2019 to 2034

Figure 117: Europe Market Value Share (%) and BPS Analysis by Country, 2024 to 2034

Figure 118: Europe Market Y-o-Y Growth (%) Projections by Country, 2024 to 2034

Figure 119: Europe Market Value (US$ Million) Analysis by Type of Arc Ignition, 2019 to 2034

Figure 120: Europe Market Volume (Units) Analysis by Type of Arc Ignition, 2019 to 2034

Figure 121: Europe Market Value Share (%) and BPS Analysis by Type of Arc Ignition, 2024 to 2034

Figure 122: Europe Market Y-o-Y Growth (%) Projections by Type of Arc Ignition, 2024 to 2034

Figure 123: Europe Market Value (US$ Million) Analysis by Material, 2019 to 2034

Figure 124: Europe Market Volume (Units) Analysis by Material, 2019 to 2034

Figure 125: Europe Market Value Share (%) and BPS Analysis by Material, 2024 to 2034

Figure 126: Europe Market Y-o-Y Growth (%) Projections by Material, 2024 to 2034

Figure 127: Europe Market Value (US$ Million) Analysis by Stud Diameter, 2019 to 2034

Figure 128: Europe Market Volume (Units) Analysis by Stud Diameter, 2019 to 2034

Figure 129: Europe Market Value Share (%) and BPS Analysis by Stud Diameter, 2024 to 2034

Figure 130: Europe Market Y-o-Y Growth (%) Projections by Stud Diameter, 2024 to 2034

Figure 131: Europe Market Value (US$ Million) Analysis by Operation, 2019 to 2034

Figure 132: Europe Market Volume (Units) Analysis by Operation, 2019 to 2034

Figure 133: Europe Market Value Share (%) and BPS Analysis by Operation, 2024 to 2034

Figure 134: Europe Market Y-o-Y Growth (%) Projections by Operation, 2024 to 2034

Figure 135: Europe Market Value (US$ Million) Analysis by End-use Industry, 2019 to 2034

Figure 136: Europe Market Volume (Units) Analysis by End-use Industry, 2019 to 2034

Figure 137: Europe Market Value Share (%) and BPS Analysis by End-use Industry, 2024 to 2034

Figure 138: Europe Market Y-o-Y Growth (%) Projections by End-use Industry, 2024 to 2034

Figure 139: Europe Market Attractiveness by Type of Arc Ignition, 2024 to 2034

Figure 140: Europe Market Attractiveness by Material, 2024 to 2034

Figure 141: Europe Market Attractiveness by Stud Diameter, 2024 to 2034

Figure 142: Europe Market Attractiveness by Operation, 2024 to 2034

Figure 143: Europe Market Attractiveness by End-use Industry, 2024 to 2034

Figure 144: Europe Market Attractiveness by Country, 2024 to 2034

Figure 145: East Asia Market Value (US$ Million) by Type of Arc Ignition, 2024 to 2034

Figure 146: East Asia Market Value (US$ Million) by Material, 2024 to 2034

Figure 147: East Asia Market Value (US$ Million) by Stud Diameter, 2024 to 2034

Figure 148: East Asia Market Value (US$ Million) by Operation, 2024 to 2034

Figure 149: East Asia Market Value (US$ Million) by End-use Industry, 2024 to 2034

Figure 150: East Asia Market Value (US$ Million) by Country, 2024 to 2034

Figure 151: East Asia Market Value (US$ Million) Analysis by Country, 2019 to 2034

Figure 152: East Asia Market Volume (Units) Analysis by Country, 2019 to 2034

Figure 153: East Asia Market Value Share (%) and BPS Analysis by Country, 2024 to 2034

Figure 154: East Asia Market Y-o-Y Growth (%) Projections by Country, 2024 to 2034

Figure 155: East Asia Market Value (US$ Million) Analysis by Type of Arc Ignition, 2019 to 2034

Figure 156: East Asia Market Volume (Units) Analysis by Type of Arc Ignition, 2019 to 2034

Figure 157: East Asia Market Value Share (%) and BPS Analysis by Type of Arc Ignition, 2024 to 2034

Figure 158: East Asia Market Y-o-Y Growth (%) Projections by Type of Arc Ignition, 2024 to 2034

Figure 159: East Asia Market Value (US$ Million) Analysis by Material, 2019 to 2034

Figure 160: East Asia Market Volume (Units) Analysis by Material, 2019 to 2034

Figure 161: East Asia Market Value Share (%) and BPS Analysis by Material, 2024 to 2034

Figure 162: East Asia Market Y-o-Y Growth (%) Projections by Material, 2024 to 2034

Figure 163: East Asia Market Value (US$ Million) Analysis by Stud Diameter, 2019 to 2034

Figure 164: East Asia Market Volume (Units) Analysis by Stud Diameter, 2019 to 2034

Figure 165: East Asia Market Value Share (%) and BPS Analysis by Stud Diameter, 2024 to 2034

Figure 166: East Asia Market Y-o-Y Growth (%) Projections by Stud Diameter, 2024 to 2034

Figure 167: East Asia Market Value (US$ Million) Analysis by Operation, 2019 to 2034

Figure 168: East Asia Market Volume (Units) Analysis by Operation, 2019 to 2034

Figure 169: East Asia Market Value Share (%) and BPS Analysis by Operation, 2024 to 2034

Figure 170: East Asia Market Y-o-Y Growth (%) Projections by Operation, 2024 to 2034

Figure 171: East Asia Market Value (US$ Million) Analysis by End-use Industry, 2019 to 2034

Figure 172: East Asia Market Volume (Units) Analysis by End-use Industry, 2019 to 2034

Figure 173: East Asia Market Value Share (%) and BPS Analysis by End-use Industry, 2024 to 2034

Figure 174: East Asia Market Y-o-Y Growth (%) Projections by End-use Industry, 2024 to 2034

Figure 175: East Asia Market Attractiveness by Type of Arc Ignition, 2024 to 2034

Figure 176: East Asia Market Attractiveness by Material, 2024 to 2034

Figure 177: East Asia Market Attractiveness by Stud Diameter, 2024 to 2034

Figure 178: East Asia Market Attractiveness by Operation, 2024 to 2034

Figure 179: East Asia Market Attractiveness by End-use Industry, 2024 to 2034

Figure 180: East Asia Market Attractiveness by Country, 2024 to 2034

Figure 181: South Asia Market Value (US$ Million) by Type of Arc Ignition, 2024 to 2034

Figure 182: South Asia Market Value (US$ Million) by Material, 2024 to 2034

Figure 183: South Asia Market Value (US$ Million) by Stud Diameter, 2024 to 2034

Figure 184: South Asia Market Value (US$ Million) by Operation, 2024 to 2034

Figure 185: South Asia Market Value (US$ Million) by End-use Industry, 2024 to 2034

Figure 186: South Asia Market Value (US$ Million) by Country, 2024 to 2034

Figure 187: South Asia Market Value (US$ Million) Analysis by Country, 2019 to 2034

Figure 188: South Asia Market Volume (Units) Analysis by Country, 2019 to 2034

Figure 189: South Asia Market Value Share (%) and BPS Analysis by Country, 2024 to 2034

Figure 190: South Asia Market Y-o-Y Growth (%) Projections by Country, 2024 to 2034

Figure 191: South Asia Market Value (US$ Million) Analysis by Type of Arc Ignition, 2019 to 2034

Figure 192: South Asia Market Volume (Units) Analysis by Type of Arc Ignition, 2019 to 2034

Figure 193: South Asia Market Value Share (%) and BPS Analysis by Type of Arc Ignition, 2024 to 2034

Figure 194: South Asia Market Y-o-Y Growth (%) Projections by Type of Arc Ignition, 2024 to 2034

Figure 195: South Asia Market Value (US$ Million) Analysis by Material, 2019 to 2034

Figure 196: South Asia Market Volume (Units) Analysis by Material, 2019 to 2034

Figure 197: South Asia Market Value Share (%) and BPS Analysis by Material, 2024 to 2034

Figure 198: South Asia Market Y-o-Y Growth (%) Projections by Material, 2024 to 2034

Figure 199: South Asia Market Value (US$ Million) Analysis by Stud Diameter, 2019 to 2034

Figure 200: South Asia Market Volume (Units) Analysis by Stud Diameter, 2019 to 2034

Figure 201: South Asia Market Value Share (%) and BPS Analysis by Stud Diameter, 2024 to 2034

Figure 202: South Asia Market Y-o-Y Growth (%) Projections by Stud Diameter, 2024 to 2034

Figure 203: South Asia Market Value (US$ Million) Analysis by Operation, 2019 to 2034

Figure 204: South Asia Market Volume (Units) Analysis by Operation, 2019 to 2034

Figure 205: South Asia Market Value Share (%) and BPS Analysis by Operation, 2024 to 2034

Figure 206: South Asia Market Y-o-Y Growth (%) Projections by Operation, 2024 to 2034

Figure 207: South Asia Market Value (US$ Million) Analysis by End-use Industry, 2019 to 2034

Figure 208: South Asia Market Volume (Units) Analysis by End-use Industry, 2019 to 2034

Figure 209: South Asia Market Value Share (%) and BPS Analysis by End-use Industry, 2024 to 2034

Figure 210: South Asia Market Y-o-Y Growth (%) Projections by End-use Industry, 2024 to 2034

Figure 211: South Asia Market Attractiveness by Type of Arc Ignition, 2024 to 2034

Figure 212: South Asia Market Attractiveness by Material, 2024 to 2034

Figure 213: South Asia Market Attractiveness by Stud Diameter, 2024 to 2034

Figure 214: South Asia Market Attractiveness by Operation, 2024 to 2034

Figure 215: South Asia Market Attractiveness by End-use Industry, 2024 to 2034

Figure 216: South Asia Market Attractiveness by Country, 2024 to 2034

Figure 217: Oceania Market Value (US$ Million) by Type of Arc Ignition, 2024 to 2034

Figure 218: Oceania Market Value (US$ Million) by Material, 2024 to 2034

Figure 219: Oceania Market Value (US$ Million) by Stud Diameter, 2024 to 2034

Figure 220: Oceania Market Value (US$ Million) by Operation, 2024 to 2034

Figure 221: Oceania Market Value (US$ Million) by End-use Industry, 2024 to 2034

Figure 222: Oceania Market Value (US$ Million) by Country, 2024 to 2034

Figure 223: Oceania Market Value (US$ Million) Analysis by Country, 2019 to 2034

Figure 224: Oceania Market Volume (Units) Analysis by Country, 2019 to 2034

Figure 225: Oceania Market Value Share (%) and BPS Analysis by Country, 2024 to 2034

Figure 226: Oceania Market Y-o-Y Growth (%) Projections by Country, 2024 to 2034

Figure 227: Oceania Market Value (US$ Million) Analysis by Type of Arc Ignition, 2019 to 2034

Figure 228: Oceania Market Volume (Units) Analysis by Type of Arc Ignition, 2019 to 2034

Figure 229: Oceania Market Value Share (%) and BPS Analysis by Type of Arc Ignition, 2024 to 2034

Figure 230: Oceania Market Y-o-Y Growth (%) Projections by Type of Arc Ignition, 2024 to 2034

Figure 231: Oceania Market Value (US$ Million) Analysis by Material, 2019 to 2034

Figure 232: Oceania Market Volume (Units) Analysis by Material, 2019 to 2034

Figure 233: Oceania Market Value Share (%) and BPS Analysis by Material, 2024 to 2034

Figure 234: Oceania Market Y-o-Y Growth (%) Projections by Material, 2024 to 2034

Figure 235: Oceania Market Value (US$ Million) Analysis by Stud Diameter, 2019 to 2034

Figure 236: Oceania Market Volume (Units) Analysis by Stud Diameter, 2019 to 2034

Figure 237: Oceania Market Value Share (%) and BPS Analysis by Stud Diameter, 2024 to 2034

Figure 238: Oceania Market Y-o-Y Growth (%) Projections by Stud Diameter, 2024 to 2034

Figure 239: Oceania Market Value (US$ Million) Analysis by Operation, 2019 to 2034

Figure 240: Oceania Market Volume (Units) Analysis by Operation, 2019 to 2034

Figure 241: Oceania Market Value Share (%) and BPS Analysis by Operation, 2024 to 2034

Figure 242: Oceania Market Y-o-Y Growth (%) Projections by Operation, 2024 to 2034

Figure 243: Oceania Market Value (US$ Million) Analysis by End-use Industry, 2019 to 2034

Figure 244: Oceania Market Volume (Units) Analysis by End-use Industry, 2019 to 2034

Figure 245: Oceania Market Value Share (%) and BPS Analysis by End-use Industry, 2024 to 2034

Figure 246: Oceania Market Y-o-Y Growth (%) Projections by End-use Industry, 2024 to 2034

Figure 247: Oceania Market Attractiveness by Type of Arc Ignition, 2024 to 2034

Figure 248: Oceania Market Attractiveness by Material, 2024 to 2034

Figure 249: Oceania Market Attractiveness by Stud Diameter, 2024 to 2034

Figure 250: Oceania Market Attractiveness by Operation, 2024 to 2034

Figure 251: Oceania Market Attractiveness by End-use Industry, 2024 to 2034

Figure 252: Oceania Market Attractiveness by Country, 2024 to 2034

Figure 253: MEA Market Value (US$ Million) by Type of Arc Ignition, 2024 to 2034

Figure 254: MEA Market Value (US$ Million) by Material, 2024 to 2034

Figure 255: MEA Market Value (US$ Million) by Stud Diameter, 2024 to 2034

Figure 256: MEA Market Value (US$ Million) by Operation, 2024 to 2034

Figure 257: MEA Market Value (US$ Million) by End-use Industry, 2024 to 2034

Figure 258: MEA Market Value (US$ Million) by Country, 2024 to 2034

Figure 259: MEA Market Value (US$ Million) Analysis by Country, 2019 to 2034

Figure 260: MEA Market Volume (Units) Analysis by Country, 2019 to 2034

Figure 261: MEA Market Value Share (%) and BPS Analysis by Country, 2024 to 2034

Figure 262: MEA Market Y-o-Y Growth (%) Projections by Country, 2024 to 2034

Figure 263: MEA Market Value (US$ Million) Analysis by Type of Arc Ignition, 2019 to 2034

Figure 264: MEA Market Volume (Units) Analysis by Type of Arc Ignition, 2019 to 2034

Figure 265: MEA Market Value Share (%) and BPS Analysis by Type of Arc Ignition, 2024 to 2034

Figure 266: MEA Market Y-o-Y Growth (%) Projections by Type of Arc Ignition, 2024 to 2034

Figure 267: MEA Market Value (US$ Million) Analysis by Material, 2019 to 2034

Figure 268: MEA Market Volume (Units) Analysis by Material, 2019 to 2034

Figure 269: MEA Market Value Share (%) and BPS Analysis by Material, 2024 to 2034

Figure 270: MEA Market Y-o-Y Growth (%) Projections by Material, 2024 to 2034

Figure 271: MEA Market Value (US$ Million) Analysis by Stud Diameter, 2019 to 2034

Figure 272: MEA Market Volume (Units) Analysis by Stud Diameter, 2019 to 2034

Figure 273: MEA Market Value Share (%) and BPS Analysis by Stud Diameter, 2024 to 2034

Figure 274: MEA Market Y-o-Y Growth (%) Projections by Stud Diameter, 2024 to 2034

Figure 275: MEA Market Value (US$ Million) Analysis by Operation, 2019 to 2034

Figure 276: MEA Market Volume (Units) Analysis by Operation, 2019 to 2034

Figure 277: MEA Market Value Share (%) and BPS Analysis by Operation, 2024 to 2034

Figure 278: MEA Market Y-o-Y Growth (%) Projections by Operation, 2024 to 2034

Figure 279: MEA Market Value (US$ Million) Analysis by End-use Industry, 2019 to 2034

Figure 280: MEA Market Volume (Units) Analysis by End-use Industry, 2019 to 2034

Figure 281: MEA Market Value Share (%) and BPS Analysis by End-use Industry, 2024 to 2034

Figure 282: MEA Market Y-o-Y Growth (%) Projections by End-use Industry, 2024 to 2034

Figure 283: MEA Market Attractiveness by Type of Arc Ignition, 2024 to 2034

Figure 284: MEA Market Attractiveness by Material, 2024 to 2034

Figure 285: MEA Market Attractiveness by Stud Diameter, 2024 to 2034

Figure 286: MEA Market Attractiveness by Operation, 2024 to 2034

Figure 287: MEA Market Attractiveness by End-use Industry, 2024 to 2034

Figure 288: MEA Market Attractiveness by Country, 2024 to 2034

Frequently Asked Questions

How Big is the Stud Welding Equipment Market?

The stud welding equipment market size is estimated to be USD 1,113.9 million in 2024.

What is the Projected CAGR of the Stud Welding Equipment Market?

The stud welding equipment market size will rise at a 2.90% CAGR through 2034.

How Big Will be the Stud Welding Equipment Market by 2034?

The stud welding equipment market size will be worth USD 1,526.20 million by 2034.

Which is the Leading Product Type in the Stud Welding Equipment Market?

Arc stud welding equipment is highly preferred by various end-use industries.

Which Country is Expected to Rise at a Higher CAGR in the Stud Welding Equipment Market?

The stud welding equipment market in India is expected to rise at a 3.60% CAGR through 2034.

Explore Similar Insights

Future Market Insights

Stud Welding Equipment Market