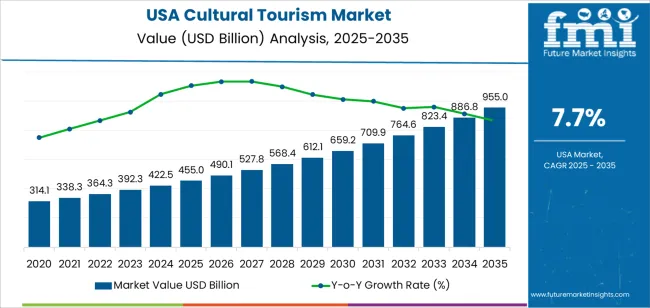
The USA cultural tourism demand is valued at USD 455.0 billion in 2025 and is projected to reach USD 955.0 billion by 2035, reflecting a CAGR of 7.7%. Demand is shaped by sustained domestic and international interest in museums, monuments, historic sites, and arts institutions. Growth is supported by continued investment in preservation, expanded exhibition programming, educational outreach, and broader visitor engagement initiatives. The shift toward experiential travel, combined with increased emphasis on cultural learning and local heritage exploration, further reinforces participation across age groups.
Heritage tourism leads the tourism landscape. Travellers select heritage-focused experiences to access historically significant locations, interpretive exhibits, and curated cultural narratives. Demand is strengthened by the presence of nationally recognized institutions, well-developed museum networks, and extensive archival collections. Digital integration, including virtual exhibits and augmented interpretation tools, also contributes to sustained visitation.
West USA, South USA, and Northeast USA record the highest cultural-tourism activity due to their concentration of landmark museums, historic districts, performing-arts venues, and national heritage sites. These regions maintain strong transport infrastructure and tourism services, which support visitor movement across major cultural clusters. Key institutions shaping the landscape include the Smithsonian Institution, United States Holocaust Memorial Museum, Metropolitan Museum of Art, Museum of Modern Art (MoMA), and The Getty Center. These organizations hold significant collections and offer structured cultural experiences central to heritage-focused travel within the USA.
Growth over the ten-year horizon shows a steady expansion pattern in the USA cultural-tourism segment. Early-period performance is shaped by rising participation in heritage tours, museum visits, and city-based cultural events. Visitor traffic increases as institutions modernize exhibitions and expand experiential formats, creating a consistent lift during the first few years. Recovery in domestic travel and improved access to cultural districts also supports early-cycle gains.
As the sector progresses into the mid period, growth maintains its momentum through broader programming, expanded festival calendars, and investment in digital engagement tools that enhance visitor planning and on-site experience. This phase reflects stronger alignment between cultural institutions and regional tourism strategies, producing a balanced and sustained rise. In the later period, the trajectory remains positive but becomes more stable as major destinations achieve higher visitation baselines. Incremental gains are driven by renewed infrastructure investment, continued diversification of cultural experiences, and partnerships between cities and cultural organizations. The ten-year comparison shows a consistent upward path with measured shifts, reflecting long-term demand for structured cultural experiences and gradual expansion across major tourist regions.
| Metric | Value |
|---|---|
| USA Cultural Tourism Sales Value (2025) | USD 455.0 billion |
| USA Cultural Tourism Forecast Value (2035) | USD 955.0 billion |
| USA Cultural Tourism Forecast CAGR (2025-2035) | 7.7% |
Demand for cultural tourism in the USA is increasing because more travellers seek experiences that go beyond traditional sightseeing to include heritage, arts, festivals, local traditions and immersive community engagement. Americans and international visitors alike show rising interest in museums, historic sites, indigenous culture events and creative-destination tours. Domestic travel trends and a focus on regional culture create opportunities for destinations across the country to capture increased visitor spend.
Marketing efforts by states and cities emphasize authenticity and storytelling, which supports growth in cultural tourism. Advancement in digital tools, such as virtual guides, augmented-reality museum exhibits and mobile itineraries, enhance visitor experience and strengthen demand. Growth faces constraints such as the higher cost of cultural-tourism experiences relative to mass tourism, capacity limits at popular heritage sites and competition from other segments like nature & adventure tourism. Some regions may lack infrastructure, event-frequency or distinct cultural branding which slows uptake in those areas.
Demand for cultural tourism in the United States reflects interest in heritage sites, artistic activities, food traditions, festivals, and faith-based travel. Tourism-type preferences relate to visitor motivations, regional attractions, and access to organised experiences. Traveler-category patterns illustrate how different groups participate in cultural travel for leisure, education, personal interest, or religious purposes. Tourist-type distribution highlights the relative participation of domestic and international travelers in cultural activities across USA destinations.
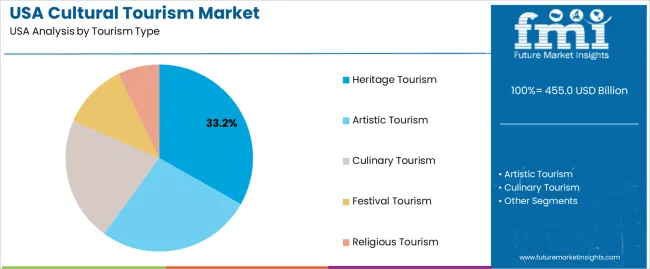
Heritage tourism holds 33.2% of national demand and represents the leading tourism type. Visitors engage with museums, historical districts, monuments, and preserved sites that document cultural development and regional history. Artistic tourism accounts for 26.8%, involving galleries, performances, and creative workshops. Culinary tourism represents 21.5%, reflecting interest in regional food traditions and dining experiences. Festival tourism holds 11.3%, supporting attendance at local celebrations, cultural events, and seasonal gatherings. Religious tourism accounts for 7.2%, involving visits to spiritual sites and participation in faith-related activities. Tourism-type distribution reflects varied motivations linked to cultural learning, artistic appreciation, local heritage, and food exploration across USA destinations.
Key drivers and attributes:
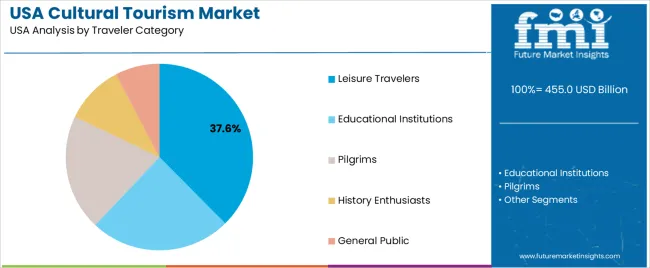
Leisure travelers hold 37.6% of national demand and represent the most active group in cultural tourism. Their participation reflects general interest in cultural experiences incorporated into vacations or regional trips. Educational institutions account for 24.4%, including school excursions, university programs, and study-based travel. Pilgrims represent 20.1%, travelling for faith-related purposes or visits to historical religious sites. History enthusiasts account for 10.2%, engaging in focused travel linked to archives, historical landmarks, and heritage research. The general public holds 7.7%, participating in cultural activities during routine travel. Traveler-category distribution reflects differences in purpose, educational value, and engagement depth across USA cultural destinations.
Key drivers and attributes:
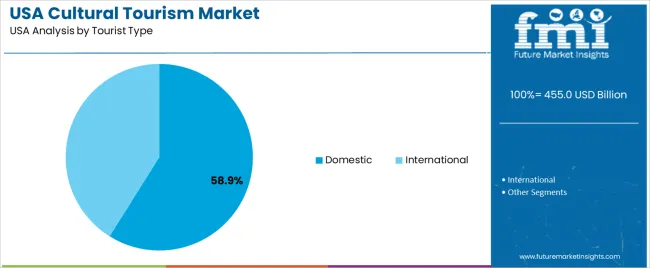
Domestic travelers hold 58.9% of national demand and represent the leading tourist type. USA residents engage in cultural trips due to accessibility, familiarity with regional heritage, and lower travel cost. International travelers account for 41.1%, participating in cultural tours, museum visits, and heritage attractions during extended trips. Tourist-type distribution reflects mobility patterns, seasonal travel behaviour, and availability of cultural offerings across major USA regions. Domestic participation remains strong due to widespread cultural sites, while international visitors contribute significant activity in major urban centres with established cultural infrastructure.
Key drivers and attributes:
Growth in heritage-site investment, expanding multi-generational and experience-based travel segments, and increased cultural event funding support demand
In the United States, demand for cultural tourism is boosted by federal and state historic-preservation grants that refurbish museums, national-historic landmarks and cultural districts, making them more accessible and media-visible. Older baby-boomers and their families, who travel in “family-heritage” segments, seek destinations offering American history, civil-rights heritage and local art scenes. City tourism boards invest in festivals celebrating local music, indigenous culture and immigrant heritage (for example in New Orleans, Detroit, Santa Fe), which drives more trips centred on cultural experiences rather than purely leisure vacations.
Rising airfare and accommodation costs, competition from international destinations with emerging cultural offerings and limited marketing of lesser-known USA cultural sites dampen growth.
Cultural-tourism demand in the USA is tempered when overall travel costs, such as domestic flights and hotel rates in key cultural hubs like New York, Washington D.C. and San Francisco, increase, reducing discretionary travel budgets. USA destinations also face competition from overseas locations that invest heavily in cultural tourism infrastructure and offer lower cost packages. Many USA regions with significant cultural heritage do not receive the same level of promotion or direct international-marketing investment, resulting in under-penetration of “second-tier” cultural destinations among both domestic and foreign travellers.
Rise of immersive local-culture experiences, integration of digital-storytelling and augmented-reality tours, and growth of niche cultural-tourism routes beyond major cities define the industry.
Cultural tourism providers in the USA increasingly offer immersive experiences such as art-studio visits, Indigenous-community heritage walks and food-culture trails in cities like Portland, Phoenix and Savannah to satisfy travellers seeking authenticity. Museums and heritage sites employ digital storytelling and augmented reality apps to create interactive tours of USA civil-rights landmarks or industrial-heritage sites. There is also growth in niche “heritage corridors” linking smaller towns with historic ties (for example Appalachian textile towns or Route 66-era architecture) which disperses demand beyond major urban centers and supports regional tourism development.
Demand for cultural tourism in the USA is increasing through 2035 as travelers place greater focus on heritage experiences, museum visitation, arts programming, Indigenous cultural learning, historic districts, and community-based events. Growth is supported by expanding domestic travel activity, upgraded visitor infrastructure, and broader integration of cultural themes into regional tourism strategies. Public institutions, museums, and arts organizations develop new exhibitions and guided programs aligned with educational and experiential travel preferences. Cities and small towns reinforce demand through festivals, restored landmarks, and curated historical trails. Regional variation reflects population centers, cultural-resource density, and visitor inflows. West USA leads at 8.8%, followed by South USA (7.9%), Northeast USA (7.1%), and Midwest USA (6.2%).
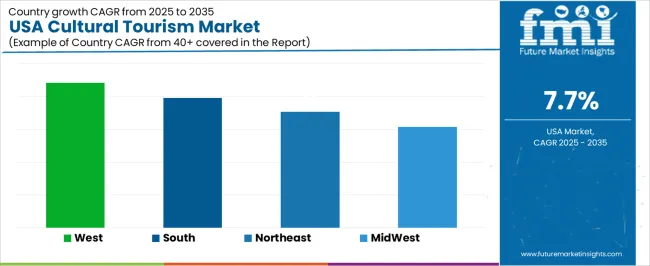
| Region | CAGR (2025-2035) |
|---|---|
| West USA | 8.8% |
| South USA | 7.9% |
| Northeast USA | 7.1% |
| Midwest USA | 6.2% |
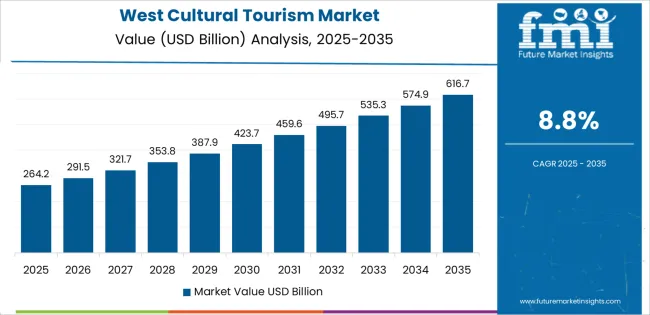
West USA grows at 8.8% CAGR, supported by strong participation in arts, heritage, and Indigenous-culture experiences across California, Washington, Oregon, Colorado, Utah, Arizona, and New Mexico. Major cities such as Los Angeles, San Francisco, Seattle, and Denver attract visitors to museums, film districts, architectural landmarks, and contemporary arts spaces. Indigenous cultural centers throughout Arizona, New Mexico, and the Pacific Northwest expand heritage-based programs, guided site visits, and educational exhibitions. National parks with archaeological sites increase cultural-learning itineraries. Coastal tourism hubs integrate cultural festivals, culinary tours, and community arts events into broader regional travel offerings.
South USA grows at 7.9% CAGR, driven by strong interest in music history, regional cuisine, historic districts, and multicultural heritage across Texas, Florida, Georgia, North Carolina, Tennessee, Louisiana, and Alabama. Cities such as New Orleans, Nashville, Atlanta, and Austin attract visitors to music landmarks, civil-rights museums, and cultural-heritage corridors. Culinary tourism contributes significantly as travelers explore regional food traditions. Coastal destinations integrate historic-site tours with broader leisure travel. Historic battlefields, plantation museums, and architectural restoration projects increase participation in heritage-education programs.
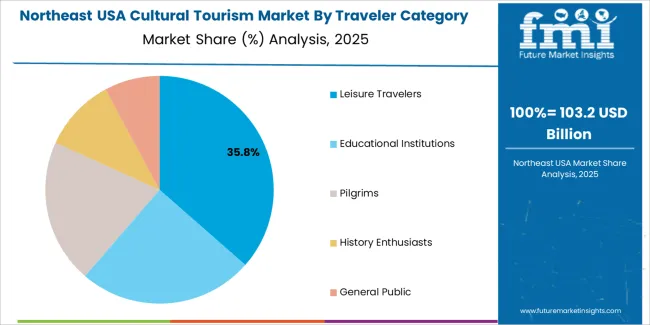
Northeast USA grows at 7.1% CAGR, supported by dense cultural assets, historic towns, and extensive museum networks across New York, Massachusetts, Pennsylvania, New Jersey, and Connecticut. Major institutions in New York City and Boston attract significant cultural travelers seeking art exhibitions, theater, literature, and historic architecture. Heritage districts in smaller cities offer walking tours, preserved neighborhoods, and early-American historical sites. Universities and cultural organizations host festivals, lectures, and arts programs that increase regional travel. Coastal communities incorporate maritime history into local tourism itineraries.
Midwest USA grows at 6.2% CAGR, supported by strong interest in industrial heritage, architectural history, regional folk traditions, and community arts programs across Illinois, Ohio, Michigan, Minnesota, Wisconsin, and Iowa. Cities such as Chicago, Detroit, Minneapolis, and Cleveland attract visitors to museums, restored industrial sites, and modern-architecture landmarks. Cultural festivals, local heritage events, and community museums broaden participation in smaller towns. Great Lakes states integrate maritime history, Indigenous cultural sites, and historical trails into regional tourism offerings.
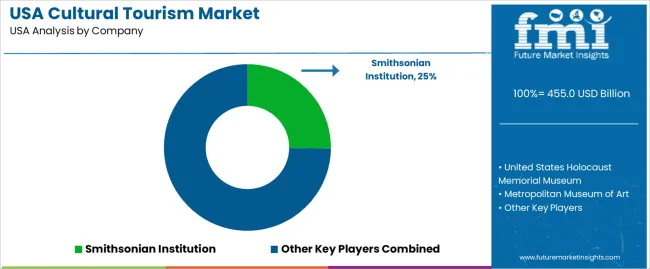
Demand for cultural tourism in the USA is shaped by a group of nationally recognized museums and cultural institutions with high annual visitation, substantial collections, and established educational programmes. Smithsonian Institution holds the leading position with an estimated 25.2% share, supported by its system of museums and research centres in Washington, D.C., which together attract consistent domestic and international footfall. Its position is reinforced by broad thematic coverage, reliable public access, and long-standing integration with national heritage initiatives.
United States Holocaust Memorial Museum remains a major participant due to sustained visitation, structured educational outreach, and a stable reputation among cultural and historical institutions. Metropolitan Museum of Art, operating extensive galleries and long-term exhibitions in New York City, contributes a large visitor base and consistent demand driven by its encyclopaedic collections.
Museum of Modern Art (MoMA) maintains strong appeal among visitors seeking modern and contemporary art, supported by controlled curation standards and reliable exhibition turnover. The Getty Center adds depth through its collections, research activity, and architectural significance, attracting steady cultural tourism to the Los Angeles region.
Competition across this segment centres on exhibition quality, collection accessibility, educational programming, visitor-flow capacity, and year-round public engagement. Demand remains stable as USA and international travellers continue to seek heritage institutions, fine-arts collections, and research-driven cultural experiences that provide consistent interpretive depth and reliable visitor services across major American urban centres.
| Items | Values |
|---|---|
| Quantitative Units | USD billion |
| Tourism Type | Heritage Tourism, Artistic Tourism, Culinary Tourism, Festival Tourism, Religious Tourism |
| Traveler Category | Leisure Travelers, Educational Institutions, Pilgrims, History Enthusiasts, General Public |
| Tourist Type | Domestic, International |
| Booking Channel | Online, Phone Booking, In-Person Booking |
| Regions Covered | West USA, South USA, Northeast USA, Midwest USA |
| Key Companies Profiled | Smithsonian Institution, United States Holocaust Memorial Museum, Metropolitan Museum of Art, Museum of Modern Art (MoMA), The Getty Center |
| Additional Attributes | Dollar spending by tourism type and traveler category; domestic vs. international participation; digital vs. offline booking preferences; engagement across museums, cultural districts, heritage sites, galleries, and festivals; visitor flow distribution across West, South, Northeast, and Midwest USA. |
The demand for cultural tourism in usa is estimated to be valued at USD 455.0 billion in 2025.
The market size for the cultural tourism in usa is projected to reach USD 955.0 billion by 2035.
The demand for cultural tourism in usa is expected to grow at a 7.7% CAGR between 2025 and 2035.
The key product types in cultural tourism in usa are heritage tourism, artistic tourism, culinary tourism, festival tourism and religious tourism.
In terms of traveler category, leisure travelers segment is expected to command 37.6% share in the cultural tourism in usa in 2025.


Our Research Products

The "Full Research Suite" delivers actionable market intel, deep dives on markets or technologies, so clients act faster, cut risk, and unlock growth.

The Leaderboard benchmarks and ranks top vendors, classifying them as Established Leaders, Leading Challengers, or Disruptors & Challengers.

Locates where complements amplify value and substitutes erode it, forecasting net impact by horizon

We deliver granular, decision-grade intel: market sizing, 5-year forecasts, pricing, adoption, usage, revenue, and operational KPIs—plus competitor tracking, regulation, and value chains—across 60 countries broadly.

Spot the shifts before they hit your P&L. We track inflection points, adoption curves, pricing moves, and ecosystem plays to show where demand is heading, why it is changing, and what to do next across high-growth markets and disruptive tech

Real-time reads of user behavior. We track shifting priorities, perceptions of today’s and next-gen services, and provider experience, then pace how fast tech moves from trial to adoption, blending buyer, consumer, and channel inputs with social signals (#WhySwitch, #UX).

Partner with our analyst team to build a custom report designed around your business priorities. From analysing market trends to assessing competitors or crafting bespoke datasets, we tailor insights to your needs.
Supplier Intelligence
Discovery & Profiling
Capacity & Footprint
Performance & Risk
Compliance & Governance
Commercial Readiness
Who Supplies Whom
Scorecards & Shortlists
Playbooks & Docs
Category Intelligence
Definition & Scope
Demand & Use Cases
Cost Drivers
Market Structure
Supply Chain Map
Trade & Policy
Operating Norms
Deliverables
Buyer Intelligence
Account Basics
Spend & Scope
Procurement Model
Vendor Requirements
Terms & Policies
Entry Strategy
Pain Points & Triggers
Outputs
Pricing Analysis
Benchmarks
Trends
Should-Cost
Indexation
Landed Cost
Commercial Terms
Deliverables
Brand Analysis
Positioning & Value Prop
Share & Presence
Customer Evidence
Go-to-Market
Digital & Reputation
Compliance & Trust
KPIs & Gaps
Outputs
Full Research Suite comprises of:
Market outlook & trends analysis
Interviews & case studies
Strategic recommendations
Vendor profiles & capabilities analysis
5-year forecasts
8 regions and 60+ country-level data splits
Market segment data splits
12 months of continuous data updates
DELIVERED AS:
PDF EXCEL ONLINE
USA Ecotourism Market Trends – Demand, Innovations & Forecast 2025-2035
USA Wine Tourism Market Report – Trends, Growth & Industry Outlook 2025-2035
Cultural Tourism Market Analysis by Tourism Type, By Traveler Category, by Tourist Type, by Booking Channel, and by Region - Forecast for 2025 to 2035
USA Golf Tourism Market Analysis
USA Space Tourism Market Trends – Size, Growth & Forecast 2025-2035
United States Halal Tourism Market Outlook – Trends, Demand & Forecast 2025–2035
USA Sports Tourism Market Growth – Trends, Demand & Forecast 2025-2035
USA Safari Tourism Market Insights – Demand, Size & Trends 2025-2035
USA Casino Tourism Industry Analysis from 2025 to 2035
USA Diving Tourism Market Trends – Growth, Demand & Outlook 2025-2035
USA Medical Tourism Market Analysis – Size, Share & Forecast 2025-2035
USA Surfing Tourism Market Insights – Growth, Demand & Forecast 2025-2035
USA Adventure Tourism Market Analysis – Size, Share & Industry Growth 2025-2035
USA and Canada Tourism Market Analysis – Trends & Forecast 2025-2035
USA Faith Based Tourism Market Size and Share Forecast Outlook 2025 to 2035
USA Educational Tourism Market Report – Size, Growth & Industry Trends 2025-2035
USA Responsible Tourism Market Analysis – Growth, Trends & Industry Insights 2025-2035
USA Special Interest Tourism Market Growth – Innovations, Trends & Forecast 2025-2035
Demand for Cultural Tourism in Japan Size and Share Forecast Outlook 2025 to 2035
Tourism Independent Contractor Model Market Size and Share Forecast Outlook 2025 to 2035

Thank you!
You will receive an email from our Business Development Manager. Please be sure to check your SPAM/JUNK folder too.
Chat With
MaRIA