Reports

- Global Locations -

Headquarters

Future Market Insights, Inc.

Christiana Corporate, 200
Continental Drive, Suite 401,
Newark, Delaware - 19713,
United States

T: +1-845-579-5705

Americas

Future Market Insights, Inc.

616 Corporate Way, Suite 2-9018,
Valley Cottage, NY 10989, United States

T: +1-347-918-3531

MEA

Future Market Insights

1602-6 Jumeirah Bay X2 Tower, Plot No: JLT-PH2-X2A,
Jumeirah Lakes Towers, Dubai,
United Arab Emirates

Europe

Future Market Insights

3rd Floor, 207 Regent Street,
W1B 3HH London
United Kingdom

T: + 44 (0) 20 8123 9659
D: +44 (0) 20 3287 4268

Asia Pacific

Future Market Insights

IndiaLand Global Tech Park, Unit UG-1, Behind Grand HighStreet, Phase 1, Hinjawadi, MH, Pune – 411057, India

United States Dog Toys Market Outlook (2023 to 2033)

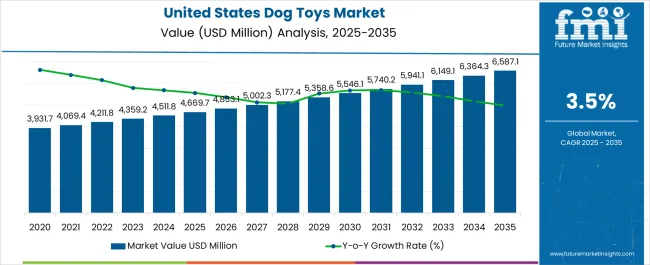
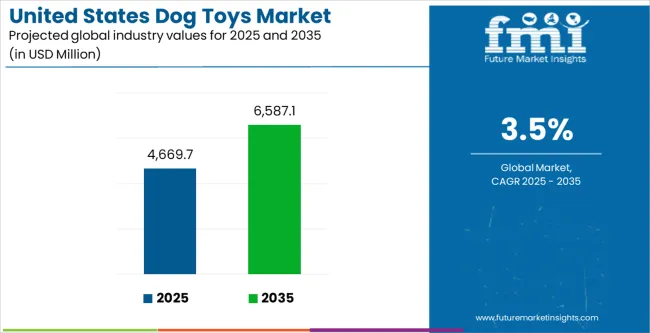
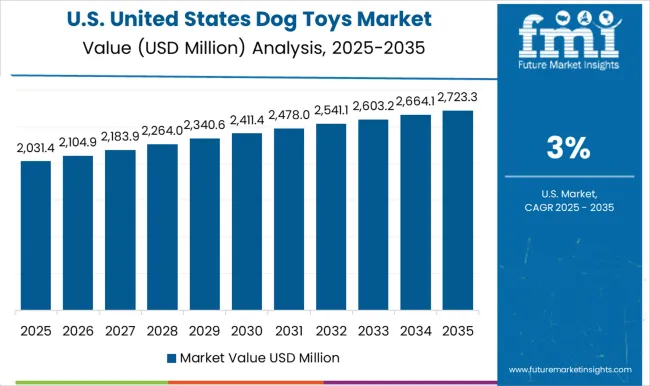
The United States dog toys market value is projected to increase from US$ 3,083.2 million in 2023 to US$ 4,359.2 million by 2033. Over the next ten years (2023 to 2033), dog toy sales in the United States market are expected to soar at a CAGR of 3.5%.

In 2022, the United States dog toys industry was valued at US$ 2,986.9 million, and it is forecast to exhibit a Y-o-Y growth of 3.2% in 2023.

Prominent Factors Shaping the Market Dynamics:

  • Rising pet population across the United States will likely continue to boost the dog toys industry during the next ten years
  • High expenditure on pets and pet care products are set to create growth prospects for the target market
  • Increasing spending on training and behavioral products to fuel sales in the United States market
  • Rising trend of humanization of pets is expected to positively impact dog toy sales in the United States.
  • Increasing sales through e-commerce and online retail will elevate dog toy demand in the United States market
  • Surging popularity of multifunctional dog toys will likely further boost the target market
  • Development of smart dog toys is likely to open new growth windows for the market
  • Shift from indirect to DTC is another emerging factor fueling market growth across the United States
  • Rising trend of providing customized dog toys will stimulate market development

The United States is becoming a highly lucrative dog toys market due to rising pet adoption rates. According to the American Pet Products Association’s (APPA’s) 2023-2024 National Pet Owners Survey, around 86.9 million United States households own a pet.

Among various pets, adoption rate is expected to remain high for dogs. As per the report, 65.1 million United States households are estimated to own a dog. This in turn will elevate demand for dog toys during the projection period.

Dog toys are in high demand compared to other pet products due to the popularity and large ownership of dogs and the diverse range of products needed to cater to their size and physical needs.

Dog toys serve numerous functions for dogs. For instance, playing with different toys encourages exercise, which benefits the dogs’ health, stimulates their minds, and discourages problem behavior due to boredom and excess energy.

A wide variety of dog toys are available in the United States market, each designed for different purposes. Growing adoption of these dog toys across the United States will fuel market expansion.

Similarly, growing pet humanization trend and rising demand for training & behavior management products are expected to boost the United States dog toys industry.

Today, pet owners consider their companion animals as a part of their family. This pet parenting trend is encouraging them to provide premium products including pet toys to their pets. Driven by this, sales of dog toys across the United States are anticipated to thrive rapidly.

Further, the growing focus on dog health & wellness is driving demand for specialized dog toys. Sustainability and eco-friendly products have gained importance, with consumers seeking environmentally conscious options.

Technological advancements, such as smart pet toys, are also impacting the market, and the trend is likely to continue during the assessment period.

Attributes Key Insights
United States Dog Toys Market Size in 2022 ~US$ 2,986.9 million
Estimated Market Value (2023) ~US$ 3,083.2 million
Projected Market Size (2033) ~US$ 4,359.2 million
Market CAGR (2023 to 2033) ~3.5%

Don't pay for what you don't need

Customize your report by selecting specific countries or regions and save 30%!

How Has the Market Progressed So Far in 2023?

Market Statistics Details
Jan to Jun (H1), 2021 (A) 3.0%
Jul to Dec (H2), 2021 (A) 3.2%
Jan to Jun (H1), 2022 Projected (P) 3.0%
Jan to Jun (H1), 2022 Outlook (O) 3.3%
Jul to Dec (H2), 2022 Outlook (O) 3.5%
Jul to Dec (H2), 2022 Projected (P) 3.2%
Jan to Jun (H1), 2023 Projected (P) 3.2%
BPS Change: H1, 2022 (O) to H1, 2022 (P) (+) 30
BPS Change: H1, 2021 (O) to H1, 2022 (A) (-) 33
BPS Change: H2, 2022 (O) to H2, 2022 (P) (+) 32
BPS Change: H2, 2021 (O) to H2, 2022 (P) (-) 35

2018 to 2022 United States Dog Toys Sales Outlook Compared to Demand Forecast From 2023 to 2033

As per Future Market Insights (FMI), sales of pet toys in the United States market grew at a CAGR of 2.7% during the historical period from 2018 to 2022. Total market valuation reached around US$ 2,986.9 million at the end of 2022.

Looking ahead, the United States dog toys industry is projected to thrive at a CAGR of 3.5% during the assessment period. This is expected to take the overall market valuation to US$ 4,359.2 million by 2033.

Rising pet population and growing pet humanization are key factors driving the United States dog toys industry.

Similarly, rising spending on training and behavioral products is expected to bolster dog toy sales across the United States during the projection period.

Dog toy product companies are seeing an increase in online sales due to the rise of e-commerce portals and shopping sites that are particular for pets. This is due to rising consumer interest in purchasing pet products such as dog toys from online platforms.

Key players in the market are spending heavily on research & development to create new dog toys and improve the materials of dog toys. This is because dog owners prefer eco-friendly materials that can meet the evolving health and wellness requirements of dogs.

Distribution methods like e-commerce websites and their tactical distribution channels have left behind the brick-and-mortar system. Businesses are using content marketing to attract more customers, which in turn will lead to growing demand.

In the past, domestic companies dominated the market. But as more domestic brands are developed and overseas competitors enter the market, things are beginning to change.

The development of consumers' purchasing habits influences the primary cause of the influx of several multinational brands. They are more discerning and have more awareness about options, paired with a higher disposable income and increased readiness to spend.

The foreign direct investment offered by regional governments might be another reason for the influx of foreign brands in regional markets. As a result, the United States dog toys market is anticipated to thrive at a steady pace over the next ten years.

Sudip Saha
Sudip Saha

Principal Consultant

Talk to Analyst

Find your sweet spots for generating winning opportunities in this market.

Comparative View of Adjacent United States Dog Toys Market

The United States dog toys industry is set to be impacted by the peer, or tangential market in the industry. These include the global pet toys market and the global pet carriers market. On analysis of these related industries, Future Market Insights have found profound insights that will be helpful for developing unique differentiating strategies to pursue for growth and opportunity.

Global Pet Toys Market:

Attribute Global Pet Toys Market
CAGR (2023 to 2033) 7.4%
Market Value (2023) US$ 52.89 Billion
Growth Factor Booming pet care industry and rising consumer spending on pets are expected to drive the global pet toys market forward.
Key Trend Rising popularity of smart pet toys to elevate demand in the global market through 2033.

Global Pet Carriers Market:

Attribute Global Pet Carriers Market
CAGR (2023 to 2033) 4.0%
Market Value (2023) US$ 863.2 Billion
Growth Factor Increasing pet population is a prominent factor expected to drive the global pet carriers market.
Key Trend Rising trend of pet humanization along with high spending on premium pet products will positively impact pet carrier sales through 2033.

Key Dynamics in the United States Dog Toys Industry

  • Promotional Campaigns and Expos with the help of Social Media Driving Dog Toy Demand:

To gain a considerable market share in the ever-growing, competitive industry, businesses are adopting several strategies such as campaigns and attending pet product expos.

Similarly, social media platforms and pet influencers are having a significant impact on consumer trends and preferences. Such promotional activities are enabling manufacturers and suppliers to expand the dog toys market in a much broader landscape.

For instance, the global pet expo 2023 was hosted at the Orange County Convention Centre in Orlando in 2023. This expo offered an online trade show experience to both exhibitors and buyers.

  • Consumer Focus on Spending Money on Training & Behavioural Products to Create Opportunities for Dog Toy Manufacturers:

Dog owners are increasingly shifting towards buying training and behavioral toys for their pets. This in turn is making the United States a highly lucrative market for dog toy manufacturers.

Growing awareness regarding how toys play a vital role in training and managing behavioural issues of dogs is encouraging owners to spend large amounts on dog toys.

Dog toys encourage positive behavior, address separation anxiety, and aid in the teething or chewing needs of the dogs. This is one of the key factors that has driven consumer spending on training and behavioral toys in the market.

To gain profits, leading dog toy manufacturers are introducing new training dog toys. For instance, one of the United States-based dog toys market leaders, West Paw recently launched Zogoflex Bumi.

Zogoflex Bumi is a flexible tug that features a unique S-shaped design and it is made from recyclable material that is mouth-friendly. It helps dogs in work training as well as also helps conditions muscles from head to tail.

  • Growing Expenditure on Dogs to Positively Impact Dog Toy Sales in the United States:

The United States dog toys industry will benefit from rising consumer spending on their pets, such as dogs.

Americans consider their dogs as family members due to growing trend of pet humanization. As a result, they are spending hefty amounts on pet care products such as dog toys.

Manufacturers are able to offer an increasing number of dog items thanks to the rising tendency among consumers who view their pets as members of their families.

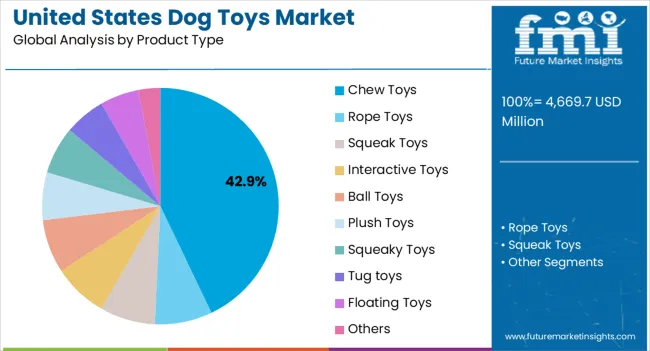
The United States households spent US$ 2,986.9 million on dog toys in 2022. This includes more than US$ 948 million spent on interactive toys, US$ 579 million spent on plush toys, and US$ 505 million spent on rope toys.

Get the data you need at a Fraction of the cost

Personalize your report by choosing insights you need
and save 40%!

Key Trends of the United States Dog Toys Market

  • Development & Growing Popularity of Eco-Friendly Products to Boost the United States Market:

The United States dog toys industry is anticipated to thrive at a CAGR of 3.5% during the projection period. Rising popularity of eco-friendly products is an emerging trend expected to boost the United States market.

Social responsibility has gained enormous traction in the United States market as people are focusing on eco-friendly and sustainable products. Companies are also realizing the need and preferences of the users. As a result, they are looking to develop pet toys with eco-friendly features.

By developing eco-friendly dog toys, leading dog toy brands in the market are increasingly promoting brand sustainability. This is expected to help them expand their customer base as well as revenues.

Building brand sustainability is a crucial strategy for dog toy manufacturers as they are trying to stand out from the competition and draw in customers who prefer eco-friendly and health- and wellness-focused dog toys.

  • Growing Pet Ownership across the United States to Bolster Dog Toy Sales Through 2033:

Rising dog ownership is a prominent factor fueling dog toy sales, and the trend is expected to continue through 20333.

United States-based dog owners emphasize premium and natural products, and as a result, they are investing in high-quality toys, tech-integrated toys, and supplies.

Dog owners are also focusing on their dog’s health and wellness by seeking specialized toy options. Rising pet population along with pet humanization is expected to act as a catalyst triggering growth of the United States dog toys industry.

Sustainability awareness is rising, with consumers looking for eco-friendly and sustainable dog toys. The collaborations and brand partnerships help expand distribution channels, reach a wider audience, and tap into the existing customer base of the partnering brand or influencer. This is contributing to the dog toys market growth as dog owners seek comprehensive care for their pets.

Online retail and e-commerce have become significant channels for dog toys in the United States, offering convenience and a wide product selection. This is also positively impacting sales of dog toys and the overall market growth.

Category-wise Insights

Which Type of Dog Toys are Gaining Popularity across the United States?

Interactive Toys Gaining Immense Traction Among Dog Parents across the United States

Interactive toys have gained immense popularity across the United States and the trend is expected to continue through 2033. This is due to their ability to engage and entertain dogs by stimulating their natural instincts and providing mental and physical stimulation.

Interactive toys also help to keep dogs mentally sharp, prevent boredom, and provide a healthy outlet for their energy. Hence, dog owners are spending huge amounts for purchasing various interactive toys for their animals. This will create lucrative revenue-generation opportunities for dog toy manufacturers.

The market offers a wide range of interactive dog toys, allowing dog owners to choose based on their preferences and their dogs' needs. According to Future Market Insights, the interactive toys segment is projected to thrive at a CAGR of 2.5% during the projection period.

Why Online Retailers are Expected to Gain Traction during the Forecast Period?

High Penetration of Internet & Influence of Social Media Putting Online Retailers into Spotlight

Technology has changed how dog owners are taking care of their dogs. The use of technology has made it convenient for dog owners to interact with and take care of their dogs as well as purchase various dog toys.

According to stats presented by an APPA survey, an estimated 65 million United States household owns a dog, and the number of pet owners shopping online increased by almost 20% from 2021 to 2022.

Besides, the proportion of dog owners who discovered new toys by browsing in a store was almost equal to the proportion who learned about dog toys through browsing the internet.

There has been a sharp rise in the number of customers purchasing dog toys through online channels in recent years, and the trend is expected to continue through 2033. As per the latest analysis, the online retailers segment is expected to progress at a CAGR of 4.5% during the projection period.
Competitive Landscape

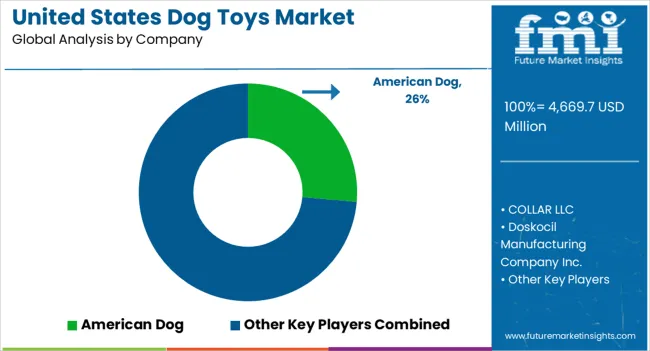
The United States dog toys market is fragmented with a large number of players competing on the basis of product efficacy, quality, brand reputation, and price.

Leading dog toy companies are investing in research and development activities to introduce novel products. They are also shifting their focus towards online shopping platforms to expand their customer base and increase revenues.

Further, United States-based dog toy manufacturers are implementing strategies such as mergers, acquisitions, mergers, collaborations, partnerships, and strengthening distribution channels to gain a competitive edge in the market.

Recent developments:

  • In 2023, Ethical Products Inc. received the vendor of the year from VSI. The award is given to Ethical Products Inc. due to the top-line growth of the company in the market.
  • In 2022, COLLAR LLC launched its newest silicon travel water and food bowls for dogs. Portable water and food bowls for dogs from the WAUDOG brand will be essential while traveling with dogs.
  • In January 2021, PETCO was launched by West Paw Inc. for selling dog toys such as Zogoflex dog toys and Zogoflex Echo dog toys.

Scope of Report

Attribute Details
Estimated Market Value (2023) ~US$ 3,083.2 million
Projected Market Value (2033) ~US$ 4,359.2 million
Anticipated Growth Rate (2023 to 2033) 3.5% CAGR
Forecast Period 2023 to 2033
Historical Data Available for 2018 to 2022
Market Analysis US$ Million/Billion for Value
Key Countries Covered
  • United States
Key Segments Covered
  • Product Category
  • Product Type
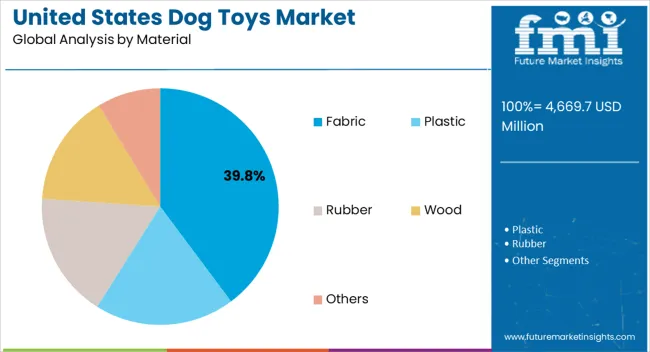
  • Material
  • Age Group
  • Sales Channel
Key Companies Profiled
  • American Dog
  • COLLAR LLC
  • Doskocil Manufacturing Company Inc.
  • Ethical Products Inc.
  • Goughnuts Inc.
  • Hagen Inc.
  • Penn-Plax Inc.
  • Radio Systems Corporation
  • Unicharm Corporation
  • West Paw Inc.
  • Others (as requested)
Report Coverage Market Forecast, Company Share Analysis, Competition Intelligence, DROT Analysis, Market Dynamics and Challenges, and Strategic Growth Initiatives

United States Dog Toys Market by Category

By Product Category:

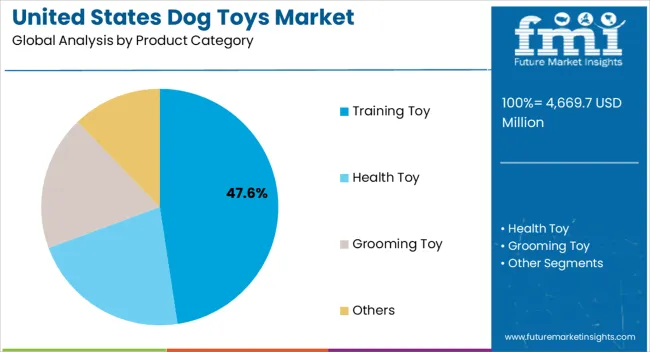
  • Training Toy
  • Health Toy
  • Grooming Toy
  • Others

By Product Type:

  • Chew Toys
  • Rope Toys
  • Squeak Toys
  • Interactive Toys
  • Ball Toys
  • Plush Toys
  • Squeaky Toys
  • Tug toys
  • Floating Toys
  • Others

By Material:

  • Fabric
  • Plastic
  • Rubber
  • Wood
  • Others

By Age Group:

  • Puppies
  • Adult Dogs
  • Senior Dogs

By Sales Channel:

  • Modern Trade
  • Convenience Stores
  • Pet Specialty Stores
  • Multi-Brand Stores
  • Drug Stores
  • Online Retailers
  • Other Sales Channel

Frequently Asked Questions

Which industry is the Key Consumer of the United States Dog Toys?

Pet owners are the key consumer of the United States dog toy market.

How Much can the United States Market Grow by 2033 in Product Type?

Interactive toys are poised to stay attractive, projecting a CAGR of 2.5% by 2033.

What is Current Market Valuation?

The market is estimated to secure a valuation of US$ 3,083.2 million in 2023.

How Big will be the XYZ Market by 2033?

The market is estimated to reach US$ 4,359.2 million by 2033.

Which End Use Industry holds Lucrative Opportunities?

Online retail sector holds high revenue potential.

Table of Content

1. Executive Summary

    1.1. United States Market Outlook

    1.2. Demand Side Trends

    1.3. Supply Side Trends

    1.4. Technology Roadmap Analysis

    1.5. Analysis and Recommendations

2. Market Overview

    2.1. Market Coverage / Taxonomy

    2.2. Market Definition / Scope / Limitations

3. Key Market Trends

    3.1. Key Trends Impacting the Market

        3.1.1. Emphasis On Education of Dog Parents

        3.1.2. Rise in Consumer Spending On Training and Behavioral Products

        3.1.3. Eco-friendly and Sustainable Products with Creating Shared Value

        3.1.4. Growing Expenditure on Pets

        3.1.5. Others (during the course of the study)

    3.2. Future Prospects of Industry

        3.2.1. Factors Fueling Growth

        3.2.2. Influx of Brands

        3.2.3. Increasing Demand of Sustainable Products

4. Market Demand Analysis 2018 to 2022 and Forecast, 2023 to 2033

    4.1. Historical and Current Market Household Expenditure Analysis, 2018 to 2022

    4.2. Y-o-Y Growth Trend Analysis

    4.3. Y-o-Y Growth Trend Analysis

5. Market - Pricing Analysis

    5.1. Regional Pricing Analysis By Product Type

    5.2. Pricing Break-up

        5.2.1. Manufacturer Level Pricing

        5.2.2. Distributor Level Pricing

    5.3. Regional Average Pricing Analysis Benchmark

6. Market Demand (in Value or Size in US$ Million) Analysis 2018 to 2022 and Forecast, 2023 to 2033

    6.1. Historical Market Value (US$ Million) Analysis, 2018 to 2022

    6.2. Current and Future Market Value (US$ Million) Projections, 2023 to 2033

        6.2.1. Y-o-Y Growth Trend Analysis

        6.2.2. Absolute $ Opportunity Analysis

7. Market Background

    7.1. Macro-Economic Factors

        7.1.1. United States GDP Growth Outlook

        7.1.2. Industry Overview

        7.1.3. Number of Household’s with pet

        7.1.4. Spending Outlook

        7.1.5. United States Service Market Outlook

    7.2. Forecast Factors - Relevance & Impact

        7.2.1. Top Companies Historical Growth

        7.2.2. GDP Growth Forecast

        7.2.3. Top Companies Historical Growth

        7.2.4. United States Service Sector Gross Value Added

        7.2.5. Industry Outlook

        7.2.6. United States Urbanization Growth Outlook

    7.3. Value Chain

        7.3.1. Profit Margin Analysis at each sales point

        7.3.2. List & role of key participant

            7.3.2.1. Manufacture

            7.3.2.2. Distributors/Retailers

    7.4. Market Dynamics

        7.4.1. Drivers

        7.4.2. Restraints

        7.4.3. Opportunity Analysis

    7.5. PESTLE Analysis of Market

    7.6. Porter’s Five Force Analysis

8. Market Analysis 2018 to 2022 and Forecast 2023 to 2033, by Product Category

    8.1. Introduction / Key Findings

    8.2. Historical Market Size (US$ Million) Analysis By Product Category, 2018 to 2022

    8.3. Current and Future Market Size (US$ Million) Analysis and Forecast By Product Category, 2023 to 2033

        8.3.1. Training Toys

        8.3.2. Health Toys

        8.3.3. Grooming Toys

        8.3.4. Others

    8.4. Market Attractiveness Analysis By Product Category

9. Market Analysis 2018 to 2022 and Forecast 2023 to 2033, By Product Type

    9.1. Introduction / Key Findings

    9.2. Historical Market Size (US$ Million) Analysis By Product Type, 2018 to 2022

    9.3. Current and Future Market Size (US$ Million) Analysis and Forecast By Product Type, 2023 to 2033

        9.3.1. Chew Toys

        9.3.2. Rope Toys

        9.3.3. Squeak Toys

        9.3.4. Interactive Toys

        9.3.5. Ball Toys

        9.3.6. Plush Toys

        9.3.7. Squeaky Toys

        9.3.8. Tug Toys

        9.3.9. Floating Toys

        9.3.10. Others

    9.4. Market Attractiveness Analysis By Product Type

10. Market Analysis 2018 to 2022 and Forecast 2023 to 2033, By Material

    10.1. Introduction / Key Findings

    10.2. Historical Market Size (US$ Million) Analysis By Material, 2018 to 2022

    10.3. Current and Future Market Size (US$ Million) Analysis and Forecast By Material, 2023 to 2033

        10.3.1. Fabric

        10.3.2. Plastic

        10.3.3. Rubber

        10.3.4. Wood

        10.3.5. Others

    10.4. Market Attractiveness Analysis By Material

11. Market Analysis 2018 to 2022 and Forecast 2023 to 2033, By Age Group

    11.1. Introduction / Key Findings

    11.2. Historical Market Size (US$ Million) Analysis By Age Group, 2018 to 2022

    11.3. Current and Future Market Size (US$ Million) Analysis and Forecast By Age Group, 2023 to 2033

        11.3.1. Puppies

        11.3.2. Adult Dogs

        11.3.3. Senior Dogs

    11.4. Market Attractiveness Analysis By Age Group

12. Market Analysis 2018 to 2022 and Forecast 2023 to 2033, by Sales Channel

    12.1. Introduction / Key Findings

    12.2. Historical Market Size (US$ Million) Analysis By Sales Channel, 2018 to 2022

    12.3. Current and Future Market Size (US$ Million) Analysis and Forecast By Sales Channel, 2023 to 2033

        12.3.1. Modern Trade

        12.3.2. Convenience Stores

        12.3.3. Pet Specialty Stores

        12.3.4. Multi-Brand Stores

        12.3.5. Drug Stores

        12.3.6. Online Retailers

        12.3.7. Other Sales Channel

    12.4. Market Attractiveness Analysis By Sales Channel

13. Market Analysis 2018 to 2022 and Forecast 2023 to 2033, by Region

    13.1. Introduction / Key Findings

    13.2. Historical Market Size (US$ Million) Analysis By Region, 2018 to 2022

    13.3. Current and Future Market Size (US$ Million) Analysis and Forecast By Region, 2023 to 2033

        13.3.1. West

        13.3.2. South West

        13.3.3. Mid-West

        13.3.4. North East

        13.3.5. South East

    13.4. Market Attractiveness Analysis By Region

14. West Market Analysis 2018 to 2022 and Forecast 2023 to 2033

    14.1. Introduction

    14.2. Pricing Analysis

    14.3. Historical Market Size (US$ Million) Trend Analysis By Market Taxonomy, 2018 to 2022

    14.4. Market Size (US$ Million) Forecast By Market Taxonomy, 2023 to 2033

        14.4.1. By Product Category

        14.4.2. By Product Type

        14.4.3. By Material

        14.4.4. By Age Group

        14.4.5. By Sales Channel

    14.5. Market Attractiveness Analysis

        14.5.1. By Product Category

        14.5.2. By Product Type

        14.5.3. By Material

        14.5.4. By Age Group

        14.5.5. By Sales Channel

    14.6. Market Trends

    14.7. Drivers and Restraints - Impact Analysis

    14.8. Key Players Participants - Intensity Mapping

15. Mid-West Market Analysis 2018 to 2022 and Forecast 2023 to 2033

    15.1. Introduction

    15.2. Pricing Analysis

    15.3. Historical Market Size (US$ Million) Trend Analysis By Market Taxonomy, 2018 to 2022

    15.4. Market Size (US$ Million) Forecast By Market Taxonomy, 2023 to 2033

        15.4.1. By Product Category

        15.4.2. By Product Type

        15.4.3. By Material

        15.4.4. By Age Group

        15.4.5. By Sales Channel

    15.5. Market Attractiveness Analysis

        15.5.1. By Product Category

        15.5.2. By Product Type

        15.5.3. By Material

        15.5.4. By Age Group

        15.5.5. By Sales Channel

    15.6. Market Trends

    15.7. Drivers and Restraints - Impact Analysis

    15.8. Key Players Participants - Intensity Mapping

16. North East Market Analysis 2018 to 2022 and Forecast 2023 to 2033

    16.1. Introduction

    16.2. Pricing Analysis

    16.3. Historical Market Size (US$ Million) Trend Analysis By Market Taxonomy, 2018 to 2022

    16.4. Market Size (US$ Million) Forecast By Market Taxonomy, 2023 to 2033

        16.4.1. By Product Category

        16.4.2. By Product Type

        16.4.3. By Material

        16.4.4. By Age Group

        16.4.5. By Sales Channel

    16.5. Market Attractiveness Analysis

        16.5.1. By Product Category

        16.5.2. By Product Type

        16.5.3. By Material

        16.5.4. By Age Group

        16.5.5. By Sales Channel

    16.6. Market Trends

    16.7. Drivers and Restraints - Impact Analysis

    16.8. Key Players Participants - Intensity Mapping

17. South East Market Analysis 2018 to 2022 and Forecast 2023 to 2033

    17.1. Introduction

    17.2. Pricing Analysis

    17.3. Historical Market Size (US$ Million) Trend Analysis By Market Taxonomy, 2018 to 2022

    17.4. Market Size (US$ Million) Forecast By Market Taxonomy, 2023 to 2033

        17.4.1. By Product Category

        17.4.2. By Product Type

        17.4.3. By Material

        17.4.4. By Age Group

        17.4.5. By Sales Channel

    17.5. Market Attractiveness Analysis

        17.5.1. By Product Category

        17.5.2. By Product Type

        17.5.3. By Material

        17.5.4. By Age Group

        17.5.5. By Sales Channel

    17.6. Market Trends

    17.7. Drivers and Restraints - Impact Analysis

    17.8. Key Players Participants - Intensity Mapping

18. South West Market Analysis 2018 to 2022 and Forecast 2023 to 2033

    18.1. Introduction

    18.2. Pricing Analysis

    18.3. Historical Market Size (US$ Million) Trend Analysis By Market Taxonomy, 2018 to 2022

    18.4. Market Size (US$ Million) Forecast By Market Taxonomy, 2023 to 2033

        18.4.1. By Product Category

        18.4.2. By Product Type

        18.4.3. By Material

        18.4.4. By Age Group

        18.4.5. By Sales Channel

    18.5. Market Attractiveness Analysis

        18.5.1. By Product Category

        18.5.2. By Product Type

        18.5.3. By Material

        18.5.4. By Price

        18.5.5. By Age Group

        18.5.6. By Sales Channel

    18.6. Market Trends

    18.7. Drivers and Restraints - Impact Analysis

    18.8. Key Players Participants - Intensity Mapping

19. Market Structure Analysis

    19.1. Market Analysis by Tier of Companies (Dog Toys)

    19.2. Market Share Analysis of Top Players

    19.3. Market Presence Analysis

20. Competition Analysis

    20.1. Competition Dashboard

    20.2. Competition Benchmarking

    20.3. Competition Deep Dive

        20.3.1. American Dog

            20.3.1.1. Overview

            20.3.1.2. Product Portfolio

            20.3.1.3. Profitability by Market Segments (Product Category/Product Type/Material/Age Group/Sales Channel/Region)

            20.3.1.4. Sales Footprint

            20.3.1.5. Strategy Overview

        20.3.2. COLLAR LLC

            20.3.2.1. Overview

            20.3.2.2. Product Portfolio

            20.3.2.3. Profitability by Market Segments (Product Category/Product Type/Material/Age Group/Sales Channel/Region)

            20.3.2.4. Sales Footprint

            20.3.2.5. Strategy Overview

        20.3.3. Doskocil Manufacturing Company Inc.

            20.3.3.1. Overview

            20.3.3.2. Product Portfolio

            20.3.3.3. Profitability by Market Segments (Product Category/Product Type/Material/Age Group/Sales Channel/Region)

            20.3.3.4. Sales Footprint

            20.3.3.5. Strategy Overview

        20.3.4. Ethical Products Inc.

            20.3.4.1. Overview

            20.3.4.2. Product Portfolio

            20.3.4.3. Profitability by Market Segments (Product Category/Product Type/Material/Age Group/Sales Channel/Region)

            20.3.4.4. Sales Footprint

            20.3.4.5. Strategy Overview

        20.3.5. Goughnuts Inc.

            20.3.5.1. Overview

            20.3.5.2. Product Portfolio

            20.3.5.3. Profitability by Market Segments (Product Category/Product Type/Material/Age Group/Sales Channel/Region)

            20.3.5.4. Sales Footprint

            20.3.5.5. Strategy Overview

        20.3.6. Hagen Inc.

            20.3.6.1. Overview

            20.3.6.2. Product Portfolio

            20.3.6.3. Profitability by Market Segments (Product Category/Product Type/Material/Age Group/Sales Channel/Region)

            20.3.6.4. Sales Footprint

            20.3.6.5. Strategy Overview

        20.3.7. Penn-Plax Inc.

            20.3.7.1. Overview

            20.3.7.2. Product Portfolio

            20.3.7.3. Profitability by Market Segments (Product Category/Product Type/Material/Age Group/Sales Channel/Region)

            20.3.7.4. Sales Footprint

            20.3.7.5. Strategy Overview

        20.3.8. Radio Systems Corporation

            20.3.8.1. Overview

            20.3.8.2. Product Portfolio

            20.3.8.3. Profitability by Market Segments (Product Category/Product Type/Material/Age Group/Sales Channel/Region)

            20.3.8.4. Sales Footprint

            20.3.8.5. Strategy Overview

        20.3.9. Unicharm Corporation

            20.3.9.1. Overview

            20.3.9.2. Product Portfolio

            20.3.9.3. Profitability by Market Segments (Product Category/Product Type/Material/Age Group/Sales Channel/Region)

            20.3.9.4. Sales Footprint

            20.3.9.5. Strategy Overview

        20.3.10. West Paw Inc.

            20.3.10.1. Overview

            20.3.10.2. Product Portfolio

            20.3.10.3. Profitability by Market Segments (Product Category/Product Type/Material/Age Group/Sales Channel/Region)

            20.3.10.4. Sales Footprint

            20.3.10.5. Strategy Overview

        20.3.11. Others (as requested)

            20.3.11.1. Overview

            20.3.11.2. Product Portfolio

            20.3.11.3. Profitability by Market Segments (Product Category/Product Type/Material/Age Group/Sales Channel/Region)

            20.3.11.4. Sales Footprint

            20.3.11.5. Strategy Overview

21. Assumptions and Acronyms Used

22. Research Methodology

List of Tables

Table 1: Market Value (US$ Million) Analysis By Product Category, 2018 to 2033

Table 2: Market Volume (Units) Analysis By Product Category, 2018 to 2033

Table 3: Market Value (US$ Million) Analysis By Product Type, 2018 to 2033

Table 4: Market Volume (Units) Analysis By Product Type, 2018 to 2033

Table 5: Market Value (US$ Million) Analysis By Material, 2018 to 2033

Table 6: Market Volume (Units) Analysis By Material, 2018 to 2033

Table 7: Market Value (US$ Million) Analysis By Age Group, 2018 to 2033

Table 8: Market Volume (Units) Analysis By Age Group, 2018 to 2033

Table 9: Market Value (US$ Million) Analysis By Distribution Channel, 2018 to 2033

Table 10: Market Volume (Units) Analysis By Distribution Channel, 2018 to 2033

Table 11: West Region Market Value (US$ Million) Analysis By Product Category, 2018 to 2033

Table 12: West Region Market Volume (Units) Analysis By Product Category, 2018 to 2033

Table 13: West Region Market Value (US$ Million) Analysis By Product Type, 2018 to 2033

Table 14: West Region Market Volume (Units) Analysis By Product Type, 2018 to 2033

Table 15: West Region Market Value (US$ Million) Analysis By Material, 2018 to 2033

Table 16: West Region Market Volume (Units) Analysis By Material, 2018 to 2033

Table 17: West Region Market Value (US$ Million) Analysis By Age Group, 2018 to 2033

Table 18: West Region Market Volume (Units) Analysis By Age Group, 2018 to 2033

Table 19: West Region Market Value (US$ Million) Analysis By Distribution Channel, 2018 to 2033

Table 20: West Region Market Volume (Units) Analysis By Distribution Channel, 2018 to 2033

Table 21: South East Region Market Value (US$ Million) Analysis By Product Category, 2018 to 2033

Table 22: South East Region Market Volume (Units) Analysis By Product Category, 2018 to 2033

Table 23: South East Region Market Value (US$ Million) Analysis By Product Type, 2018 to 2033

Table 24: South East Region Market Volume (Units) Analysis By Product Type, 2018 to 2033

Table 25: South East Region Market Value (US$ Million) Analysis By Material, 2018 to 2033

Table 26: South East Region Market Volume (Units) Analysis By Material, 2018 to 2033

Table 27: South East Region Market Value (US$ Million) Analysis By Age Group, 2018 to 2033

Table 28: South East Region Market Volume (Units) Analysis By Age Group, 2018 to 2033

Table 29: South East Region Market Value (US$ Million) Analysis By Distribution Channel, 2018 to 2033

Table 30: South East Region Market Volume (Units) Analysis By Distribution Channel, 2018 to 2033

Table 31: South West Region Market Value (US$ Million) Analysis By Product Category, 2018 to 2033

Table 32: South West Region Market Volume (Units) Analysis By Product Category, 2018 to 2033

Table 33: South West Region Market Value (US$ Million) Analysis By Product Type, 2018 to 2033

Table 34: South West Region Market Volume (Units) Analysis By Product Type, 2018 to 2033

Table 35: South West Region Market Value (US$ Million) Analysis By Material, 2018 to 2033

Table 36: South West Region Market Volume (Units) Analysis By Material, 2018 to 2033

Table 37: South West Region Market Value (US$ Million) Analysis By Age Group, 2018 to 2033

Table 38: South West Region Market Volume (Units) Analysis By Age Group, 2018 to 2033

Table 39: South West Region Market Value (US$ Million) Analysis By Distribution Channel, 2018 to 2033

Table 40: South West Region Market Volume (Units) Analysis By Distribution Channel, 2018 to 2033

Table 41: Mid-West Region Market Value (US$ Million) Analysis By Product Category, 2018 to 2033

Table 42: Mid-West Region Market Volume (Units) Analysis By Product Category, 2018 to 2033

Table 43: Mid-West Region Market Value (US$ Million) Analysis By Product Type, 2018 to 2033

Table 44: Mid-West Region Market Volume (Units) Analysis By Product Type, 2018 to 2033

Table 45: Mid-West Region Market Value (US$ Million) Analysis By Material, 2018 to 2033

Table 46: Mid-West Region Market Volume (Units) Analysis By Material, 2018 to 2033

Table 47: Mid-West Region Market Value (US$ Million) Analysis By Age Group, 2018 to 2033

Table 48: Mid-West Region Market Volume (Units) Analysis By Age Group, 2018 to 2033

Table 49: Mid-West Region Market Value (US$ Million) Analysis By Distribution Channel, 2018 to 2033

Table 50: Mid-West Region Market Volume (Units) Analysis By Distribution Channel, 2018 to 2033

Table 51: North East Region Market Value (US$ Million) Analysis By Product Category, 2018 to 2033

Table 52: North East Region Market Volume (Units) Analysis By Product Category, 2018 to 2033

Table 53: North East Region Market Value (US$ Million) Analysis By Product Type, 2018 to 2033

Table 54: North East Region Market Volume (Units) Analysis By Product Type, 2018 to 2033

Table 55: North East Region Market Value (US$ Million) Analysis By Material, 2018 to 2033

Table 56: North East Region Market Volume (Units) Analysis By Material, 2018 to 2033

Table 57: North East Region Market Value (US$ Million) Analysis By Age Group, 2018 to 2033

Table 58: North East Region Market Volume (Units) Analysis By Age Group, 2018 to 2033

Table 59: North East Region Market Value (US$ Million) Analysis By Distribution Channel, 2018 to 2033

Table 60: North East Region Market Volume (Units) Analysis By Distribution Channel, 2018 to 2033

List of Charts

Figure 1: Market Value (US$ Million) and Volume (Units) Analysis, 2018 to 2022

Figure 2: Market Value (US$ Million) and Volume (Units) Forecast, 2023 to 2033

Figure 3: Market Value (US$ Million) Analysis, 2018 to 2022

Figure 4: Market Value (US$ Million) Forecast, 2023 to 2033

Figure 5: Market Absolute $ Opportunity Value (US$ Million), 2023 to 2033

Figure 6: Market Value (US$ Million) Analysis By Product Category, 2018 to 2022

Figure 7: Market Volume (Units) Analysis By Product Category, 2018 to 2022

Figure 8: Market Y-o-Y Growth (%) Projections, By Product Category, 2023 to 2033

Figure 9: Market Attractiveness By Product Category, 2023 to 2033

Figure 10: Market Value (US$ Million) Analysis By Product Type, 2018 to 2022

Figure 11: Market Volume (Units) Analysis By Product Type, 2018 to 2022

Figure 12: Market Y-o-Y Growth (%) Projections, By Product Type, 2023 to 2033

Figure 13: Market Attractiveness By Product Type, 2023 to 2033

Figure 14: Market Value (US$ Million) Analysis By Material, 2018 to 2022

Figure 15: Market Volume (Units) Analysis By Material, 2018 to 2022

Figure 16: Market Y-o-Y Growth (%) Projections, By Material, 2023 to 2033

Figure 17: Market Attractiveness By Material, 2023 to 2033

Figure 18: Market Value (US$ Million) Analysis By Age Group, 2018 to 2022

Figure 19: Market Volume (Units) Analysis By Age Group, 2018 to 2022

Figure 20: Market Y-o-Y Growth (%) Projections, By Age Group, 2023 to 2033

Figure 21: Market Attractiveness By Age Group, 2023 to 2033

Figure 22: Market Value (US$ Million) Analysis By Distribution Channel, 2018 to 2022

Figure 23: Market Volume (Units) Analysis By Distribution Channel, 2018 to 2022

Figure 24: Market Y-o-Y Growth (%) Projections, By Distribution Channel, 2023 to 2033

Figure 25: Market Attractiveness By Distribution Channel, 2023 to 2033

Figure 26: Market Value (US$ Million) Analysis By Region, 2018 to 2022

Figure 27: Market Volume (Units) Analysis By Region, 2018 to 2022

Figure 28: Market Y-o-Y Growth (%) Projections, By Region, 2023 to 2033

Figure 29: Market Attractiveness By Region, 2023 to 2033

Figure 30: West Region Market Value (US$ Million) Analysis By Product Category, 2018 to 2022

Figure 31: West Region Market Volume (Units) Analysis By Product Category, 2018 to 2022

Figure 32: West Region Market Y-o-Y Growth (%) Projections, By Product Category, 2023 to 2033

Figure 33: West Region Market Attractiveness By Product Category, 2023 to 2033

Figure 34: West Region Market Value (US$ Million) Analysis By Product Type, 2018 to 2022

Figure 35: West Region Market Volume (Units) Analysis By Product Type, 2018 to 2022

Figure 36: West Region Market Y-o-Y Growth (%) Projections, By Product Type, 2023 to 2033

Figure 37: West Region Market Attractiveness By Product Type, 2023 to 2033

Figure 38: West Region Market Value (US$ Million) Analysis By Material, 2018 to 2022

Figure 39: West Region Market Volume (Units) Analysis By Material, 2018 to 2022

Figure 40: West Region Market Y-o-Y Growth (%) Projections, By Material, 2023 to 2033

Figure 41: West Region Market Attractiveness By Material, 2023 to 2033

Figure 42: West Region Market Value (US$ Million) Analysis By Age Group, 2018 to 2022

Figure 43: West Region Market Volume (Units) Analysis By Age Group, 2018 to 2022

Figure 44: West Region Market Y-o-Y Growth (%) Projections, By Age Group, 2023 to 2033

Figure 45: West Region Market Attractiveness By Age Group, 2023 to 2033

Figure 46: West Region Market Value (US$ Million) Analysis By Distribution Channel, 2018 to 2022

Figure 47: West Region Market Volume (Units) Analysis By Distribution Channel, 2018 to 2022

Figure 48: West Region Market Y-o-Y Growth (%) Projections, By Distribution Channel, 2023 to 2033

Figure 49: West Region Market Attractiveness By Distribution Channel, 2023 to 2033

Figure 50: South East Region Market Value (US$ Million) Analysis By Product Category, 2018 to 2022

Figure 51: South East Region Market Volume (Units) Analysis By Product Category, 2018 to 2022

Figure 52: South East Region Market Y-o-Y Growth (%) Projections, By Product Category, 2023 to 2033

Figure 53: South East Region Market Attractiveness By Product Category, 2023 to 2033

Figure 54: South East Region Market Value (US$ Million) Analysis By Product Type, 2018 to 2022

Figure 55: South East Region Market Volume (Units) Analysis By Product Type, 2018 to 2022

Figure 56: South East Region Market Y-o-Y Growth (%) Projections, By Product Type, 2023 to 2033

Figure 57: South East Region Market Attractiveness By Product Type, 2023 to 2033

Figure 58: South East Region Market Value (US$ Million) Analysis By Material, 2018 to 2022

Figure 59: South East Region Market Volume (Units) Analysis By Material, 2018 to 2022

Figure 60: South East Region Market Y-o-Y Growth (%) Projections, By Material, 2023 to 2033

Figure 61: South East Region Market Attractiveness By Material, 2023 to 2033

Figure 62: South East Region Market Value (US$ Million) Analysis By Age Group, 2018 to 2022

Figure 63: South East Region Market Volume (Units) Analysis By Age Group, 2018 to 2022

Figure 64: South East Region Market Y-o-Y Growth (%) Projections, By Age Group, 2023 to 2033

Figure 65: South East Region Market Attractiveness By Age Group, 2023 to 2033

Figure 66: South East Region Market Value (US$ Million) Analysis By Distribution Channel, 2018 to 2022

Figure 67: South East Region Market Volume (Units) Analysis By Distribution Channel, 2018 to 2022

Figure 68: South East Region Market Y-o-Y Growth (%) Projections, By Distribution Channel, 2023 to 2033

Figure 69: South East Region Market Attractiveness By Distribution Channel, 2023 to 2033

Figure 70: South West Region Market Value (US$ Million) Analysis By Product Category, 2018 to 2022

Figure 71: South West Region Market Volume (Units) Analysis By Product Category, 2018 to 2022

Figure 72: South West Region Market Y-o-Y Growth (%) Projections, By Product Category, 2023 to 2033

Figure 73: South West Region Market Attractiveness By Product Category, 2023 to 2033

Figure 74: South West Region Market Value (US$ Million) Analysis By Product Type, 2018 to 2022

Figure 75: South West Region Market Volume (Units) Analysis By Product Type, 2018 to 2022

Figure 76: South West Region Market Y-o-Y Growth (%) Projections, By Product Type, 2023 to 2033

Figure 77: South West Region Market Attractiveness By Product Type, 2023 to 2033

Figure 78: South West Region Market Value (US$ Million) Analysis By Material, 2018 to 2022

Figure 79: South West Region Market Volume (Units) Analysis By Material, 2018 to 2022

Figure 80: South West Region Market Y-o-Y Growth (%) Projections, By Material, 2023 to 2033

Figure 81: South West Region Market Attractiveness By Material, 2023 to 2033

Figure 82: South West Region Market Value (US$ Million) Analysis By Age Group, 2018 to 2022

Figure 83: South West Region Market Volume (Units) Analysis By Age Group, 2018 to 2022

Figure 84: South West Region Market Y-o-Y Growth (%) Projections, By Age Group, 2023 to 2033

Figure 85: South West Region Market Attractiveness By Age Group, 2023 to 2033

Figure 86: South West Region Market Value (US$ Million) Analysis By Distribution Channel, 2018 to 2022

Figure 87: South West Region Market Volume (Units) Analysis By Distribution Channel, 2018 to 2022

Figure 88: South West Region Market Y-o-Y Growth (%) Projections, By Distribution Channel, 2023 to 2033

Figure 89: South West Region Market Attractiveness By Distribution Channel, 2023 to 2033

Figure 90: Mid-West Region Market Value (US$ Million) Analysis By Product Category, 2018 to 2022

Figure 91: Mid-West Region Market Volume (Units) Analysis By Product Category, 2018 to 2022

Figure 92: Mid-West Region Market Y-o-Y Growth (%) Projections, By Product Category, 2023 to 2033

Figure 93: Mid-West Region Market Attractiveness By Product Category, 2023 to 2033

Figure 94: Mid-West Region Market Value (US$ Million) Analysis By Product Type, 2018 to 2022

Figure 95: Mid-West Region Market Volume (Units) Analysis By Product Type, 2018 to 2022

Figure 96: Mid-West Region Market Y-o-Y Growth (%) Projections, By Product Type, 2023 to 2033

Figure 97: Mid-West Region Market Attractiveness By Product Type, 2023 to 2033

Figure 98: Mid-West Region Market Value (US$ Million) Analysis By Material, 2018 to 2022

Figure 99: Mid-West Region Market Volume (Units) Analysis By Material, 2018 to 2022

Figure 100: Mid-West Region Market Y-o-Y Growth (%) Projections, By Material, 2023 to 2033

Figure 101: Mid-West Region Market Attractiveness By Material, 2023 to 2033

Figure 102: Mid-West Region Market Value (US$ Million) Analysis By Age Group, 2018 to 2022

Figure 103: Mid-West Region Market Volume (Units) Analysis By Age Group, 2018 to 2022

Figure 104: Mid-West Region Market Y-o-Y Growth (%) Projections, By Age Group, 2023 to 2033

Figure 105: Mid-West Region Market Attractiveness By Age Group, 2023 to 2033

Figure 106: Mid-West Region Market Value (US$ Million) Analysis By Distribution Channel, 2018 to 2022

Figure 107: Mid-West Region Market Volume (Units) Analysis By Distribution Channel, 2018 to 2022

Figure 108: Mid-West Region Market Y-o-Y Growth (%) Projections, By Distribution Channel, 2023 to 2033

Figure 109: Mid-West Region Market Attractiveness By Distribution Channel, 2023 to 2033

Figure 110: North East Region Market Value (US$ Million) Analysis By Product Category, 2018 to 2022

Figure 111: North East Region Market Volume (Units) Analysis By Product Category, 2018 to 2022

Figure 112: North East Region Market Y-o-Y Growth (%) Projections, By Product Category, 2023 to 2033

Figure 113: North East Region Market Attractiveness By Product Category, 2023 to 2033

Figure 114: North East Region Market Value (US$ Million) Analysis By Product Type, 2018 to 2022

Figure 115: North East Region Market Volume (Units) Analysis By Product Type, 2018 to 2022

Figure 116: North East Region Market Y-o-Y Growth (%) Projections, By Product Type, 2023 to 2033

Figure 117: North East Region Market Attractiveness By Product Type, 2023 to 2033

Figure 118: North East Region Market Value (US$ Million) Analysis By Material, 2018 to 2022

Figure 119: North East Region Market Volume (Units) Analysis By Material, 2018 to 2022

Figure 120: North East Region Market Y-o-Y Growth (%) Projections, By Material, 2023 to 2033

Figure 121: North East Region Market Attractiveness By Material, 2023 to 2033

Figure 122: North East Region Market Value (US$ Million) Analysis By Age Group, 2018 to 2022

Figure 123: North East Region Market Volume (Units) Analysis By Age Group, 2018 to 2022

Figure 124: North East Region Market Y-o-Y Growth (%) Projections, By Age Group, 2023 to 2033

Figure 125: North East Region Market Attractiveness By Age Group, 2023 to 2033

Figure 126: North East Region Market Value (US$ Million) Analysis By Distribution Channel, 2018 to 2022

Figure 127: North East Region Market Volume (Units) Analysis By Distribution Channel, 2018 to 2022

Figure 128: North East Region Market Y-o-Y Growth (%) Projections, By Distribution Channel, 2023 to 2033

Figure 129: North East Region Market Attractiveness By Distribution Channel, 2023 to 2033

Recommendations

Consumer Product

Pet Care Market

Published : August 2023

Consumer Product

Pet Carriers Market

Published : August 2023

Consumer Product

Pet Bathing Supplies Market

Published : July 2023

Consumer Product

Pet Toys Market

Published : February 2023

Explore Consumer Product Insights

View Reports

United States Dog Toys Market