This site uses cookies, including third-party cookies, that help us to provide and improve our services.

Privacy Policy
- Global Locations -
Headquarters
Future Market Insights, Inc.
Christiana Corporate, 200 Continental Drive, Suite 401, Newark, Delaware - 19713, United States
T: +1-845-579-5705
MEA
Market Access DMCC

1602-6 Jumeirah Bay X2 Tower, Plot No: JLT-PH2-X2A,

Jumeirah Lakes Towers, Dubai,

United Arab Emirates

Americas
Future Market Insights
616 Corporate Way, Suite 2-9018,
Valley Cottage, NY 10989,
United States
T: +1-347-918-3531
Europe
Future Market Insights
3rd Floor, 207 Regent Street,
London W1B 3HH
United Kingdom
T: + 44 (0) 20 8123 9659
D: +44 (0) 20 3287 4268
APAC
Future Market Insights
Office No. 401-A, 4th Floor,
VANTAGE 9, S.No. 36/1/1,
Baner, Pune 411045 India

Wall Covering Products Market

Market Insights on Wall Covering Products covering sales outlook, demand forecast & up-to-date key trends

Wall Covering Products Market Type, Application, Distribution Channel & Region - Forecast 2022 - 2032

Wall Covering Products Market Overview (2022-2032)

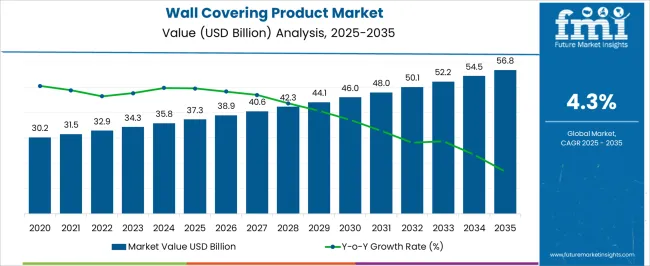
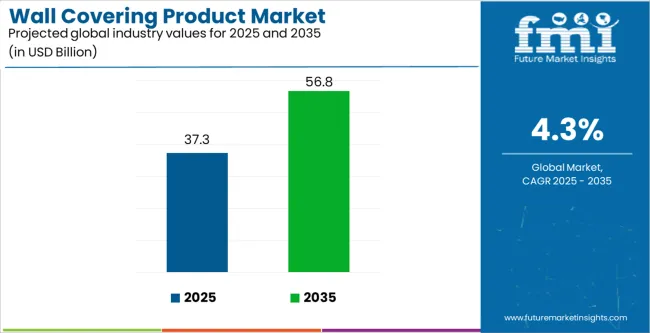
[250 Pages Report] The wall covering products market is projected to register a CAGR of 4.5% during the forecast period. It is likely to rise up from US$ 31.3 Bn in 2021 to reach a valuation of US$ 50.8 Bn by 2032.

The wall covering products market is anticipated to show promising growth prospects during the forecast period as a result of growing competition. New competitors are offering a variety of options at reasonable pricing to fulfil the demand for wall covering products making it more accessible to customers in the global wall covering products market.

The choice of wall covering products reflects the space's aesthetic, furnishings, technical needs, and overall quality. Wall covering products alter the room's look in a variety of ways. When compared to regular paints, sales of wall covering products are boosting due to the fact that they are not only cost-effective but also environmentally friendly. Its unique properties propel the sales of wall covering products forward in all directions.

Report Attribute

Details

Wall Covering Products Market Estimated Base Year Value (2021)

US$ 31.3 Billion

Wall Covering Products Market Expected Market Value (2022)

US$ 32.7 Billion

Wall Covering Products Market Anticipated Forecast Value (2032)

US$ 50.8 Billion

Wall Covering Products Market CAGR (2022-2032)

4.5 % CAGR

Washable, scrubbable, stain resistance, abrasion resistance, colorfastness, peel-able, strippable, pre-pasted, un-pasted, and self-adhesive are all properties that turn out to be needed hence pushing the demand for wall covering productsSales of wall covering products are expected to rise significantly. In addition to this, demand for wall covering products is rising on account of US$ 39 Bn by 2026. 

Increasing demand for wall covering products are also projected to contribute to the growth of the wall covering products market share. Manufacturers in the wall covering products market get a big platform from which to serve the whole demand for wall covering products. The worldwide wall covering products market is seeing increased competition. 

With growing competition, new competitors are offering a variety of options at reasonable pricing, fulfilling the demand for wall covering products more accessible to customers. For the printing of wall covering patterns, eco-friendly inks are currently being developed and launched. 

With all of the benefits, there are also drawbacks, such as wallpapers being damaged by water and fading with the time that impacts the sales of wall covering products. In the long run, research and technology solutions to these difficulties will increase the wall covering products market share for wall covering materials.

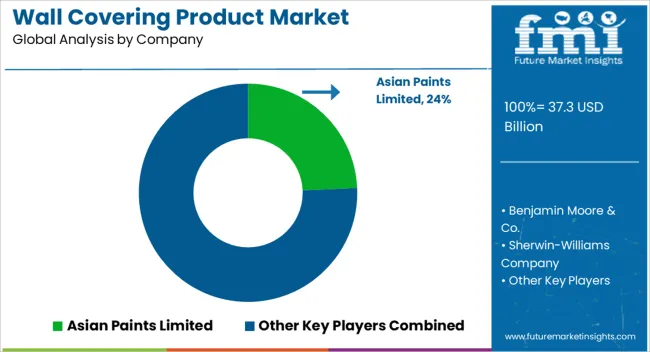
ADFORS, Architonic, A.S. Création Group, Brewster Home Fashion, Asian Paints Limited (APL), Marazzi Group, Walker Greenbank PLC, Benjamin Moore & Co., Ahlstrom-Munksjö Oyj, Nippon Paint Holdings Co. Ltd, J. Josephson Inc., and Grandeco Wallfashion Group are some of the leading participants in the wall covering products market.

Don't pay for what you don't need

Customize your report by selecting specific countries or regions and save 30%!

What are the Key Dynamics to the Wall Covering Products Market Share?

Sales of wall covering products are also rising due to its offering value to a place by providing a layer of protection to the real wall, hiding defects in the wall surface that paint cannot, and adding warmth and richness. The worldwide sales of wall covering products comprehends the manufacture, selling, and numerous unique qualities of wall covering products market.

The wall covering products market has traditionally benefited from wall covering materials' excellent flexibility to swiftly shifting trends. At a fraction of the cost, you may have your personalised design which ultimately is pushing the demand for wall covering products. As a result, many organisations are able to personalise their walls by using corporate colours, emblems, and even phrases are the reason for good sales of wall covering products in the market.

Which Region holds the Highest Growth Potential in the Wall Covering Products Market?

The sales of wall covering products are being driven by two major factors: increased investments in commercial buildings and an increase in the number of residential flats. The European wall covering products market is expected to be the largest market by creating a huge demand for wall covering products, but China dominates in terms of the number of enterprises producing them hence good sales of wall covering products

The Asia Pacific is expected to have the fastest-growing wall covering products market, owing to the region's rising economy and quickly growing population, which would increase the number of residential structures pushing for the sales of wall covering products

Nanotechnology and additive manufacturing are two new technologies that will increase the quality of wall covering products market. Participants of the wall covering products market are expected to introduce a wide range of wall panels and wallpapers, as well as eco-friendly interior paints.

Sneha Verghese
Sneha Verghese
Principal Consultant
LinkedIn
Talk to Analyst

Find your sweet spots for generating winning opportunities in this market.

Talk to Analyst

Who are the Key Players in the Wall Covering Products Market?

ADFORS, Architonic, A.S. Création Group, Brewster Home Fashion, Asian Paints Limited (APL), Marazzi Group, Walker Greenbank PLC, Benjamin Moore & Co., Ahlstrom-Munksjö Oyj, Nippon Paint Holdings Co. Ltd, J. Josephson Inc., and Grandeco Wallfashion Group are some of the leading participants in the wall covering products market.

Recent developments of the Wall Covering Products Market:

  • Brewster Home Fashion acquired the assets of Fetco Home Décor, Inc. in June 2017 to pursue its long-term aim of good sales of wall covering products.
  • Ultra Spec SCUFF-X, the first-of-its-kind, one-component interior latex paint built particularly to resist scuff marks in high-traffic, commercial applications, was introduced by Benjamin Moore & Co. in 2017.

Scope of Report

Report Attribute

Details

Growth rate

CAGR of 4.5% from 2022 to 2032

Base year for estimation

2021

Historical data

2015 - 2020

Forecast period

2022 - 2032

Quantitative units

Revenue in USD Million, volume in kilotons, and CAGR from 2022 to 2032

Report coverage

Revenue forecast, volume forecast, company ranking, competitive landscape, growth factors, and trends, Pricing Analysis,

Segments covered

Type, application, distribution channel, region

Regional scope

North America; Western Europe, Eastern Europe, Middle East, Africa, ASEAN, South Asia, Rest of Asia, Australia and New Zealand

Country scope

U.S.; Canada; Mexico; Germany; U.K.; France; Italy; Spain; Russia; Belgium; Poland; Czech Republic; China; India; Japan; Australia; Brazil; Argentina; Colombia; Saudi Arabia; UAE; Iran; South Africa

Key companies profiled

ADFORS, Architonic, A.S. Création Group, Brewster Home Fashion, Asian Paints Limited (APL), Marazzi Group, Walker Greenbank PLC, Benjamin Moore & Co., Ahlstrom-Munksjö Oyj, Nippon Paint Holdings Co. Ltd, J. Josephson Inc., and Grandeco Wallfashion Group

Customization scope

Free report customization (equivalent to up to 8 analysts working days) with purchase. Addition or alteration to country, regional & segment scope.

Pricing and purchase options

Avail of customized purchase options to meet your exact research needs.

Get the data you need at a Fraction of the cost

Personalize your report by choosing insights you need
and save 40%!

Key Segments For Wall Covering Products Market

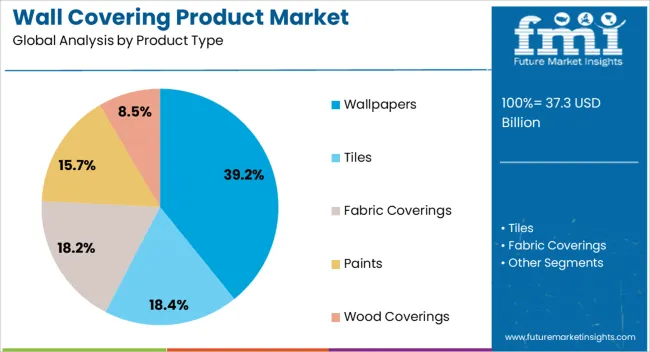
By Type:

  • Tiles
  • Fabric coverings
  • Wallpapers
  • Paints
  • Wood coverings

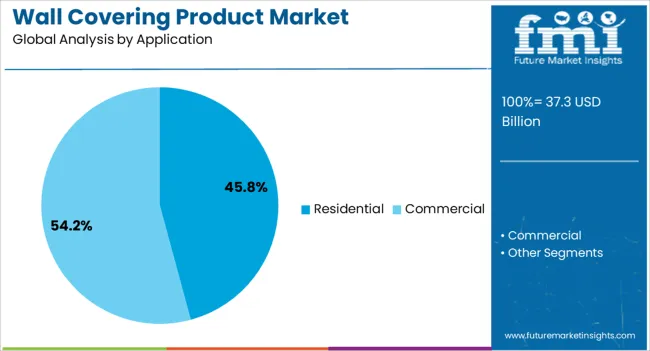
By Application:

  • Residential
  • Commercial

By Distribution Channel:

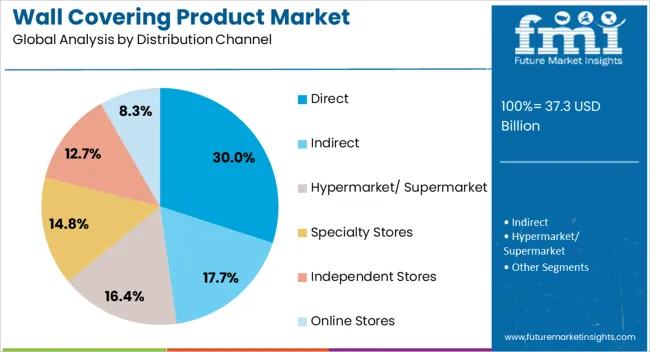
  • Direct
  • Indirect
  • Hypermarket/Supermarket
  • Specialty Stores
  • Independent Stores
  • Online Store
  • Others

By Region:

  • North America (U.S., Canada)
  • Latin America (Mexico, Brazil)
  • Europe (Germany, U.K., France, Italy, Spain, Poland, Russia)
  • East Asia (China, Japan, South Korea)
  • South Asia (India, Thailand, Malaysia, Vietnam, Indonesia)
  • Oceania (Australia, New Zealand)
  • Middle East & Africa (GCC Countries, Turkey, Northern Africa, South Africa)

Frequently Asked Questions

The wall covering products market is predicted to register a CAGR of 4.5% during the forecast period.

Key players holding substantial wall covering products market share include ADFORS, Architonic, A.S. Création Group, Brewster Home Fashion, Asian Paints Limited (APL), Marazzi Group, and many more.

As per the analysis, the wall covering products market share is likely to be US$ 39 Bn by 2026.

Demand for wall covering products is likely to rise due to its offering value to a place by providing a layer of protection to the real wall, hiding defects in the wall surface that paint cannot, and adding warmth and richness.

Table of Content

1. Executive Summary

    1.1. Global Market Outlook

    1.2. Demand-side Trends

    1.3. Supply-side Trends

    1.4. Technology Roadmap Analysis

    1.5. Analysis and Recommendations

2. Market Overview

    2.1. Market Coverage / Taxonomy

    2.2. Market Definition / Scope / Limitations

3. Market Background

    3.1. Market Dynamics

        3.1.1. Drivers

        3.1.2. Restraints

        3.1.3. Opportunity 

        3.1.4. Trends

    3.2. Scenario Forecast

        3.2.1. Demand in Optimistic Scenario

        3.2.2. Demand in Likely Scenario

        3.2.3. Demand in Conservative Scenario

    3.3. Opportunity Map Analysis

    3.4. Investment Feasibility Matrix

    3.5. PESTLE and Porter’s Analysis

    3.6. Regulatory Landscape

        3.6.1. By Key Regions

        3.6.2. By Key Countries

4. Global Market Analysis 2017-2021 and Forecast, 2022-2032

    4.1. Historical Market Size Value (US$ Mn) & Volume (Units) Analysis, 2017-2021

    4.2. Current and Future Market Size Value (US$ Mn) & Volume (Units) Projections, 2022-2032

        4.2.1. Y-o-Y Growth Trend Analysis

        4.2.2. Absolute $ Opportunity Analysis

5. Global Market Analysis 2017-2021 and Forecast 2022-2032, By Product Type

    5.1. Introduction / Key Findings

    5.2. Historical Market Size Value (US$ Mn) & Volume (Units) Analysis By Product Type, 2017-2021

    5.3. Current and Future Market Size Value (US$ Mn) & Volume (Units) Analysis and Forecast By Product Type, 2022-2032

        5.3.1. Wallpaper

        5.3.2. Wall Panels

        5.3.3. Paints & Coatings

        5.3.4. Decorative Tiles

        5.3.5. Others 

    5.4. Y-o-Y Growth Trend Analysis By Product Type, 2017-2021

    5.5. Absolute $ Opportunity Analysis By Product Type, 2022-2032

6. Global Market Analysis 2017-2021 and Forecast 2022-2032, By Application

    6.1. Introduction / Key Findings

    6.2. Historical Market Size Value (US$ Mn) & Volume (Units) Analysis By Application, 2017-2021

    6.3. Current and Future Market Size Value (US$ Mn) & Volume (Units) Analysis and Forecast By Application, 2022-2032

        6.3.1. Interior

        6.3.2. Exterior

    6.4. Y-o-Y Growth Trend Analysis By Application, 2017-2021

    6.5. Absolute $ Opportunity Analysis By Application, 2022-2032

7. Global Market Analysis 2017-2021 and Forecast 2022-2032, By End User

    7.1. Introduction / Key Findings

    7.2. Historical Market Size Value (US$ Mn) & Volume (Units) Analysis By End User, 2017-2021

    7.3. Current and Future Market Size Value (US$ Mn) & Volume (Units) Analysis and Forecast By End User, 2022-2032

        7.3.1. Residential

        7.3.2. Commercial

        7.3.3. Industrial

    7.4. Y-o-Y Growth Trend Analysis By End User, 2017-2021

    7.5. Absolute $ Opportunity Analysis By End User, 2022-2032

8. Global Market Analysis 2017-2021 and Forecast 2022-2032, By Sales Channels 

    8.1. Introduction / Key Findings

    8.2. Historical Market Size Value (US$ Mn) & Volume (Units) Analysis By Sales Channels , 2017-2021

    8.3. Current and Future Market Size Value (US$ Mn) & Volume (Units) Analysis and Forecast By Sales Channels , 2022-2032

        8.3.1. Specialty Store

        8.3.2. Home Center

        8.3.3. Building Material Dealer

        8.3.4. Furniture Store

        8.3.5. Mass Merchandizer

        8.3.6. E-commerce

    8.4. Y-o-Y Growth Trend Analysis By Sales Channels , 2017-2021

    8.5. Absolute $ Opportunity Analysis By Sales Channels , 2022-2032

9. Global Market Analysis 2017-2021 and Forecast 2022-2032, By Region

    9.1. Introduction

    9.2. Historical Market Size Value (US$ Mn) & Volume (Units) Analysis By Region, 2017-2021

    9.3. Current Market Size Value (US$ Mn) & Volume (Units) Analysis and Forecast By Region, 2022-2032

        9.3.1. North America

        9.3.2. Latin America

        9.3.3. Europe

        9.3.4. Asia Pacific

        9.3.5. MEA

    9.4. Market Attractiveness Analysis By Region

10. North America Market Analysis 2017-2021 and Forecast 2022-2032, By Country

    10.1. Historical Market Size Value (US$ Mn) & Volume (Units) Trend Analysis By Market Taxonomy, 2017-2021

    10.2. Market Size Value (US$ Mn) & Volume (Units) Forecast By Market Taxonomy, 2022-2032

        10.2.1. By Country

            10.2.1.1. U.S.

            10.2.1.2. Canada

        10.2.2. By Product Type

        10.2.3. By Application

        10.2.4. By End User

        10.2.5. By Sales Channels 

    10.3. Market Attractiveness Analysis

        10.3.1. By Country

        10.3.2. By Product Type

        10.3.3. By Application

        10.3.4. By End User

        10.3.5. By Sales Channels 

    10.4. Key Takeaways

11. Latin America Market Analysis 2017-2021 and Forecast 2022-2032, By Country

    11.1. Historical Market Size Value (US$ Mn) & Volume (Units) Trend Analysis By Market Taxonomy, 2017-2021

    11.2. Market Size Value (US$ Mn) & Volume (Units) Forecast By Market Taxonomy, 2022-2032

        11.2.1. By Country

            11.2.1.1. Brazil

            11.2.1.2. Mexico

            11.2.1.3. Rest of Latin America

        11.2.2. By Product Type

        11.2.3. By Application

        11.2.4. By End User

        11.2.5. By Sales Channels 

    11.3. Market Attractiveness Analysis

        11.3.1. By Country

        11.3.2. By Product Type

        11.3.3. By Application

        11.3.4. By End User

        11.3.5. By Sales Channels 

    11.4. Key Takeaways

12. Europe Market Analysis 2017-2021 and Forecast 2022-2032, By Country

    12.1. Historical Market Size Value (US$ Mn) & Volume (Units) Trend Analysis By Market Taxonomy, 2017-2021

    12.2. Market Size Value (US$ Mn) & Volume (Units) Forecast By Market Taxonomy, 2022-2032

        12.2.1. By Country

            12.2.1.1. Germany

            12.2.1.2. Italy

            12.2.1.3. France

            12.2.1.4. U.K.

            12.2.1.5. Spain

            12.2.1.6. Russia

            12.2.1.7. BENELUX

            12.2.1.8. Rest of Europe

        12.2.2. By Product Type

        12.2.3. By Application

        12.2.4. By End User

        12.2.5. By Sales Channels 

    12.3. Market Attractiveness Analysis

        12.3.1. By Country

        12.3.2. By Product Type

        12.3.3. By Application

        12.3.4. By End User

        12.3.5. By Sales Channels 

    12.4. Key Takeaways

13. Asia Pacific Market Analysis 2017-2021 and Forecast 2022-2032, By Country

    13.1. Historical Market Size Value (US$ Mn) & Volume (Units) Trend Analysis By Market Taxonomy, 2017-2021

    13.2. Market Size Value (US$ Mn) & Volume (Units) Forecast By Market Taxonomy, 2022-2032

        13.2.1. By Country

            13.2.1.1. China

            13.2.1.2. Japan

            13.2.1.3. South Korea

            13.2.1.4. India

            13.2.1.5. Rest of Asia Pacific

        13.2.2. By Product Type

        13.2.3. By Application

        13.2.4. By End User

        13.2.5. By Sales Channels 

    13.3. Market Attractiveness Analysis

        13.3.1. By Country

        13.3.2. By Product Type

        13.3.3. By Application

        13.3.4. By End User

        13.3.5. By Sales Channels 

    13.4. Key Takeaways

14. MEA Market Analysis 2017-2021 and Forecast 2022-2032, By Country

    14.1. Historical Market Size Value (US$ Mn) & Volume (Units) Trend Analysis By Market Taxonomy, 2017-2021

    14.2. Market Size Value (US$ Mn) & Volume (Units) Forecast By Market Taxonomy, 2022-2032

        14.2.1. By Country

            14.2.1.1. GCC

            14.2.1.2. Rest of MEA

        14.2.2. By Product Type

        14.2.3. By Application

        14.2.4. By End User

        14.2.5. By Sales Channels 

    14.3. Market Attractiveness Analysis

        14.3.1. By Country

        14.3.2. By Product Type

        14.3.3. By Application

        14.3.4. By End User

        14.3.5. By Sales Channels 

    14.4. Key Takeaways

15. Key Countries Market Analysis

    15.1. U.S.

        15.1.1. Pricing Analysis

        15.1.2. Market Share Analysis, 2021

            15.1.2.1. By Product Type

            15.1.2.2. By Application

            15.1.2.3. By End User

            15.1.2.4. By Sales Channels 

    15.2. Canada

        15.2.1. Pricing Analysis

        15.2.2. Market Share Analysis, 2021

            15.2.2.1. By Product Type

            15.2.2.2. By Application

            15.2.2.3. By End User

            15.2.2.4. By Sales Channels 

    15.3. Brazil

        15.3.1. Pricing Analysis

        15.3.2. Market Share Analysis, 2021

            15.3.2.1. By Product Type

            15.3.2.2. By Application

            15.3.2.3. By End User

            15.3.2.4. By Sales Channels 

    15.4. Mexico

        15.4.1. Pricing Analysis

        15.4.2. Market Share Analysis, 2021

            15.4.2.1. By Product Type

            15.4.2.2. By Application

            15.4.2.3. By End User

            15.4.2.4. By Sales Channels 

    15.5. Argentina

        15.5.1. Pricing Analysis

        15.5.2. Market Share Analysis, 2021

            15.5.2.1. By Product Type

            15.5.2.2. By Application

            15.5.2.3. By End User

            15.5.2.4. By Sales Channels 

    15.6. Germany

        15.6.1. Pricing Analysis

        15.6.2. Market Share Analysis, 2021

            15.6.2.1. By Product Type

            15.6.2.2. By Application

            15.6.2.3. By End User

            15.6.2.4. By Sales Channels 

    15.7. Italy

        15.7.1. Pricing Analysis

        15.7.2. Market Share Analysis, 2021

            15.7.2.1. By Product Type

            15.7.2.2. By Application

            15.7.2.3. By End User

            15.7.2.4. By Sales Channels 

    15.8. France

        15.8.1. Pricing Analysis

        15.8.2. Market Share Analysis, 2021

            15.8.2.1. By Product Type

            15.8.2.2. By Application

            15.8.2.3. By End User

            15.8.2.4. By Sales Channels 

    15.9. U.K.

        15.9.1. Pricing Analysis

        15.9.2. Market Share Analysis, 2021

            15.9.2.1. By Product Type

            15.9.2.2. By Application

            15.9.2.3. By End User

            15.9.2.4. By Sales Channels 

    15.10. Spain

        15.10.1. Pricing Analysis

        15.10.2. Market Share Analysis, 2021

            15.10.2.1. By Product Type

            15.10.2.2. By Application

            15.10.2.3. By End User

            15.10.2.4. By Sales Channels 

    15.11. Russia

        15.11.1. Pricing Analysis

        15.11.2. Market Share Analysis, 2021

            15.11.2.1. By Product Type

            15.11.2.2. By Application

            15.11.2.3. By End User

            15.11.2.4. By Sales Channels 

    15.12. BENELUX

        15.12.1. Pricing Analysis

        15.12.2. Market Share Analysis, 2021

            15.12.2.1. By Product Type

            15.12.2.2. By Application

            15.12.2.3. By End User

            15.12.2.4. By Sales Channels 

    15.13. China

        15.13.1. Pricing Analysis

        15.13.2. Market Share Analysis, 2021

            15.13.2.1. By Product Type

            15.13.2.2. By Application

            15.13.2.3. By End User

            15.13.2.4. By Sales Channels 

    15.14. Japan

        15.14.1. Pricing Analysis

        15.14.2. Market Share Analysis, 2021

            15.14.2.1. By Product Type

            15.14.2.2. By Application

            15.14.2.3. By End User

            15.14.2.4. By Sales Channels 

    15.15. South Korea

        15.15.1. Pricing Analysis

        15.15.2. Market Share Analysis, 2021

            15.15.2.1. By Product Type

            15.15.2.2. By Application

            15.15.2.3. By End User

            15.15.2.4. By Sales Channels 

    15.16. India

        15.16.1. Pricing Analysis

        15.16.2. Market Share Analysis, 2021

            15.16.2.1. By Product Type

            15.16.2.2. By Application

            15.16.2.3. By End User

            15.16.2.4. By Sales Channels 

    15.17. GCC Countries

        15.17.1. Pricing Analysis

        15.17.2. Market Share Analysis, 2021

            15.17.2.1. By Product Type

            15.17.2.2. By Application

            15.17.2.3. By End User

            15.17.2.4. By Sales Channels 

16. Market Structure Analysis

    16.1. Competition Dashboard

    16.2. Competition Benchmarking

    16.3. Market Share Analysis of Top Players

        16.3.1. By Regional

        16.3.2. By Product Type

        16.3.3. By Application

        16.3.4. By End User

        16.3.5. By Sales Channels 

17. Competition Analysis

    17.1. Competition Deep Dive

        17.1.1. Asian Paints Limited

            17.1.1.1. Overview

            17.1.1.2. Product Portfolio

            17.1.1.3. Profitability by Market Segment

            17.1.1.4. Sales Footprint

            17.1.1.5. Strategy Overview

                17.1.1.5.1. Marketing Strategy

                17.1.1.5.2. Product Strategy

        17.1.2. Benjamin Moore & Co.

            17.1.2.1. Overview

            17.1.2.2. Product Portfolio

            17.1.2.3. Profitability by Market Segment

            17.1.2.4. Sales Footprint

            17.1.2.5. Strategy Overview

                17.1.2.5.1. Marketing Strategy

                17.1.2.5.2. Product Strategy

        17.1.3. Sherwin-Williams Company

            17.1.3.1. Overview

            17.1.3.2. Product Portfolio

            17.1.3.3. Profitability by Market Segment

            17.1.3.4. Sales Footprint

            17.1.3.5. Strategy Overview

                17.1.3.5.1. Marketing Strategy

                17.1.3.5.2. Product Strategy

        17.1.4. Valspar Corporation

            17.1.4.1. Overview

            17.1.4.2. Product Portfolio

            17.1.4.3. Profitability by Market Segment

            17.1.4.4. Sales Footprint

            17.1.4.5. Strategy Overview

                17.1.4.5.1. Marketing Strategy

                17.1.4.5.2. Product Strategy

        17.1.5. Dal-Tile Corporation

            17.1.5.1. Overview

            17.1.5.2. Product Portfolio

            17.1.5.3. Profitability by Market Segment

            17.1.5.4. Sales Footprint

            17.1.5.5. Strategy Overview

                17.1.5.5.1. Marketing Strategy

                17.1.5.5.2. Product Strategy

        17.1.6. Crossville Inc.

            17.1.6.1. Overview

            17.1.6.2. Product Portfolio

            17.1.6.3. Profitability by Market Segment

            17.1.6.4. Sales Footprint

            17.1.6.5. Strategy Overview

                17.1.6.5.1. Marketing Strategy

                17.1.6.5.2. Product Strategy

        17.1.7. Emilgroup

            17.1.7.1. Overview

            17.1.7.2. Product Portfolio

            17.1.7.3. Profitability by Market Segment

            17.1.7.4. Sales Footprint

            17.1.7.5. Strategy Overview

                17.1.7.5.1. Marketing Strategy

                17.1.7.5.2. Product Strategy

        17.1.8. Marazzi Group S.r.l.

            17.1.8.1. Overview

            17.1.8.2. Product Portfolio

            17.1.8.3. Profitability by Market Segment

            17.1.8.4. Sales Footprint

            17.1.8.5. Strategy Overview

                17.1.8.5.1. Marketing Strategy

                17.1.8.5.2. Product Strategy

        17.1.9. Johnson Decorative Tiles

            17.1.9.1. Overview

            17.1.9.2. Product Portfolio

            17.1.9.3. Profitability by Market Segment

            17.1.9.4. Sales Footprint

            17.1.9.5. Strategy Overview

                17.1.9.5.1. Marketing Strategy

                17.1.9.5.2. Product Strategy

        17.1.10. Brewster Home Fashions LLC

            17.1.10.1. Overview

            17.1.10.2. Product Portfolio

            17.1.10.3. Profitability by Market Segment

            17.1.10.4. Sales Footprint

            17.1.10.5. Strategy Overview

                17.1.10.5.1. Marketing Strategy

                17.1.10.5.2. Product Strategy

        17.1.11. F. Schumacher & Co.

            17.1.11.1. Overview

            17.1.11.2. Product Portfolio

            17.1.11.3. Profitability by Market Segment

            17.1.11.4. Sales Footprint

            17.1.11.5. Strategy Overview

                17.1.11.5.1. Marketing Strategy

                17.1.11.5.2. Product Strategy

        17.1.12. Designtex Group Inc

            17.1.12.1. Overview

            17.1.12.2. Product Portfolio

            17.1.12.3. Profitability by Market Segment

            17.1.12.4. Sales Footprint

            17.1.12.5. Strategy Overview

                17.1.12.5.1. Marketing Strategy

                17.1.12.5.2. Product Strategy

        17.1.13. Decorative Panels International

            17.1.13.1. Overview

            17.1.13.2. Product Portfolio

            17.1.13.3. Profitability by Market Segment

            17.1.13.4. Sales Footprint

            17.1.13.5. Strategy Overview

                17.1.13.5.1. Marketing Strategy

                17.1.13.5.2. Product Strategy

        17.1.14. Georgia-Pacific LLC

            17.1.14.1. Overview

            17.1.14.2. Product Portfolio

            17.1.14.3. Profitability by Market Segment

            17.1.14.4. Sales Footprint

            17.1.14.5. Strategy Overview

                17.1.14.5.1. Marketing Strategy

                17.1.14.5.2. Product Strategy

        17.1.15. Nippon Paint Co. Ltd.

            17.1.15.1. Overview

            17.1.15.2. Product Portfolio

            17.1.15.3. Profitability by Market Segment

            17.1.15.4. Sales Footprint

            17.1.15.5. Strategy Overview

                17.1.15.5.1. Marketing Strategy

                17.1.15.5.2. Product Strategy

        17.1.16. Wilsonart LLC

            17.1.16.1. Overview

            17.1.16.2. Product Portfolio

            17.1.16.3. Profitability by Market Segment

            17.1.16.4. Sales Footprint

            17.1.16.5. Strategy Overview

                17.1.16.5.1. Marketing Strategy

                17.1.16.5.2. Product Strategy

18. Assumptions & Acronyms Used

19. Research Methodology

Don't pay for what you don't need

Customize your report by selecting specific countries or regions and save 30%!

List of Tables

Table 1: Global Market Value (US$ Mn) Forecast by Region, 2017-2032

Table 2: Global Market Volume (Units) Forecast by Region, 2017-2032

Table 3: Global Market Value (US$ Mn) Forecast by Product Type, 2017-2032

Table 4: Global Market Volume (Units) Forecast by Product Type, 2017-2032

Table 5: Global Market Value (US$ Mn) Forecast by Application, 2017-2032

Table 6: Global Market Volume (Units) Forecast by Application, 2017-2032

Table 7: Global Market Value (US$ Mn) Forecast by End User, 2017-2032

Table 8: Global Market Volume (Units) Forecast by End User, 2017-2032

Table 9: Global Market Value (US$ Mn) Forecast by Sales Channels , 2017-2032

Table 10: Global Market Volume (Units) Forecast by Sales Channels , 2017-2032

Table 11: North America Market Value (US$ Mn) Forecast by Country, 2017-2032

Table 12: North America Market Volume (Units) Forecast by Country, 2017-2032

Table 13: North America Market Value (US$ Mn) Forecast by Product Type, 2017-2032

Table 14: North America Market Volume (Units) Forecast by Product Type, 2017-2032

Table 15: North America Market Value (US$ Mn) Forecast by Application, 2017-2032

Table 16: North America Market Volume (Units) Forecast by Application, 2017-2032

Table 17: North America Market Value (US$ Mn) Forecast by End User, 2017-2032

Table 18: North America Market Volume (Units) Forecast by End User, 2017-2032

Table 19: North America Market Value (US$ Mn) Forecast by Sales Channels , 2017-2032

Table 20: North America Market Volume (Units) Forecast by Sales Channels , 2017-2032

Table 21: Latin America Market Value (US$ Mn) Forecast by Country, 2017-2032

Table 22: Latin America Market Volume (Units) Forecast by Country, 2017-2032

Table 23: Latin America Market Value (US$ Mn) Forecast by Product Type, 2017-2032

Table 24: Latin America Market Volume (Units) Forecast by Product Type, 2017-2032

Table 25: Latin America Market Value (US$ Mn) Forecast by Application, 2017-2032

Table 26: Latin America Market Volume (Units) Forecast by Application, 2017-2032

Table 27: Latin America Market Value (US$ Mn) Forecast by End User, 2017-2032

Table 28: Latin America Market Volume (Units) Forecast by End User, 2017-2032

Table 29: Latin America Market Value (US$ Mn) Forecast by Sales Channels , 2017-2032

Table 30: Latin America Market Volume (Units) Forecast by Sales Channels , 2017-2032

Table 31: Europe Market Value (US$ Mn) Forecast by Country, 2017-2032

Table 32: Europe Market Volume (Units) Forecast by Country, 2017-2032

Table 33: Europe Market Value (US$ Mn) Forecast by Product Type, 2017-2032

Table 34: Europe Market Volume (Units) Forecast by Product Type, 2017-2032

Table 35: Europe Market Value (US$ Mn) Forecast by Application, 2017-2032

Table 36: Europe Market Volume (Units) Forecast by Application, 2017-2032

Table 37: Europe Market Value (US$ Mn) Forecast by End User, 2017-2032

Table 38: Europe Market Volume (Units) Forecast by End User, 2017-2032

Table 39: Europe Market Value (US$ Mn) Forecast by Sales Channels , 2017-2032

Table 40: Europe Market Volume (Units) Forecast by Sales Channels , 2017-2032

Table 41: Asia Pacific Market Value (US$ Mn) Forecast by Country, 2017-2032

Table 42: Asia Pacific Market Volume (Units) Forecast by Country, 2017-2032

Table 43: Asia Pacific Market Value (US$ Mn) Forecast by Product Type, 2017-2032

Table 44: Asia Pacific Market Volume (Units) Forecast by Product Type, 2017-2032

Table 45: Asia Pacific Market Value (US$ Mn) Forecast by Application, 2017-2032

Table 46: Asia Pacific Market Volume (Units) Forecast by Application, 2017-2032

Table 47: Asia Pacific Market Value (US$ Mn) Forecast by End User, 2017-2032

Table 48: Asia Pacific Market Volume (Units) Forecast by End User, 2017-2032

Table 49: Asia Pacific Market Value (US$ Mn) Forecast by Sales Channels , 2017-2032

Table 50: Asia Pacific Market Volume (Units) Forecast by Sales Channels , 2017-2032

Table 51: MEA Market Value (US$ Mn) Forecast by Country, 2017-2032

Table 52: MEA Market Volume (Units) Forecast by Country, 2017-2032

Table 53: MEA Market Value (US$ Mn) Forecast by Product Type, 2017-2032

Table 54: MEA Market Volume (Units) Forecast by Product Type, 2017-2032

Table 55: MEA Market Value (US$ Mn) Forecast by Application, 2017-2032

Table 56: MEA Market Volume (Units) Forecast by Application, 2017-2032

Table 57: MEA Market Value (US$ Mn) Forecast by End User, 2017-2032

Table 58: MEA Market Volume (Units) Forecast by End User, 2017-2032

Table 59: MEA Market Value (US$ Mn) Forecast by Sales Channels , 2017-2032

Table 60: MEA Market Volume (Units) Forecast by Sales Channels , 2017-2032
Sneha Verghese
Sneha Verghese
Principal Consultant
LinkedIn
Talk to Analyst

Find your sweet spots for generating winning opportunities in this market.

Talk to Analyst

List of Charts

Figure 1: Global Market Value (US$ Mn) by Product Type, 2022-2032

Figure 2: Global Market Value (US$ Mn) by Application, 2022-2032

Figure 3: Global Market Value (US$ Mn) by End User, 2022-2032

Figure 4: Global Market Value (US$ Mn) by Sales Channels , 2022-2032

Figure 5: Global Market Value (US$ Mn) by Region, 2022-2032

Figure 6: Global Market Value (US$ Mn) Analysis by Region, 2017-2032

Figure 7: Global Market Volume (Units) Analysis by Region, 2017-2032

Figure 8: Global Market Value Share (%) and BPS Analysis by Region, 2022-2032

Figure 9: Global Market Y-o-Y Growth (%) Projections by Region, 2022-2032

Figure 10: Global Market Value (US$ Mn) Analysis by Product Type, 2017-2032

Figure 11: Global Market Volume (Units) Analysis by Product Type, 2017-2032

Figure 12: Global Market Value Share (%) and BPS Analysis by Product Type, 2022-2032

Figure 13: Global Market Y-o-Y Growth (%) Projections by Product Type, 2022-2032

Figure 14: Global Market Value (US$ Mn) Analysis by Application, 2017-2032

Figure 15: Global Market Volume (Units) Analysis by Application, 2017-2032

Figure 16: Global Market Value Share (%) and BPS Analysis by Application, 2022-2032

Figure 17: Global Market Y-o-Y Growth (%) Projections by Application, 2022-2032

Figure 18: Global Market Value (US$ Mn) Analysis by End User, 2017-2032

Figure 19: Global Market Volume (Units) Analysis by End User, 2017-2032

Figure 20: Global Market Value Share (%) and BPS Analysis by End User, 2022-2032

Figure 21: Global Market Y-o-Y Growth (%) Projections by End User, 2022-2032

Figure 22: Global Market Value (US$ Mn) Analysis by Sales Channels , 2017-2032

Figure 23: Global Market Volume (Units) Analysis by Sales Channels , 2017-2032

Figure 24: Global Market Value Share (%) and BPS Analysis by Sales Channels , 2022-2032

Figure 25: Global Market Y-o-Y Growth (%) Projections by Sales Channels , 2022-2032

Figure 26: Global Market Attractiveness by Product Type, 2022-2032

Figure 27: Global Market Attractiveness by Application, 2022-2032

Figure 28: Global Market Attractiveness by End User, 2022-2032

Figure 29: Global Market Attractiveness by Sales Channels , 2022-2032

Figure 30: Global Market Attractiveness by Region, 2022-2032

Figure 31: North America Market Value (US$ Mn) by Product Type, 2022-2032

Figure 32: North America Market Value (US$ Mn) by Application, 2022-2032

Figure 33: North America Market Value (US$ Mn) by End User, 2022-2032

Figure 34: North America Market Value (US$ Mn) by Sales Channels , 2022-2032

Figure 35: North America Market Value (US$ Mn) by Country, 2022-2032

Figure 36: North America Market Value (US$ Mn) Analysis by Country, 2017-2032

Figure 37: North America Market Volume (Units) Analysis by Country, 2017-2032

Figure 38: North America Market Value Share (%) and BPS Analysis by Country, 2022-2032

Figure 39: North America Market Y-o-Y Growth (%) Projections by Country, 2022-2032

Figure 40: North America Market Value (US$ Mn) Analysis by Product Type, 2017-2032

Figure 41: North America Market Volume (Units) Analysis by Product Type, 2017-2032

Figure 42: North America Market Value Share (%) and BPS Analysis by Product Type, 2022-2032

Figure 43: North America Market Y-o-Y Growth (%) Projections by Product Type, 2022-2032

Figure 44: North America Market Value (US$ Mn) Analysis by Application, 2017-2032

Figure 45: North America Market Volume (Units) Analysis by Application, 2017-2032

Figure 46: North America Market Value Share (%) and BPS Analysis by Application, 2022-2032

Figure 47: North America Market Y-o-Y Growth (%) Projections by Application, 2022-2032

Figure 48: North America Market Value (US$ Mn) Analysis by End User, 2017-2032

Figure 49: North America Market Volume (Units) Analysis by End User, 2017-2032

Figure 50: North America Market Value Share (%) and BPS Analysis by End User, 2022-2032

Figure 51: North America Market Y-o-Y Growth (%) Projections by End User, 2022-2032

Figure 52: North America Market Value (US$ Mn) Analysis by Sales Channels , 2017-2032

Figure 53: North America Market Volume (Units) Analysis by Sales Channels , 2017-2032

Figure 54: North America Market Value Share (%) and BPS Analysis by Sales Channels , 2022-2032

Figure 55: North America Market Y-o-Y Growth (%) Projections by Sales Channels , 2022-2032

Figure 56: North America Market Attractiveness by Product Type, 2022-2032

Figure 57: North America Market Attractiveness by Application, 2022-2032

Figure 58: North America Market Attractiveness by End User, 2022-2032

Figure 59: North America Market Attractiveness by Sales Channels , 2022-2032

Figure 60: North America Market Attractiveness by Country, 2022-2032

Figure 61: Latin America Market Value (US$ Mn) by Product Type, 2022-2032

Figure 62: Latin America Market Value (US$ Mn) by Application, 2022-2032

Figure 63: Latin America Market Value (US$ Mn) by End User, 2022-2032

Figure 64: Latin America Market Value (US$ Mn) by Sales Channels , 2022-2032

Figure 65: Latin America Market Value (US$ Mn) by Country, 2022-2032

Figure 66: Latin America Market Value (US$ Mn) Analysis by Country, 2017-2032

Figure 67: Latin America Market Volume (Units) Analysis by Country, 2017-2032

Figure 68: Latin America Market Value Share (%) and BPS Analysis by Country, 2022-2032

Figure 69: Latin America Market Y-o-Y Growth (%) Projections by Country, 2022-2032

Figure 70: Latin America Market Value (US$ Mn) Analysis by Product Type, 2017-2032

Figure 71: Latin America Market Volume (Units) Analysis by Product Type, 2017-2032

Figure 72: Latin America Market Value Share (%) and BPS Analysis by Product Type, 2022-2032

Figure 73: Latin America Market Y-o-Y Growth (%) Projections by Product Type, 2022-2032

Figure 74: Latin America Market Value (US$ Mn) Analysis by Application, 2017-2032

Figure 75: Latin America Market Volume (Units) Analysis by Application, 2017-2032

Figure 76: Latin America Market Value Share (%) and BPS Analysis by Application, 2022-2032

Figure 77: Latin America Market Y-o-Y Growth (%) Projections by Application, 2022-2032

Figure 78: Latin America Market Value (US$ Mn) Analysis by End User, 2017-2032

Figure 79: Latin America Market Volume (Units) Analysis by End User, 2017-2032

Figure 80: Latin America Market Value Share (%) and BPS Analysis by End User, 2022-2032

Figure 81: Latin America Market Y-o-Y Growth (%) Projections by End User, 2022-2032

Figure 82: Latin America Market Value (US$ Mn) Analysis by Sales Channels , 2017-2032

Figure 83: Latin America Market Volume (Units) Analysis by Sales Channels , 2017-2032

Figure 84: Latin America Market Value Share (%) and BPS Analysis by Sales Channels , 2022-2032

Figure 85: Latin America Market Y-o-Y Growth (%) Projections by Sales Channels , 2022-2032

Figure 86: Latin America Market Attractiveness by Product Type, 2022-2032

Figure 87: Latin America Market Attractiveness by Application, 2022-2032

Figure 88: Latin America Market Attractiveness by End User, 2022-2032

Figure 89: Latin America Market Attractiveness by Sales Channels , 2022-2032

Figure 90: Latin America Market Attractiveness by Country, 2022-2032

Figure 91: Europe Market Value (US$ Mn) by Product Type, 2022-2032

Figure 92: Europe Market Value (US$ Mn) by Application, 2022-2032

Figure 93: Europe Market Value (US$ Mn) by End User, 2022-2032

Figure 94: Europe Market Value (US$ Mn) by Sales Channels , 2022-2032

Figure 95: Europe Market Value (US$ Mn) by Country, 2022-2032

Figure 96: Europe Market Value (US$ Mn) Analysis by Country, 2017-2032

Figure 97: Europe Market Volume (Units) Analysis by Country, 2017-2032

Figure 98: Europe Market Value Share (%) and BPS Analysis by Country, 2022-2032

Figure 99: Europe Market Y-o-Y Growth (%) Projections by Country, 2022-2032

Figure 100: Europe Market Value (US$ Mn) Analysis by Product Type, 2017-2032

Figure 101: Europe Market Volume (Units) Analysis by Product Type, 2017-2032

Figure 102: Europe Market Value Share (%) and BPS Analysis by Product Type, 2022-2032

Figure 103: Europe Market Y-o-Y Growth (%) Projections by Product Type, 2022-2032

Figure 104: Europe Market Value (US$ Mn) Analysis by Application, 2017-2032

Figure 105: Europe Market Volume (Units) Analysis by Application, 2017-2032

Figure 106: Europe Market Value Share (%) and BPS Analysis by Application, 2022-2032

Figure 107: Europe Market Y-o-Y Growth (%) Projections by Application, 2022-2032

Figure 108: Europe Market Value (US$ Mn) Analysis by End User, 2017-2032

Figure 109: Europe Market Volume (Units) Analysis by End User, 2017-2032

Figure 110: Europe Market Value Share (%) and BPS Analysis by End User, 2022-2032

Figure 111: Europe Market Y-o-Y Growth (%) Projections by End User, 2022-2032

Figure 112: Europe Market Value (US$ Mn) Analysis by Sales Channels , 2017-2032

Figure 113: Europe Market Volume (Units) Analysis by Sales Channels , 2017-2032

Figure 114: Europe Market Value Share (%) and BPS Analysis by Sales Channels , 2022-2032

Figure 115: Europe Market Y-o-Y Growth (%) Projections by Sales Channels , 2022-2032

Figure 116: Europe Market Attractiveness by Product Type, 2022-2032

Figure 117: Europe Market Attractiveness by Application, 2022-2032

Figure 118: Europe Market Attractiveness by End User, 2022-2032

Figure 119: Europe Market Attractiveness by Sales Channels , 2022-2032

Figure 120: Europe Market Attractiveness by Country, 2022-2032

Figure 121: Asia Pacific Market Value (US$ Mn) by Product Type, 2022-2032

Figure 122: Asia Pacific Market Value (US$ Mn) by Application, 2022-2032

Figure 123: Asia Pacific Market Value (US$ Mn) by End User, 2022-2032

Figure 124: Asia Pacific Market Value (US$ Mn) by Sales Channels , 2022-2032

Figure 125: Asia Pacific Market Value (US$ Mn) by Country, 2022-2032

Figure 126: Asia Pacific Market Value (US$ Mn) Analysis by Country, 2017-2032

Figure 127: Asia Pacific Market Volume (Units) Analysis by Country, 2017-2032

Figure 128: Asia Pacific Market Value Share (%) and BPS Analysis by Country, 2022-2032

Figure 129: Asia Pacific Market Y-o-Y Growth (%) Projections by Country, 2022-2032

Figure 130: Asia Pacific Market Value (US$ Mn) Analysis by Product Type, 2017-2032

Figure 131: Asia Pacific Market Volume (Units) Analysis by Product Type, 2017-2032

Figure 132: Asia Pacific Market Value Share (%) and BPS Analysis by Product Type, 2022-2032

Figure 133: Asia Pacific Market Y-o-Y Growth (%) Projections by Product Type, 2022-2032

Figure 134: Asia Pacific Market Value (US$ Mn) Analysis by Application, 2017-2032

Figure 135: Asia Pacific Market Volume (Units) Analysis by Application, 2017-2032

Figure 136: Asia Pacific Market Value Share (%) and BPS Analysis by Application, 2022-2032

Figure 137: Asia Pacific Market Y-o-Y Growth (%) Projections by Application, 2022-2032

Figure 138: Asia Pacific Market Value (US$ Mn) Analysis by End User, 2017-2032

Figure 139: Asia Pacific Market Volume (Units) Analysis by End User, 2017-2032

Figure 140: Asia Pacific Market Value Share (%) and BPS Analysis by End User, 2022-2032

Figure 141: Asia Pacific Market Y-o-Y Growth (%) Projections by End User, 2022-2032

Figure 142: Asia Pacific Market Value (US$ Mn) Analysis by Sales Channels , 2017-2032

Figure 143: Asia Pacific Market Volume (Units) Analysis by Sales Channels , 2017-2032

Figure 144: Asia Pacific Market Value Share (%) and BPS Analysis by Sales Channels , 2022-2032

Figure 145: Asia Pacific Market Y-o-Y Growth (%) Projections by Sales Channels , 2022-2032

Figure 146: Asia Pacific Market Attractiveness by Product Type, 2022-2032

Figure 147: Asia Pacific Market Attractiveness by Application, 2022-2032

Figure 148: Asia Pacific Market Attractiveness by End User, 2022-2032

Figure 149: Asia Pacific Market Attractiveness by Sales Channels , 2022-2032

Figure 150: Asia Pacific Market Attractiveness by Country, 2022-2032

Figure 151: MEA Market Value (US$ Mn) by Product Type, 2022-2032

Figure 152: MEA Market Value (US$ Mn) by Application, 2022-2032

Figure 153: MEA Market Value (US$ Mn) by End User, 2022-2032

Figure 154: MEA Market Value (US$ Mn) by Sales Channels , 2022-2032

Figure 155: MEA Market Value (US$ Mn) by Country, 2022-2032

Figure 156: MEA Market Value (US$ Mn) Analysis by Country, 2017-2032

Figure 157: MEA Market Volume (Units) Analysis by Country, 2017-2032

Figure 158: MEA Market Value Share (%) and BPS Analysis by Country, 2022-2032

Figure 159: MEA Market Y-o-Y Growth (%) Projections by Country, 2022-2032

Figure 160: MEA Market Value (US$ Mn) Analysis by Product Type, 2017-2032

Figure 161: MEA Market Volume (Units) Analysis by Product Type, 2017-2032

Figure 162: MEA Market Value Share (%) and BPS Analysis by Product Type, 2022-2032

Figure 163: MEA Market Y-o-Y Growth (%) Projections by Product Type, 2022-2032

Figure 164: MEA Market Value (US$ Mn) Analysis by Application, 2017-2032

Figure 165: MEA Market Volume (Units) Analysis by Application, 2017-2032

Figure 166: MEA Market Value Share (%) and BPS Analysis by Application, 2022-2032

Figure 167: MEA Market Y-o-Y Growth (%) Projections by Application, 2022-2032

Figure 168: MEA Market Value (US$ Mn) Analysis by End User, 2017-2032

Figure 169: MEA Market Volume (Units) Analysis by End User, 2017-2032

Figure 170: MEA Market Value Share (%) and BPS Analysis by End User, 2022-2032

Figure 171: MEA Market Y-o-Y Growth (%) Projections by End User, 2022-2032

Figure 172: MEA Market Value (US$ Mn) Analysis by Sales Channels , 2017-2032

Figure 173: MEA Market Volume (Units) Analysis by Sales Channels , 2017-2032

Figure 174: MEA Market Value Share (%) and BPS Analysis by Sales Channels , 2022-2032

Figure 175: MEA Market Y-o-Y Growth (%) Projections by Sales Channels , 2022-2032

Figure 176: MEA Market Attractiveness by Product Type, 2022-2032

Figure 177: MEA Market Attractiveness by Application, 2022-2032

Figure 178: MEA Market Attractiveness by End User, 2022-2032

Figure 179: MEA Market Attractiveness by Sales Channels , 2022-2032

Figure 180: MEA Market Attractiveness by Country, 2022-2032

Recommendations

Consumer Product

Wall Decor Market

Published : July 2022

Consumer Product

Aluminum Curtain Wall Market

Published : June 2022

Explore Consumer Product Insights

View Reports
Google translate

Wall Covering Products Market