
- Market Size (2026)
- USD 525.1 Mn
- Forecast (2036)
- USD 792.4 Mn
- CAGR (2026 to 2036)
- 4.2%
How big is Zeaxanthin Market in 2026?
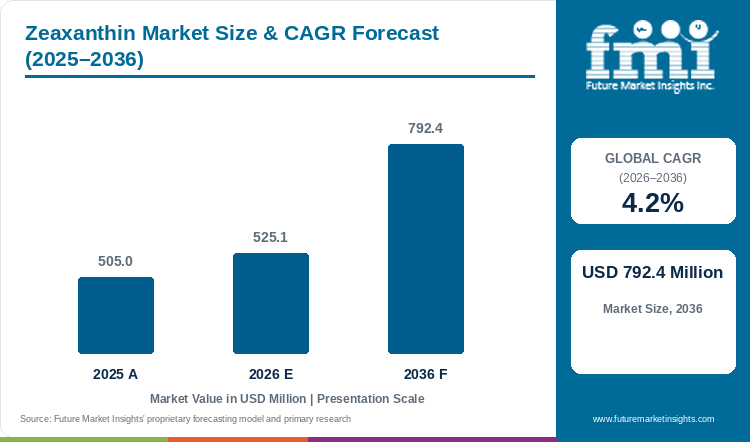
Starting from USD 505.0 million in 2025, the zeaxanthin market valuation advanced to USD 525.1 million in 2026, with projections pointing toward USD 792.4 million by 2036 at a CAGR of 4.2%.
Preventative eye-care habits among digital screen users and antibiotic-free poultry yolk color programs drive steady commercial demand across the zeaxanthin market. Consumer vitamin brands no longer position macular carotenoids solely for seniors with age-related macular degeneration, as younger gamers and office workers routinely buy blue-light gummies and daily eye capsules. Cold Water Dispersible CWD Beadlets 5% to 10% capture 45.4% of 2026 physical delivery demand because dry-blended multivitamin tablets and stick-packs require free-flowing granules that pair cleanly with marigold lutein esters. Per a February 2025 clinical study in Cureus, healthy adults with prolonged daily screen exposure who took a 5 to 1 marigold lutein-zeaxanthin complex for eight months raised right-eye macular pigment optical density from 0.3 to 0.7. Full-year 2025 financial results from dsm-firmenich in February 2026 confirmed sustained customer uptake across its Health, Nutrition and Care ocular bioactives and animal premix lines. As documented in FMI research, high solvent recovery costs in marigold extraction and rapid heat isomerization into cis-zeaxanthin during unshielded feed pelleting still restrain low-margin food applications.
Key Market Trends & Insights
- By source origin: Natural Marigold Flower Tagetes erecta Extraction holds an estimated 33.3% share in 2026 since specialized high-zeaxanthin marigold hybrids provide clean-label botanical certification for dietary supplements.
- By physical delivery format: Cold Water Dispersible CWD Beadlets 5% to 10% represent 45.4% in 2026 because protective hydrocolloid shells enable clear dispersion in functional beverages and dry compression tablets.
- By commercial application: Dietary Supplements Macular Carotenoid Eye Health AREDS2 account for 40.8% in 2026 since over-the-counter vision formulas standardize on the clinically validated 10 mg lutein to 2 mg zeaxanthin ratio.
- By isomer specification: All-Trans 3R-3'R Zeaxanthin Free Diol secures 58.2% in 2026 owing to direct intestinal micellar absorption without requiring pancreatic esterase cleavage prior to retinal deposition.
- By distribution channel: Direct to Nutraceutical and Feed Formulators commands 53.5% in 2026 through multi-year supply agreements requiring batch-certified HPLC isomer purity and accelerated stability dossiers.
Regional Highlights
- Top national expansion: China leads national growth projections at a 4.6% CAGR through 2036 under large-scale marigold oleoresin extraction upgrades and domestic pediatric myopia supplement adoption.
- Broader country progression: The United Kingdom tracks at a 4.5% CAGR ahead of Brazil at 4.4% and the Netherlands at 4.3%, where automated layer-hen feed mills and pharmacy eye-care brands expand uptake.
Market Size & Forecast
Table 1: Market Size and Forecast for the Zeaxanthin Market (USD million and CAGR percentage), 2025 to 2036
| Metric | Value |
|---|---|
| 2025 Market Size | USD 505.0 million |
| Estimated Market Size in 2026 | USD 525.1 million |
| Projected Market Size by 2036 | USD 792.4 million |
| CAGR, 2026 to 2036 | 4.2% |
| Added Value, 2026 to 2036 | USD 267.3 million |
Supplement brands and beverage formulators lose significant active potency when unshielded xanthophyll crystals encounter dissolved oxygen or pasteurization heat. Whenever contract packers blend raw marigold oleoresin directly into water-based health drinks, hydrophobic pigment droplets float to the bottle neck and fail retail shelf-life audits. According to a March 2026 randomized trial in Frontiers in Nutrition covering 72 adults over six months, daily supplementation with 10 mg lutein and 2 mg zeaxanthin including 1 mg meso-zeaxanthin significantly reduced visual fatigue scores. Formulation teams therefore specify encapsulated beadlets with xanthophyll carotenoid ingredients so finished gummies and drinks retain full label potency over 24 months.
Active Carotenoid Tonnage and Dosage Sizing
Table 2: Active Carotenoid Tonnage and Dosage Sizing for the Zeaxanthin Market (USD million and operational ranges), 2025 to 2036
| Metric | 2025 | 2026 | 2036 |
|---|---|---|---|
| Market size (USD million) | 505.0 | 525.1 | 792.4 |
| Formulated 5% to 20% beadlet & suspension volume (metric tons) | 2,650 to 2,920 | 2,760 to 3,040 | 4,180 to 4,610 |
| Pure active zeaxanthin equivalent (metric tons) | 215.0 to 240.0 | 224.0 to 250.0 | 342.0 to 380.0 |
| Average formulated price per kg of 10% CWD beadlet (USD) | 172.0 to 190.0 | 173.0 to 191.0 | 172.0 to 189.0 |
Operational note: Formulated dosage ranges apply standard 2 mg per daily human ocular supplement capsule or 5 to 30 mg per kilogram of finished poultry and salmonid feed against commercial beadlet and oil suspension inclusion rates.
Softgel encapsulators and high-speed tablet coaters need distinct particle engineering so zeaxanthin disperses evenly without separating inside feed hoppers. While corn or safflower oil suspensions at 14% to 20% active load pump smoothly into gelatin ribbon dies, dry tablet presses require compressible CWD beadlets that resist 20-kilonewton compaction forces. Per a January 2026 investigation in Gels on macular degeneration delivery matrices, micellar solubilization and food-grade microgel carriers increased oral xanthophyll bioavailability by more than 200% compared with standard oil dispersions. Brands launching ocular wellness bioactives willingly pay a kilogram premium for self-emulsifying and microgel grades that cut required active overages.
Per Capita & Nutraceutical Line Sizing
Table 3: Per Capita and Nutraceutical Line Allocation Indicators for the Zeaxanthin Market (USD), 2025 to 2036
| Metric | 2025 | 2026 | 2036 |
|---|---|---|---|
| World population (million) | 8,200 | 8,300 | 9,000 |
| Market value per 1,000 people (USD) | 61.6 | 63.3 | 88.0 |
| Annual procurement per ocular supplement line (USD thousand) | 118.0 to 135.0 | 122.0 to 140.0 | 178.0 to 204.0 |
| Botanical marigold & microalgal share (%) | 64.0% to 68.0% | 65.0% to 69.0% | 74.0% to 78.0% |
Table 4: Industrial Formulator & Channel Allocation Indicators for the Zeaxanthin Market (USD and percentages), 2026
| Metric | Value | Institutional Reference Basis |
|---|---|---|
| Market size, 2026 | USD 525.1 million | 2026 global valuation baseline |
| Commercial nutraceutical & feed premix lines global | 3,950 lines | Ocular softgel, tablet, beverage & poultry premix lines |
| Annual zeaxanthin allocation per line | USD 132,936.7 | Annualized active & beadlet procurement |
| Direct to Nutraceutical and Feed Formulators value, 2026 | USD 280.9 million | 53.5% distribution channel allocation |
Procurement directors weighing synthetic nature-identical zeaxanthin against botanical marigold or algal extracts must balance per-kilogram active cost against clean-label retail rules. Standard Tagetes erecta flowers yield mostly lutein esters with under 5% zeaxanthin, forcing extractors to contract specialized scarlet marigold hybrids or run closed-vessel microalgae fermenters. Ingredient suppliers bundling algal astaxanthin oleoresins with standardized zeaxanthin beadlets win higher annual volume commitments from supplement and aquafeed buyers that prohibit petrochemical synthesis intermediates.
Analyst Perspective
"Nutraceutical brands and poultry integrators do not purchase zeaxanthin on bulk crystal price alone. They buy guaranteed all-trans isomer stability and zero tablet-press extrusion loss across humid supply chains, where hexane-free marigold extraction and CWD beadlets lock in multi-year AREDS2 contracts."
- Nandini Roy Choudhury, Principal Consultant, Future Market Insights.
How is the zeaxanthin market segmented?
The zeaxanthin market is segmented by source origin and physical delivery format with commercial application, isomer specification, and distribution channel. In 2026, Natural Marigold Flower Tagetes erecta Extraction is projected at 33.3% and Cold Water Dispersible CWD Beadlets 5% to 10% at 45.4%, while Dietary Supplements Macular Carotenoid Eye Health AREDS2 stands at 40.8%, All-Trans 3R-3'R Zeaxanthin Free Diol at 58.2%, and Direct to Nutraceutical and Feed Formulators at 53.5%.
By source origin: Natural Marigold Flower Tagetes erecta Extraction and Dunaliella and Chlorella Microalgae Biomass, plus Synthetic Chemical Nature-Identical and Paprika Capsicum annuum Red Oleoresin.
By physical delivery format: Cold Water Dispersible CWD Beadlets 5% to 10% and Oil Suspension 14% to 20% in Vegetable Oil, plus Fine Micronized Crystalline Powder and Emulsion and Water-Dispersible Liquid Concentrates.
By commercial application: Dietary Supplements Macular Carotenoid Eye Health AREDS2 and Functional Fortified Food and Health Drinks, plus Cosmetic Blue-Light Skin Protection Creams and Poultry and Aquafeed Natural Pigmentation.
By isomer specification: All-Trans 3R-3'R Zeaxanthin Free Diol and Meso-Zeaxanthin 3R-3'S Combination Blends, plus Zeaxanthin Dipalmitate Ester Concentrates and Standardized Lutein-Zeaxanthin 5 to 1 Premixes.
By distribution channel: Direct to Nutraceutical and Feed Formulators and Specialty Ingredient Distributors, plus Contract Softgel and Premix Co-Packers and Online B2B Ingredient Portals.
Why does Natural Marigold Flower Tagetes erecta Extraction lead the source origin category?
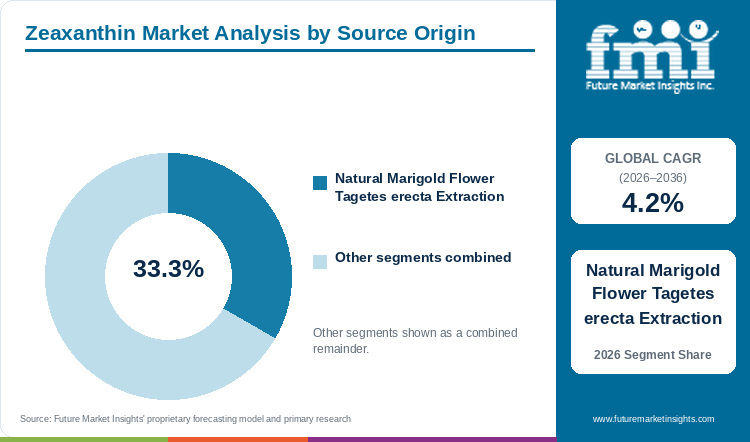
Natural Marigold Flower Tagetes erecta Extraction holds an estimated 33.3% of source origin demand in 2026, anchored by clean-label botanical compliance in ocular supplements.
Table 5: Source Origin Share for the Zeaxanthin Market (percentage share), 2026
| Source Origin | Share (2026) |
|---|---|
| Natural Marigold Flower Tagetes erecta Extraction | 33.3% |
| Other Segments Combined | 66.7%* |
| Total | 100.0% |
*Note that remaining source origin categories account for the balance of 2026 global zeaxanthin demand.
Table 6: Source Origin Leadership and Market Growth for the Zeaxanthin Market (segment and CAGR percentage), 2026 to 2036
| Metric | Value |
|---|---|
| Global CAGR (2026 to 2036) | 4.2% |
| Leading Segment | Natural Marigold Flower Tagetes erecta Extraction |
Natural Marigold Flower Tagetes erecta Extraction anchors botanical supply because alkaline saponification of scarlet marigold oleoresin yields chirally pure 3R-3'R-zeaxanthin diol crystals approved for clean-label dietary supplements. Unlike synthetic chemical synthesis that requires multi-step Wittig condensation, marigold extraction satisfies natural ingredient declarations across North America and Europe for macular vision supplements.
- Natural Marigold Flower Tagetes erecta Extraction holds 33.3% of source origin value in 2026 since consumer supplement brands mandate botanical label claims on ocular health packaging.
- In February 2025, retinal cell researchers reporting in Nutrients demonstrated that Tagetes erecta marigold extract containing lutein and zeaxanthin plus meso-zeaxanthin protected ARPE-19 retinal cells against blue-light oxidative apoptosis via NRF2 and HO-1 pathway activation.
What sustains Cold Water Dispersible CWD Beadlets 5% to 10% leadership in the physical delivery format segment?
Cold Water Dispersible CWD Beadlets 5% to 10% represent 45.4% of the physical delivery format category in 2026, supported by tablet compression stability and cold-drink dispersion.
Spray-dried Cold Water Dispersible CWD Beadlets 5% to 10% encapsulate sub-micron zeaxanthin crystals inside modified food starch and plant proteins with ascorbyl palmitate antioxidants. This protective matrix prevents crystal oxidation during dry blending and allows instant dispersion in cold functional beverages with microalgae aquafeed rations.
- Cold Water Dispersible CWD Beadlets 5% to 10% represent 45.4% of the physical delivery format segment in 2026 as tablet and stick-pack manufacturers require compressible free-flowing granulates.
- In February 2026, ADM reported fourth-quarter and full-year 2025 financial results with 2026 guidance noting steady customer demand for encapsulated botanical bioactives and beverage emulsion systems.
How do Dietary Supplements Macular Carotenoid Eye Health AREDS2 lead the commercial application category?
Dietary Supplements Macular Carotenoid Eye Health AREDS2 account for 40.8% of commercial application volume in 2026, driven by daily 10 mg lutein and 2 mg zeaxanthin ocular dosing.
Ophthalmic nutraceuticals built around the National Eye Institute AREDS2 clinical formulation specify 2 mg of trans-zeaxanthin paired with 10 mg of lutein to slow age-related macular degeneration progression. Prolonged screen exposure among younger office workers has also extended zeaxanthin demand beyond geriatric capsules into adult blue-light gummies and microalgal livestock feed additives.
- Dietary Supplements Macular Carotenoid Eye Health AREDS2 account for 40.8% of commercial application demand in 2026 because daily preventative eye-care regimens generate recurring subscription refills.
- In February 2026, a clinical meta-analysis published in Nutrients confirmed that combined lutein and zeaxanthin plus meso-zeaxanthin supplementation significantly raises macular pigment optical density and supports visual acuity in age-related macular degeneration patients.
Why does All-Trans 3R-3'R Zeaxanthin Free Diol lead the isomer specification category?
All-Trans 3R-3'R Zeaxanthin Free Diol secures 58.2% of isomer specification value in 2026, supported by direct micellar absorption and USP monograph standardization.
Unesterified All-Trans 3R-3'R Zeaxanthin Free Diol matches the exact stereochemical configuration deposited in the human macula lutea and avian egg yolk. Whereas dipalmitate esters require enzymatic hydrolysis by carboxyl ester lipase in the small intestine, free diol crystals absorb directly into mixed bile-salt micelles and meet USP monograph assay standards.
- All-Trans 3R-3'R Zeaxanthin Free Diol secures 58.2% of isomer specification demand in 2026 as regulatory pharmacopeias in Europe and the United States benchmark potency on free active diol weight.
- In June 2025, poultry nutrition scientists reporting in Foods profiled 26 yolk carotenoids across 100 to 400 mg per kilogram dietary inclusions and showed that balanced free-diol zeaxanthin dosing prevents competitive yolk deposition loss.
What gives Direct to Nutraceutical and Feed Formulators the leading position in distribution channel?
Direct to Nutraceutical and Feed Formulators commands 53.5% of distribution channel share in 2026, anchored by chiral HPLC verification and stability qualification.
Large ocular supplement brands and integrated poultry feed mills procure zeaxanthin directly from primary extraction and fermentation manufacturers to audit residual hexane levels and 24-month stability curves. Direct technical coordination also allows premix engineers to customize beadlet particle size for automated micro-dosing hoppers.
- Direct to Nutraceutical and Feed Formulators commands 53.5% of distribution channel value in 2026 because multi-plant supplement and feed accounts lock in annual volume rebates and custom lutein-zeaxanthin ratios.
- In October 2025, Cargill documented in its 2025 Global Impact Report that it invested USD 69 million across operational efficiency upgrades and micronutrient premix manufacturing lines serving global livestock accounts.
What are the drivers and restraints plus opportunities in the zeaxanthin market?
In the zeaxanthin market, rising AREDS2 macular supplement adoption and digital blue-light protection are projected to drive growth whereas thermal cis-isomerization during processing restrains unshielded dosing and microalgal fermentation unlocks season-independent clean-label supply.
- Driver: Older demographics and prolonged digital screen exposure accelerate preventative adoption of AREDS2 macular supplements and blue-light functional beverages.
- Restraint: High susceptibility of unesterified trans-zeaxanthin to thermal cis-isomerization and oxidative bleaching during feed extrusion and ambient storage inflates overage costs.
- Opportunity: High-cell-density heterotrophic fermentation of Chlorella zofingiensis and Dunaliella microalgae unlocks season-independent clean-label zeaxanthin supply.
Growth Analysis and Future Potential: Qualitative Demand Drivers
Widespread digital eye strain among school-age youths and working adults is expanding zeaxanthin demand well beyond geriatric ophthalmology clinics into everyday consumer health products. Because beta-carotene cannot cross the blood-retina barrier into the central fovea, formulators rely on dietary zeaxanthin to build macular pigment that filters 400 to 500 nanometer blue light. At the same time, supermarket egg buyers and farmed-salmon processors specify natural xanthophyll premixes paired with aquaculture pigmentation additives to meet clean-label color standards. Per a December 2025 clinical meta-analysis in Nutrients covering 10 trials and 1,035 adolescents, lutein and zeaxanthin supplementation slowed axial eye elongation with a standardized mean difference of minus 0.40 and elevated macular pigment density by 0.50.
Risk Assessment of the Zeaxanthin Market: Operational and Formulation Friction
Thermal cis-isomerization and oxidative bleaching across conjugated double bonds remain the main practical hurdles limiting zeaxanthin adoption in baked snacks and pelleted feeds. When unshielded crystalline powder hits extruder barrel temperatures above 110 degrees Celsius, all-trans zeaxanthin rapidly isomerizes into lower-potency 9-cis and 13-cis forms while losing orange color strength. According to a January 2026 study in Molecules on nano-formulated carotenoids, biopolymer nano-encapsulation achieves roughly 90% encapsulation efficiency and shields xanthophyll polyenes against thermal radical degradation. Processors blending botanical food colorants must either add 15% to 25% active overage or buy cross-linked microcapsules that raise unit formulation costs.
Commercial Opportunity Analysis: Formulation Differentiation and Value-Add Formats
Biotech ingredient producers unlock attractive margin expansion by scaling closed-tank microalgal fermentation and clear micellar liquid concentrates that eliminate agricultural crop volatility. Heterotrophic or photobioreactor cultivation of engineered green microalgae removes monsoon harvest risk in India and China while supplying pesticide-free active biomass for vegan gummies and natural pigment dispersions. In July 2025, metabolic engineers reporting in Bioresource Technology achieved 6.70 mg per liter per day of zeaxanthin productivity using an engineered Chlamydomonas reinhardtii dLZ_C strain in controlled culture. Functional drink brands readily pay a price premium for cold-water-soluble microalgal emulsions that stay crystal-clear in PET bottles at low milligram doses.
Zeaxanthin Market by Country (2026 to 2036)
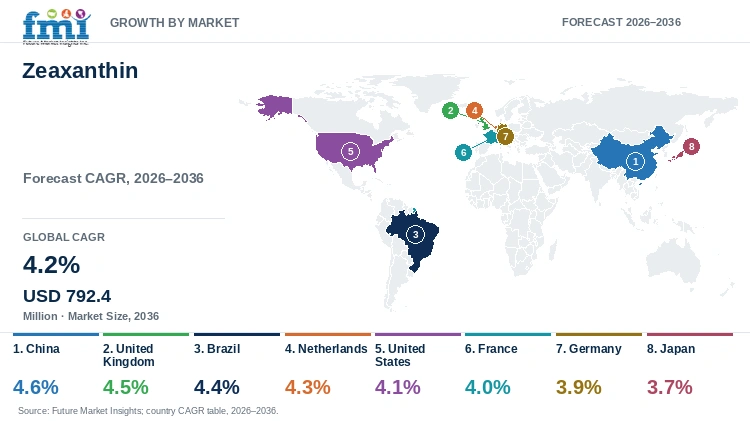
FMI country modeling indicates that China leads zeaxanthin expansion at a 4.6% CAGR through 2036, while Japan advances at a mature 3.7% pace.
Table 7: Country CAGR and Primary Growth Levers for the Zeaxanthin Market (CAGR percentage and operational drivers), 2026 to 2036
| Country | CAGR (2026 to 2036) | Primary Growth Lever |
|---|---|---|
| China | 4.6% | High-zeaxanthin Tagetes erecta breeding and pediatric myopia supplement demand |
| United Kingdom | 4.5% | Pharmacy macular softgel subscriptions and free-range egg yolk pigmentation |
| Brazil | 4.4% | Export poultry skin-and-yolk pigmentation premixes and ANVISA ocular capsules |
| Netherlands | 4.3% | European Union micronutrient premix hub and EFSA-compliant feed blending |
| United States | 4.1% | Clinician-backed AREDS2 eye formulas and blue-light gummy co-packing |
| France | 4.0% | Parapharmacy clean-label nutricosmetics and Label Rouge poultry rations |
| Germany | 3.9% | Drugstore private-label vision depot tablets and beadlet microencapsulation |
| Japan | 3.7% | Foods with Function Claims macular registrations and clear ocular beverages |
Source: Future Market Insights analysis
China Zeaxanthin Market Outlook (2026 to 2036)
China anchors global marigold cultivation and domestic ocular supplement expansion, with national zeaxanthin valuation projected to grow at a leading 4.6% CAGR from 2026 to 2036. Unlike Western countries that import finished oleoresin, extraction complexes in Xinjiang and Yunnan process domestic Tagetes erecta harvests directly into saponified xanthophyll crystals and CWD beadlets. According to the April 2026 USDA GAIN assessment CH2026-0042 for China, domestic food and functional nutrition processors continue to expand botanical ingredient sourcing for health-positioned foods. National Ministry of Education initiatives addressing school-age myopia also propel parent purchases of pediatric lutein-zeaxanthin gummies and fortified dairy drinks across tier-one urban pharmacies across commercial supply chains.
Key takeaway: In China, domestic high-zeaxanthin marigold breeding and pediatric vision supplement adoption are projected to drive leading 4.6% CAGR expansion through 2036.
United Kingdom Zeaxanthin Market Outlook (2026 to 2036)
Whereas China scales upstream agricultural extraction, the United Kingdom concentrates demand inside pharmacy-chain vision supplements and free-range poultry feed premixes at a 4.5% CAGR through 2036. High-street chemist chains and subscription vitamin brands market high-strength 10 mg lutein and 2 mg zeaxanthin softgels to older consumers seeking non-prescription macular support outside National Health Service formularies. According to the March 2026 USDA annual ingredient study on the United Kingdom, national food and drink manufacturing output topped GBP 115 billion as processors prioritized clean-label functional ingredients. Domestic egg packers also specify saponified marigold and paprika zeaxanthin blends in layer rations to achieve golden yolk fan scores.
Key takeaway: In the United Kingdom, pharmacy macular supplement subscriptions and free-range egg yolk pigmentation programs are expected to sustain a 4.5% CAGR through 2036.
Brazil Zeaxanthin Market Outlook (2026 to 2036)
In contrast to European pharmacy-led markets, Brazil combines fast-growing ANVISA-regulated ocular nutraceuticals with commercial poultry and aquafeed pigmentation demand to reach a 4.4% CAGR between 2026 and 2036. Integrated broiler and layer complexes across Parana and Sao Paulo dose stabilized zeaxanthin and capsanthin premixes to standardize skin and yolk coloration when corn carotene levels fluctuate. According to the March 2026 USDA agricultural attaché study BR2026-0011 for Brazil, domestic processed food sales hit BRL 1.16 trillion while expanding export-grade poultry and functional nutrition lines. Domestic compounding pharmacies and multinational supplement brands simultaneously expand CWD beadlet imports for over-the-counter presbyopia and blue-light capsules across metropolitan retail chains.
Key takeaway: In Brazil, commercial poultry pigmentation premixes and ANVISA-compliant ophthalmic supplement launches are forecast to drive a 4.4% CAGR through 2036.
Netherlands Zeaxanthin Market Outlook (2026 to 2036)
Unlike purely domestic consumer markets, the Netherlands operates as Europe's central premix blending and clinical nutrition logistics hub, advancing at a 4.3% CAGR through 2036. Specialty feed and human nutrition blenders in Rotterdam and Limburg import bulk marigold oleoresin and synthetic nature-identical zeaxanthin to formulate standardized CWD beadlets for re-export across the European Union. According to the April 2026 USDA ingredient annual for the Netherlands, national agri-food processing and ingredient trade remains a primary pillar of European Union functional food supply. Strict European Union novel-food and EFSA feed-additive compliance protocols give technical premix houses in the Netherlands a durable qualification advantage over uncertified importers.
Key takeaway: In the Netherlands, export-oriented micronutrient premix manufacturing and EFSA-compliant feed blending are anticipated to support a 4.3% CAGR through 2036.
United States Zeaxanthin Market Outlook (2026 to 2036)
Demand in the United States is anchored by the National Eye Institute AREDS2 clinical standard, supporting a 4.1% CAGR across the 2026 to 2036 forecast window. Ophthalmologists and optometrists across the United States routinely recommend daily 10 mg lutein and 2 mg zeaxanthin softgels or gummies to patients with intermediate age-related macular degeneration and heavy digital screen exposure. In May 2025 dsm-firmenich launched its new Princeton R&D center in New Jersey to speed up joint formulation of bioavailable nutrition and food ingredients for domestic brands. Contract softgel and gummy co-packers in California and New Jersey actively specify micellar and CWD beadlet grades to verify 24-month label claims.
Key takeaway: In the United States, clinician-recommended AREDS2 eye supplements and blue-light gummy co-packing are estimated to sustain a 4.1% CAGR through 2036.
France Zeaxanthin Market Outlook (2026 to 2036)
France diverges from Anglo-Saxon mass-retail vitamin channels because parapharmacy dispensing and Label Rouge poultry standards govern ingredient qualification, yielding a 4.0% CAGR from 2026 to 2036. Consumers in France purchase ocular nutricosmetics and macular protection capsules primarily through licensed pharmacies that demand clean-label marigold extraction free from synthetic carriers and titanium dioxide. According to the April 2026 USDA annual food processing study on France, domestic nutrition and food manufacturers generated EUR 238 billion in output while prioritizing traceable botanical extracts. Free-range poultry cooperatives across Brittany and Pays de la Loire also incorporate natural Tagetes erecta and paprika zeaxanthin into corn-wheat rations for deep yellow egg yolks across farm flocks.
Key takeaway: In France, pharmacy-dispensed clean-label ocular supplements and Label Rouge poultry feed standards are slated to maintain a 4.0% CAGR through 2036.
Germany Zeaxanthin Market Outlook (2026 to 2036)
Whereas France favors pharmacy-exclusive nutricosmetics, Germany combines high-volume drugstore ocular supplements with precision premix engineering to progress at a 3.9% CAGR from 2026 to 2036. High-volume drugstore chains and reform-house retailers in Germany stock private-label lutein-zeaxanthin depot tablets and vegan softgels formulated with Cold Water Dispersible CWD beadlets. According to the September 2026 USDA Retail Foods Annual briefing on Germany, Europe's largest food and beverage retail market continues to expand fortified health and wellness product lines across mass-market channels. Industrial chemical and nutrition groups headquartered in Germany also supply nature-identical and microencapsulated carotenoid dispersions to multinational beverage and animal-nutrition accounts across central Europe across commercial supply chains.
Key takeaway: In Germany, drugstore private-label vision tablets and industrial microencapsulation technology are likely to support a 3.9% CAGR through 2036.
Japan Zeaxanthin Market Outlook (2026 to 2036)
Japan represents the world's most sophisticated regulatory environment for ocular functional claims under the Consumer Affairs Agency Foods with Function Claims framework, expanding at a 3.7% CAGR through 2036. Beverage and supplement manufacturers in Japan register hundreds of lutein and zeaxanthin products claiming documented improvements in macular pigment optical density and contrast sensitivity for older citizens. According to the April 2026 USDA Tokyo ATO report JA2026-0012 for Japan, national processed food production stood at a strong valuation in 2025 as manufacturers prioritized health-claim products for older consumers. Convenience-store functional jelly drinks and clear ocular teas in Japan rely on nano-emulsified zeaxanthin concentrates that maintain zero sediment clarity.
Key takeaway: In Japan, Foods with Function Claims ocular registrations and clear functional beverage emulsions are predicted to sustain a 3.7% CAGR through 2036.
Full report country CAGRs cover: North America; Latin America; Western Europe; Eastern Europe; East Asia; South Asia and Pacific; Middle East and Africa.
Who are the notable companies in the zeaxanthin market?
dsm-firmenich AG and BASF SE with Kemin Industries Inc., OmniActive Health Technologies, Archer Daniels Midland Company, Cargill Incorporated, International Flavors and Fragrances Inc., Kerry Group plc, Ingredion Incorporated, and Tate and Lyle plc are the notable companies in the zeaxanthin market.
Competitive positioning in the zeaxanthin industry separates primary carotenoid synthesis and botanical extraction leaders from global microencapsulation and premix formulators. dsm-firmenich and BASF SE with Kemin Industries and OmniActive Health Technologies anchor primary all-trans and meso-zeaxanthin active production. Cargill and ADM with Tate and Lyle and Ingredion plus Kerry Group and IFF engineer protective hydrocolloid matrices and fortified food or feed premixes.
- Primary Carotenoid Synthesis and Marigold Extraction Leaders: dsm-firmenich AG and BASF SE with Kemin Industries Inc. and OmniActive Health Technologies produce branded crystalline and beadlet plus oil-suspension zeaxanthin actives.
- Global Premix and Emulsion plus Functional Delivery Formulators: Archer Daniels Midland Company and Cargill Incorporated with International Flavors and Fragrances Inc. and Kerry Group plc blend microencapsulated carotenoids into customized beverage emulsions and animal nutrition rations.
- Hydrocolloid Encapsulation and Matrix Stabilizer Specialists: Ingredion Incorporated and Tate and Lyle plc supply modified food starches and clean-label plant hydrocolloids plus protective wall materials that shield zeaxanthin from oxidation during spray-drying and tableting.
Competitive Benchmarking: Zeaxanthin Market
Table 8: Competitive Benchmarking for the Zeaxanthin Market (qualitative capability ratings), 2026
| Company | Documented Carotenoid Activity | Microencapsulation Support | Clean-Label Botanical Fit | Geographic Reach |
|---|---|---|---|---|
| dsm-firmenich AG | High | High | High | Global Optisharp and FloraGLO ocular premix network; Princeton center May 2025 |
| BASF SE | High | High | Medium | Global human nutrition and animal feed carotenoid beadlet manufacturing |
| Kemin Industries Inc. | High | High | High | Vertically integrated ZeaONE marigold breeding and Kem GLO poultry pigment |
| OmniActive Health Technologies | High | High | High | Global Lutemax 2020 and OmniXan macular carotenoid clinical dossiers |
| Archer Daniels Midland Company | Medium | High | High | Global botanical extraction, beverage emulsion, and animal premix network |
| Cargill Incorporated | Medium | High | High | Global micronutrient premix and animal nutrition network; Indonesia mill Sept 2025 |
| International Flavors and Fragrances Inc. | Medium | High | High | Global Pharma Solutions softgel polymers and Health & Biosciences delivery |
| Kerry Group plc | Medium | High | High | Global proactive health delivery; expanded Leipzig biotech hub Oct 2025 |
| Ingredion Incorporated | Unscored | High | High | Global Purity Gum and Hi-Cap modified starch encapsulation matrices |
| Tate and Lyle plc | Unscored | High | High | Global CP Kelco pectin and hydrocolloid emulsion stabilizers; May 2026 results |
Primary scoring basis: Documented Carotenoid Activity evaluates published clinical or pharmacopeial evidence of standardized zeaxanthin active grades such as Optisharp or ZeaONE and Lutemax 2020, whereas Microencapsulation Support rates spray-dried beadlet and emulsion engineering infrastructure. Clean-Label Botanical Fit scores hexane-free marigold or microalgal positioning, and Geographic Reach reflects multi-region premix and regulatory dossier coverage.
Key Developments in the Zeaxanthin Market
- In its November 2025 interim statement covering the six months through September 2025, Tate and Lyle noted that integrating CP Kelco hydrocolloids strengthened cross-selling across beverage emulsion and microcapsule wall systems.
- Preliminary full-year 2025 financial statements from Kerry Group in February 2026 showed EUR 6.76 billion in group revenue and 3.5% Food volume growth supported by proactive health and fermentation technologies.
- Second-quarter 2026 disclosures from IFF in August 2026 showed USD 601 million in Health and Biosciences sales and 5% comparable growth across functional nutrition and biopolymer delivery excipients.
Key Players in the Zeaxanthin Market
Primary Carotenoid Synthesis and Marigold Extraction Leaders
- dsm-firmenich AG
- BASF SE
- Kemin Industries Inc.
- OmniActive Health Technologies
Global Premix and Emulsion plus Functional Delivery Formulators
- Archer Daniels Midland Company
- Cargill Incorporated
- International Flavors and Fragrances Inc.
- Kerry Group plc
Hydrocolloid Encapsulation and Matrix Stabilizer Specialists
- Ingredion Incorporated
- Tate and Lyle plc
Zeaxanthin Market - Report Scope
Table 9: Report Scope for the Zeaxanthin Market (coverage fields and definitions), 2026 to 2036
| Coverage field | Report scope |
|---|---|
| Market breakdown | Source Origin; Physical Delivery Format; Commercial Application; Isomer Specification; Distribution Channel |
| Quantitative Units | USD Million |
| Market Definition | Includes commercial supplier valuation from bulk and formulated zeaxanthin actives (all-trans 3R-3'R-zeaxanthin, meso-zeaxanthin, and zeaxanthin dipalmitate esters derived from marigold, microalgae, paprika, or chemical synthesis) in CWD beadlets, oil suspensions, powders, and emulsions. Category Scope Note: Excludes standalone lutein without quantified zeaxanthin content, beta-carotene, astaxanthin, and finished retail consumer supplement bottle markups. |
| Regions Covered | North America; Latin America; Western Europe; Eastern Europe; East Asia; South Asia and Pacific; Middle East and Africa |
| Countries Covered | China, United Kingdom, Brazil, Netherlands, United States, France, Germany, Japan, and additional countries in the full report |
| Key Companies Covered | Archer Daniels Midland Company, Cargill Incorporated, International Flavors and Fragrances Inc., Kerry Group plc, Ingredion Incorporated, Tate and Lyle plc, dsm-firmenich AG, BASF SE, Kemin Industries Inc., OmniActive Health Technologies |
| Forecast Period | 2026 to 2036 |
| Approach | Primary and secondary research with top-down and bottom-up market triangulation. |
Zeaxanthin Market - Research Methodology
Table 10: Research Methodology for the Zeaxanthin Market (research methods and approach), 2026 edition
| Method | Approach |
|---|---|
| Primary Research | Structured interviews with ophthalmic nutraceutical R&D directors, marigold oleoresin extraction engineers, spray-drying beadlet specialists, and poultry feed formulation nutritionists to validate active inclusion rates and overage tolerances. |
| Secondary Research | Analysis of National Eye Institute AREDS2 clinical literature, EFSA FEEDAP Panel scientific opinions, USP and European Pharmacopoeia zeaxanthin monographs, USDA FAS Food Processing Ingredients Annual reports, and corporate filings. |
| Market Sizing and Forecasting | Top-down global carotenoid and ocular supplement baselines reconciled against bottom-up formulated beadlet and oil-suspension tonnage (2,760 to 3,040 MT in 2026) and active kilogram pricing from 2026 to 2036. |
| Country Forecasting Model | Econometric country projections weight age-related macular degeneration prevalence, digital screen exposure, registered functional eye-health claims, and commercial layer-hen feed production across eight national markets. |
| Operational Benchmark Traceability | Active carotenoid tonnage and line allocation indicators in Tables 2, 3, and 4 trace to clinical 2 mg daily human dosing, EFSA poultry feed ppm limits, and USDA FAS national food processing registries. |
| Data Triangulation and Validation | Valuation estimates isolate active zeaxanthin and microencapsulated delivery value at the B2B ingredient level while strictly excluding unstandardized marigold meal and retail supplement packaging. |
Zeaxanthin Market by Segments
Zeaxanthin Market segmented by Source Origin:
- Natural Marigold Flower Tagetes erecta Extraction
- Dunaliella and Chlorella Microalgae Biomass
- Synthetic Chemical Nature-Identical
- Paprika Capsicum annuum Red Oleoresin
Zeaxanthin Market segmented by Physical Delivery Format:
- Cold Water Dispersible CWD Beadlets 5% to 10%
- Oil Suspension 14% to 20% in Vegetable Oil
- Fine Micronized Crystalline Powder
- Emulsion and Water-Dispersible Liquid Concentrates
Zeaxanthin Market segmented by Commercial Application:
- Dietary Supplements Macular Carotenoid Eye Health AREDS2
- Functional Fortified Food and Health Drinks
- Cosmetic Blue-Light Skin Protection Creams
- Poultry and Aquafeed Natural Pigmentation
- Pharmaceutical Ophthalmic Formulations
Zeaxanthin Market segmented by Isomer Specification:
- All-Trans 3R-3'R Zeaxanthin Free Diol
- Meso-Zeaxanthin 3R-3'S Combination Blends
- Zeaxanthin Dipalmitate Ester Concentrates
- Standardized Lutein-Zeaxanthin 5 to 1 Premixes
Zeaxanthin Market segmented by Distribution Channel:
- Direct to Nutraceutical and Feed Formulators
- Specialty Ingredient Distributors
- Contract Softgel and Premix Co-Packers
- Online B2B Ingredient Portals
Zeaxanthin Market by Region
- North America
- United States
- Canada
- Latin America
- Brazil
- Mexico
- Argentina
- Chile
- Western Europe
- Germany
- France
- United Kingdom
- Italy
- Spain
- Benelux
- Nordics
- Eastern Europe
- Poland
- Czech Republic
- Romania
- Hungary
- East Asia
- China
- Japan
- South Korea
- South Asia and Pacific
- India
- ASEAN
- Australia and New Zealand
- Middle East and Africa
- GCC Countries
- South Africa
- Türkiye
- Israel
Research Sources and Bibliography
- [1] Bharadwaj, V. G. et al. (2025, February 22). Beneficial Effects of a Lutein-Zeaxanthin Complex on Macular Pigment Optical Density Levels of Healthy Individuals With Prolonged Screen Time. Cureus, 17(2), e79458 (PMC11933726).
- [2] dsm-firmenich. (2026, February 12). dsm-firmenich reports full year 2025 results. dsm-firmenich AG Media Releases.
- [3] Li, Y. et al. (2026, March 15). The effects of lutein, zeaxanthin and anthocyanins supplementation on visual fatigue. Frontiers in Nutrition, 13, Article 13412534 (PMC13412534).
- [4] Wang, H. et al. (2026, January 28). Food-Grade Microgels for Age-Related Macular Degeneration. Gels, 12(2), Article 13025106 (PMC13025106).
- [5] Chen, X. et al. (2025, February 14). BlingLife-Marigold Extract Alleviates Blue Light-Induced Retinal Damage. Nutrients, 17(4), Article 11896799 (PMC11896799).
- [6] ADM. (2026, February 3). ADM Reports Fourth Quarter and Full-year 2025 Results and Provides 2026 Guidance. Archer Daniels Midland Company Newsroom.
- [7] Zhang, Q. et al. (2026, February 27). Quantifying the Impact of Lutein and Carotenoid on Age-Related Macular Degeneration. Nutrients, 18(5), Article 13101954 (PMC13101954).
- [8] Liu, M. et al. (2025, June 24). Lutein and Astaxanthin Supplementation Induce Competitive Deposition with Zeaxanthin in Egg Yolk. Foods, 14(13), Article 12248904 (PMC12248904).
- [9] Cargill. (2025, October 15). Cargill 2025 Global Impact Report. Cargill, Incorporated Corporate Responsibility.
- [10] Zhou, W. et al. (2025, December 18). The differential effects of lutein and zeaxanthin supplementation on myopia in adolescents. Nutrients, 17(24), Article 12820619 (PMC12820619).
- [11] Kowalski, R. et al. (2026, January 6). Antioxidant properties of nano-formulated carotenoids and natural pigments. Molecules, 31(1), Article 12982999 (PMC12982999).
- [12] Park, S. et al. (2025, July 18). High-yield zeaxanthin production in Chlamydomonas reinhardtii via metabolic engineering. Bioresource Technology, 416, Article 12273266 (PMC12273266).
- [13] USDA Foreign Agricultural Service. (2026, April 1). China Food Processing Ingredients Annual Report CH2026-0042. U.S. Department of Agriculture.
- [14] USDA Foreign Agricultural Service. (2026, March 24). United Kingdom Food Processing Ingredients Annual Report. U.S. Department of Agriculture.
- [15] USDA Foreign Agricultural Service. (2026, March 31). Brazil Food Processing Ingredients Annual Report BR2026-0011. U.S. Department of Agriculture.
- [16] USDA Foreign Agricultural Service. (2026, April 2). Netherlands Food Processing Ingredients Annual Report. U.S. Department of Agriculture.
- [17] dsm-firmenich. (2025, May 20). On the rise dsm-firmenich opens Princeton Innovation Center in Princeton NJ. dsm-firmenich AG Press Releases.
- [18] USDA Foreign Agricultural Service. (2026, April 3). France Food Processing Ingredients Annual Report. U.S. Department of Agriculture.
- [19] USDA Foreign Agricultural Service. (2026, September 15). Germany Retail Foods Annual Report. U.S. Department of Agriculture.
- [20] USDA Foreign Agricultural Service. (2026, April 10). Japan Food Processing Ingredients Annual Report JA2026-0012. U.S. Department of Agriculture.
- [21] Tate and Lyle. (2025, November 6). Tate and Lyle PLC Results for the Six Months to 30 September 2025. Tate and Lyle PLC Investor Relations.
- [22] Kerry Group. (2026, February 17). Kerry Group Preliminary Statement of Results for the Year Ended 31 December 2025. Kerry Group plc News and Media.
- [23] IFF. (2026, August 4). IFF Reports Second Quarter 2026 Results. International Flavors and Fragrances Inc. Investor Relations.
- [24] Kerry Group. (2026, October 27). Kerry Celebrates One Year of Innovation at Kerry Biotechnology Centre in Leipzig. Kerry Group plc News and Media.
This bibliography is provided for reader reference and is not exhaustive. The full report contains the complete reference list and detailed citations.
This Report Answers
- How large is the zeaxanthin market in 2026 and what is forecast for 2036?
- Which blue-light screen exposure and macular health pressures support demand for zeaxanthin?
- Why does Natural Marigold Flower Tagetes erecta Extraction lead the source origin category?
- Why do Cold Water Dispersible CWD Beadlets 5% to 10% lead the physical delivery format category?
- How do growth rates differ across China and the United Kingdom along with Brazil and the Netherlands?
- Which leading companies supply primary zeaxanthin actives versus microencapsulation and premix systems?
- What limits unshielded crystalline dosing or causes cis-isomerization in the zeaxanthin market?
- What should supplement and feed formulators evaluate before selecting marigold versus synthetic grades?
Table of Content
- Key Takeaways
- Market Size and CAGR
- Top Growth Driver
- Fastest Growing Segment
- Leading Region
- Key Companies
- Emerging Opportunities
- Executive Summary
- Global Market Outlook
- Demand-side Trends
- Supply-side Trends
- Technology Roadmap Analysis
- Analysis and Recommendations
- Analyst Perspective (What is happening? Why now? What should investors know?)
- Key Questions Answered
- How large is the market?
- What is the CAGR?
- What are key trends?
- Which region dominates?
- Who are the leaders?
Read More...
- Market Overview
- Market Coverage / Taxonomy
- Market Definition / Scope / Limitations
- Research Methodology
- Chapter Orientation
- Analytical Lens and Working Hypotheses
- Market Structure, Signals, and Trend Drivers
- Benchmarking and Cross-market Comparability
- Market Sizing, Forecasting, and Opportunity Mapping
- Research Design and Evidence Framework
- Desk Research Programme (Secondary Evidence)
- Expert Input and Fieldwork (Primary Evidence)
- Tooling, Models, and Reference Databases
- Data Engineering and Model Build
- Quality Assurance and Audit Trail
- Market Background
- Market Dynamics (Drivers, Restraints, Opportunity, Trends)
- Scenario Forecast (Optimistic, Likely, Conservative)
- Impact Analysis
- AI Impact
- Sustainability Impact
- Regulatory Impact
- Technology Impact
- Consumer / Buyer Analysis
- Purchase Drivers
- Adoption Barriers
- Buyer Journey
- Opportunity Map Analysis
- Product Life Cycle Analysis
- Supply Chain Analysis
- Investment Feasibility Matrix
- Value Chain Analysis
- PESTLE and Porter's Analysis
- Regulatory Landscape
- Regional Parent Market Outlook
- Production and Consumption Statistics
- Import and Export Statistics
- Global Market Analysis and Forecast, 2021 to 2036
- Historical Market Size Value (USD Million) Analysis, 2021 to 2025
- Current and Future Market Size Value (USD Million) Projections, 2026 to 2036
- Y-o-Y Growth Trend Analysis
- Absolute $ Opportunity Analysis
- Global Market Pricing Analysis, 2021 to 2036
- Global Market Analysis and Forecast, By Source Origin, 2021 to 2036
- Introduction / Key Findings
- Historical Market Size Value (USD Million) Analysis By Source Origin, 2021 to 2025
- Current and Future Market Size Value (USD Million) Analysis and Forecast By Source Origin, 2026 to 2036
- Natural Marigold Flower Tagetes erecta Extraction
- Dunaliella and Chlorella Microalgae Biomass
- Synthetic Chemical Nature-Identical
- Paprika Capsicum annuum Red Oleoresin
- Y-o-Y Growth Trend Analysis By Source Origin, 2021 to 2025
- Absolute $ Opportunity Analysis By Source Origin, 2026 to 2036
- Global Market Analysis and Forecast, By Physical Delivery Format, 2021 to 2036
- Introduction / Key Findings
- Historical Market Size Value (USD Million) Analysis By Physical Delivery Format, 2021 to 2025
- Current and Future Market Size Value (USD Million) Analysis and Forecast By Physical Delivery Format, 2026 to 2036
- Cold Water Dispersible CWD Beadlets 5% to 10%
- Oil Suspension 14% to 20% in Vegetable Oil
- Fine Micronized Crystalline Powder
- Emulsion and Water-Dispersible Liquid Concentrates
- Y-o-Y Growth Trend Analysis By Physical Delivery Format, 2021 to 2025
- Absolute $ Opportunity Analysis By Physical Delivery Format, 2026 to 2036
- Global Market Analysis and Forecast, By Commercial Application, 2021 to 2036
- Introduction / Key Findings
- Historical Market Size Value (USD Million) Analysis By Commercial Application, 2021 to 2025
- Current and Future Market Size Value (USD Million) Analysis and Forecast By Commercial Application, 2026 to 2036
- Dietary Supplements Macular Carotenoid Eye Health AREDS2
- Functional Fortified Food and Health Drinks
- Cosmetic Blue-Light Skin Protection Creams
- Poultry and Aquafeed Natural Pigmentation
- Pharmaceutical Ophthalmic Formulations
- Y-o-Y Growth Trend Analysis By Commercial Application, 2021 to 2025
- Absolute $ Opportunity Analysis By Commercial Application, 2026 to 2036
- Global Market Analysis and Forecast, By Isomer Specification, 2021 to 2036
- Introduction / Key Findings
- Historical Market Size Value (USD Million) Analysis By Isomer Specification, 2021 to 2025
- Current and Future Market Size Value (USD Million) Analysis and Forecast By Isomer Specification, 2026 to 2036
- All-Trans 3R-3'R Zeaxanthin Free Diol
- Meso-Zeaxanthin 3R-3'S Combination Blends
- Zeaxanthin Dipalmitate Ester Concentrates
- Standardized Lutein-Zeaxanthin 5 to 1 Premixes
- Y-o-Y Growth Trend Analysis By Isomer Specification, 2021 to 2025
- Absolute $ Opportunity Analysis By Isomer Specification, 2026 to 2036
- Global Market Analysis and Forecast, By Distribution Channel, 2021 to 2036
- Introduction / Key Findings
- Historical Market Size Value (USD Million) Analysis By Distribution Channel, 2021 to 2025
- Current and Future Market Size Value (USD Million) Analysis and Forecast By Distribution Channel, 2026 to 2036
- Direct to Nutraceutical and Feed Formulators
- Specialty Ingredient Distributors
- Contract Softgel and Premix Co-Packers
- Online B2B Ingredient Portals
- Y-o-Y Growth Trend Analysis By Distribution Channel, 2021 to 2025
- Absolute $ Opportunity Analysis By Distribution Channel, 2026 to 2036
- Global Market Analysis and Forecast, By Region, 2021 to 2036
- Introduction
- Historical Market Size Value (USD Million) Analysis By Region, 2021 to 2025
- Current Market Size Value (USD Million) Analysis and Forecast By Region, 2026 to 2036
- North America
- Latin America
- Western Europe
- Eastern Europe
- East Asia
- South Asia and Pacific
- Middle East and Africa
- Market Attractiveness Analysis By Region
- North America Market Analysis and Forecast, By Country, 2021 to 2036
- Historical Market Size Value (USD Million) Trend Analysis By Market Taxonomy, 2021 to 2025
- Market Size Value (USD Million) Forecast By Market Taxonomy, 2026 to 2036
- By Country
- United States
- Canada
- By Source Origin
- By Physical Delivery Format
- By Commercial Application
- By Isomer Specification
- By Distribution Channel
- By Country
- Market Attractiveness Analysis
- By Country
- By Source Origin
- By Physical Delivery Format
- By Commercial Application
- By Isomer Specification
- By Distribution Channel
- Key Takeaways
- Latin America Market Analysis and Forecast, By Country
- Historical Market Size Value (USD Million) Trend Analysis By Market Taxonomy, 2021 to 2025
- Market Size Value (USD Million) Forecast By Market Taxonomy, 2026 to 2036
- By Country
- Brazil
- Mexico
- Argentina
- Chile
- By Source Origin
- By Physical Delivery Format
- By Commercial Application
- By Isomer Specification
- By Distribution Channel
- By Country
- Market Attractiveness Analysis
- By Country
- By Source Origin
- By Physical Delivery Format
- By Commercial Application
- By Isomer Specification
- By Distribution Channel
- Key Takeaways
- Western Europe Market Analysis and Forecast, By Country
- Historical Market Size Value (USD Million) Trend Analysis By Market Taxonomy, 2021 to 2025
- Market Size Value (USD Million) Forecast By Market Taxonomy, 2026 to 2036
- By Country
- Germany
- France
- United Kingdom
- Italy
- Spain
- Benelux
- Nordics
- By Source Origin
- By Physical Delivery Format
- By Commercial Application
- By Isomer Specification
- By Distribution Channel
- By Country
- Market Attractiveness Analysis
- By Country
- By Source Origin
- By Physical Delivery Format
- By Commercial Application
- By Isomer Specification
- By Distribution Channel
- Key Takeaways
- Eastern Europe Market Analysis and Forecast, By Country
- Historical Market Size Value (USD Million) Trend Analysis By Market Taxonomy, 2021 to 2025
- Market Size Value (USD Million) Forecast By Market Taxonomy, 2026 to 2036
- By Country
- Poland
- Czech Republic
- Romania
- Hungary
- By Source Origin
- By Physical Delivery Format
- By Commercial Application
- By Isomer Specification
- By Distribution Channel
- By Country
- Market Attractiveness Analysis
- By Country
- By Source Origin
- By Physical Delivery Format
- By Commercial Application
- By Isomer Specification
- By Distribution Channel
- Key Takeaways
- East Asia Market Analysis and Forecast, By Country
- Historical Market Size Value (USD Million) Trend Analysis By Market Taxonomy, 2021 to 2025
- Market Size Value (USD Million) Forecast By Market Taxonomy, 2026 to 2036
- By Country
- China
- Japan
- South Korea
- By Source Origin
- By Physical Delivery Format
- By Commercial Application
- By Isomer Specification
- By Distribution Channel
- By Country
- Market Attractiveness Analysis
- By Country
- By Source Origin
- By Physical Delivery Format
- By Commercial Application
- By Isomer Specification
- By Distribution Channel
- Key Takeaways
- South Asia and Pacific Market Analysis and Forecast, By Country
- Historical Market Size Value (USD Million) Trend Analysis By Market Taxonomy, 2021 to 2025
- Market Size Value (USD Million) Forecast By Market Taxonomy, 2026 to 2036
- By Country
- India
- ASEAN
- Australia and New Zealand
- By Source Origin
- By Physical Delivery Format
- By Commercial Application
- By Isomer Specification
- By Distribution Channel
- By Country
- Market Attractiveness Analysis
- By Country
- By Source Origin
- By Physical Delivery Format
- By Commercial Application
- By Isomer Specification
- By Distribution Channel
- Key Takeaways
- Middle East and Africa Market Analysis and Forecast, By Country
- Historical Market Size Value (USD Million) Trend Analysis By Market Taxonomy, 2021 to 2025
- Market Size Value (USD Million) Forecast By Market Taxonomy, 2026 to 2036
- By Country
- GCC Countries
- South Africa
- Türkiye
- Israel
- By Source Origin
- By Physical Delivery Format
- By Commercial Application
- By Isomer Specification
- By Distribution Channel
- By Country
- Market Attractiveness Analysis
- By Country
- By Source Origin
- By Physical Delivery Format
- By Commercial Application
- By Isomer Specification
- By Distribution Channel
- Key Takeaways
- Key Countries Market Analysis
- United States
- Pricing Analysis
- Market Share Analysis, 2025
- By Source Origin
- By Physical Delivery Format
- By Commercial Application
- By Isomer Specification
- By Distribution Channel
- Canada
- Pricing Analysis
- Market Share Analysis, 2025
- By Source Origin
- By Physical Delivery Format
- By Commercial Application
- By Isomer Specification
- By Distribution Channel
- Mexico
- Pricing Analysis
- Market Share Analysis, 2025
- By Source Origin
- By Physical Delivery Format
- By Commercial Application
- By Isomer Specification
- By Distribution Channel
- Brazil
- Pricing Analysis
- Market Share Analysis, 2025
- By Source Origin
- By Physical Delivery Format
- By Commercial Application
- By Isomer Specification
- By Distribution Channel
- Chile
- Pricing Analysis
- Market Share Analysis, 2025
- By Source Origin
- By Physical Delivery Format
- By Commercial Application
- By Isomer Specification
- By Distribution Channel
- Germany
- Pricing Analysis
- Market Share Analysis, 2025
- By Source Origin
- By Physical Delivery Format
- By Commercial Application
- By Isomer Specification
- By Distribution Channel
- United Kingdom
- Pricing Analysis
- Market Share Analysis, 2025
- By Source Origin
- By Physical Delivery Format
- By Commercial Application
- By Isomer Specification
- By Distribution Channel
- Italy
- Pricing Analysis
- Market Share Analysis, 2025
- By Source Origin
- By Physical Delivery Format
- By Commercial Application
- By Isomer Specification
- By Distribution Channel
- Spain
- Pricing Analysis
- Market Share Analysis, 2025
- By Source Origin
- By Physical Delivery Format
- By Commercial Application
- By Isomer Specification
- By Distribution Channel
- France
- Pricing Analysis
- Market Share Analysis, 2025
- By Source Origin
- By Physical Delivery Format
- By Commercial Application
- By Isomer Specification
- By Distribution Channel
- India
- Pricing Analysis
- Market Share Analysis, 2025
- By Source Origin
- By Physical Delivery Format
- By Commercial Application
- By Isomer Specification
- By Distribution Channel
- ASEAN
- Pricing Analysis
- Market Share Analysis, 2025
- By Source Origin
- By Physical Delivery Format
- By Commercial Application
- By Isomer Specification
- By Distribution Channel
- Australia and New Zealand
- Pricing Analysis
- Market Share Analysis, 2025
- By Source Origin
- By Physical Delivery Format
- By Commercial Application
- By Isomer Specification
- By Distribution Channel
- China
- Pricing Analysis
- Market Share Analysis, 2025
- By Source Origin
- By Physical Delivery Format
- By Commercial Application
- By Isomer Specification
- By Distribution Channel
- Japan
- Pricing Analysis
- Market Share Analysis, 2025
- By Source Origin
- By Physical Delivery Format
- By Commercial Application
- By Isomer Specification
- By Distribution Channel
- South Korea
- Pricing Analysis
- Market Share Analysis, 2025
- By Source Origin
- By Physical Delivery Format
- By Commercial Application
- By Isomer Specification
- By Distribution Channel
- Poland
- Pricing Analysis
- Market Share Analysis, 2025
- By Source Origin
- By Physical Delivery Format
- By Commercial Application
- By Isomer Specification
- By Distribution Channel
- Hungary
- Pricing Analysis
- Market Share Analysis, 2025
- By Source Origin
- By Physical Delivery Format
- By Commercial Application
- By Isomer Specification
- By Distribution Channel
- Türkiye
- Pricing Analysis
- Market Share Analysis, 2025
- By Source Origin
- By Physical Delivery Format
- By Commercial Application
- By Isomer Specification
- By Distribution Channel
- South Africa
- Pricing Analysis
- Market Share Analysis, 2025
- By Source Origin
- By Physical Delivery Format
- By Commercial Application
- By Isomer Specification
- By Distribution Channel
- Netherlands
- Pricing Analysis
- Market Share Analysis, 2025
- By Source Origin
- By Physical Delivery Format
- By Commercial Application
- By Isomer Specification
- By Distribution Channel
- United States
- Market Structure Analysis
- Competition Dashboard
- Competition Benchmarking
- Market Share Analysis of Top Players
- By Regional
- By Source Origin
- By Physical Delivery Format
- By Commercial Application
- By Isomer Specification
- By Distribution Channel
- Emerging Startups
- Innovation Benchmarking
- Competition Analysis
- Competition Deep Dive
- dsm-firmenich AG
- Overview
- Product Portfolio
- Profitability by Market Segments
- Sales Footprint
- Strategy Overview
- Marketing Strategy
- Product Strategy
- Channel Strategy
- BASF SE
- Kemin Industries Inc.
- OmniActive Health Technologies
- Archer Daniels Midland Company
- Cargill Incorporated
- International Flavors and Fragrances Inc.
- Kerry Group plc
- Ingredion Incorporated
- Tate and Lyle plc
- dsm-firmenich AG
- Case Studies
- Success Stories
- Recent Developments
- Competition Deep Dive
- Assumptions & Acronyms Used
List of Tables
- Table 1: Global Market Value (USD Million) Forecast by Region, 2021 to 2036
- Table 2: Global Market Value (USD Million) Forecast by Source Origin, 2021 to 2036
- Table 3: Global Market Value (USD Million) Forecast by Physical Delivery Format, 2021 to 2036
- Table 4: Global Market Value (USD Million) Forecast by Commercial Application, 2021 to 2036
- Table 5: Global Market Value (USD Million) Forecast by Isomer Specification, 2021 to 2036
- Table 6: Global Market Value (USD Million) Forecast by Distribution Channel, 2021 to 2036
- Table 7: North America Market Value (USD Million) Forecast by Country, 2021 to 2036
- Table 8: North America Market Value (USD Million) Forecast by Source Origin, 2021 to 2036
- Table 9: North America Market Value (USD Million) Forecast by Physical Delivery Format, 2021 to 2036
- Table 10: North America Market Value (USD Million) Forecast by Commercial Application, 2021 to 2036
- Table 11: North America Market Value (USD Million) Forecast by Isomer Specification, 2021 to 2036
- Table 12: North America Market Value (USD Million) Forecast by Distribution Channel, 2021 to 2036
- Table 13: Latin America Market Value (USD Million) Forecast by Country, 2021 to 2036
- Table 14: Latin America Market Value (USD Million) Forecast by Source Origin, 2021 to 2036
- Table 15: Latin America Market Value (USD Million) Forecast by Physical Delivery Format, 2021 to 2036
- Table 16: Latin America Market Value (USD Million) Forecast by Commercial Application, 2021 to 2036
- Table 17: Latin America Market Value (USD Million) Forecast by Isomer Specification, 2021 to 2036
- Table 18: Latin America Market Value (USD Million) Forecast by Distribution Channel, 2021 to 2036
- Table 19: Western Europe Market Value (USD Million) Forecast by Country, 2021 to 2036
- Table 20: Western Europe Market Value (USD Million) Forecast by Source Origin, 2021 to 2036
- Table 21: Western Europe Market Value (USD Million) Forecast by Physical Delivery Format, 2021 to 2036
- Table 22: Western Europe Market Value (USD Million) Forecast by Commercial Application, 2021 to 2036
- Table 23: Western Europe Market Value (USD Million) Forecast by Isomer Specification, 2021 to 2036
- Table 24: Western Europe Market Value (USD Million) Forecast by Distribution Channel, 2021 to 2036
- Table 25: Eastern Europe Market Value (USD Million) Forecast by Country, 2021 to 2036
- Table 26: Eastern Europe Market Value (USD Million) Forecast by Source Origin, 2021 to 2036
- Table 27: Eastern Europe Market Value (USD Million) Forecast by Physical Delivery Format, 2021 to 2036
- Table 28: Eastern Europe Market Value (USD Million) Forecast by Commercial Application, 2021 to 2036
- Table 29: Eastern Europe Market Value (USD Million) Forecast by Isomer Specification, 2021 to 2036
- Table 30: Eastern Europe Market Value (USD Million) Forecast by Distribution Channel, 2021 to 2036
- Table 31: East Asia Market Value (USD Million) Forecast by Country, 2021 to 2036
- Table 32: East Asia Market Value (USD Million) Forecast by Source Origin, 2021 to 2036
- Table 33: East Asia Market Value (USD Million) Forecast by Physical Delivery Format, 2021 to 2036
- Table 34: East Asia Market Value (USD Million) Forecast by Commercial Application, 2021 to 2036
- Table 35: East Asia Market Value (USD Million) Forecast by Isomer Specification, 2021 to 2036
- Table 36: East Asia Market Value (USD Million) Forecast by Distribution Channel, 2021 to 2036
- Table 37: South Asia and Pacific Market Value (USD Million) Forecast by Country, 2021 to 2036
- Table 38: South Asia and Pacific Market Value (USD Million) Forecast by Source Origin, 2021 to 2036
- Table 39: South Asia and Pacific Market Value (USD Million) Forecast by Physical Delivery Format, 2021 to 2036
- Table 40: South Asia and Pacific Market Value (USD Million) Forecast by Commercial Application, 2021 to 2036
- Table 41: South Asia and Pacific Market Value (USD Million) Forecast by Isomer Specification, 2021 to 2036
- Table 42: South Asia and Pacific Market Value (USD Million) Forecast by Distribution Channel, 2021 to 2036
- Table 43: Middle East and Africa Market Value (USD Million) Forecast by Country, 2021 to 2036
- Table 44: Middle East and Africa Market Value (USD Million) Forecast by Source Origin, 2021 to 2036
- Table 45: Middle East and Africa Market Value (USD Million) Forecast by Physical Delivery Format, 2021 to 2036
- Table 46: Middle East and Africa Market Value (USD Million) Forecast by Commercial Application, 2021 to 2036
- Table 47: Middle East and Africa Market Value (USD Million) Forecast by Isomer Specification, 2021 to 2036
- Table 48: Middle East and Africa Market Value (USD Million) Forecast by Distribution Channel, 2021 to 2036
List of Figures
- Figure 1: Global Market Pricing Analysis
- Figure 2: Global Market Value (USD Million) Forecast 2021-2036
- Figure 3: Global Market Value Share and BPS Analysis by Source Origin, 2026 and 2036
- Figure 4: Global Market Y-o-Y Growth Comparison by Source Origin, 2026-2036
- Figure 5: Global Market Attractiveness Analysis by Source Origin
- Figure 6: Global Market Value Share and BPS Analysis by Physical Delivery Format, 2026 and 2036
- Figure 7: Global Market Y-o-Y Growth Comparison by Physical Delivery Format, 2026-2036
- Figure 8: Global Market Attractiveness Analysis by Physical Delivery Format
- Figure 9: Global Market Value Share and BPS Analysis by Commercial Application, 2026 and 2036
- Figure 10: Global Market Y-o-Y Growth Comparison by Commercial Application, 2026-2036
- Figure 11: Global Market Attractiveness Analysis by Commercial Application
- Figure 12: Global Market Value Share and BPS Analysis by Isomer Specification, 2026 and 2036
- Figure 13: Global Market Y-o-Y Growth Comparison by Isomer Specification, 2026-2036
- Figure 14: Global Market Attractiveness Analysis by Isomer Specification
- Figure 15: Global Market Value Share and BPS Analysis by Distribution Channel, 2026 and 2036
- Figure 16: Global Market Y-o-Y Growth Comparison by Distribution Channel, 2026-2036
- Figure 17: Global Market Attractiveness Analysis by Distribution Channel
- Figure 18: Global Market Value (USD Million) Share and BPS Analysis by Region, 2026 and 2036
- Figure 19: Global Market Y-o-Y Growth Comparison by Region, 2026-2036
- Figure 20: Global Market Attractiveness Analysis by Region
- Figure 21: North America Market Incremental Dollar Opportunity, 2026-2036
- Figure 22: Latin America Market Incremental Dollar Opportunity, 2026-2036
- Figure 23: Western Europe Market Incremental Dollar Opportunity, 2026-2036
- Figure 24: Eastern Europe Market Incremental Dollar Opportunity, 2026-2036
- Figure 25: East Asia Market Incremental Dollar Opportunity, 2026-2036
- Figure 26: South Asia and Pacific Market Incremental Dollar Opportunity, 2026-2036
- Figure 27: Middle East and Africa Market Incremental Dollar Opportunity, 2026-2036
- Figure 28: North America Market Value Share and BPS Analysis by Country, 2026 and 2036
- Figure 29: North America Market Value Share and BPS Analysis by Source Origin, 2026 and 2036
- Figure 30: North America Market Y-o-Y Growth Comparison by Source Origin, 2026-2036
- Figure 31: North America Market Attractiveness Analysis by Source Origin
- Figure 32: North America Market Value Share and BPS Analysis by Physical Delivery Format, 2026 and 2036
- Figure 33: North America Market Y-o-Y Growth Comparison by Physical Delivery Format, 2026-2036
- Figure 34: North America Market Attractiveness Analysis by Physical Delivery Format
- Figure 35: North America Market Value Share and BPS Analysis by Commercial Application, 2026 and 2036
- Figure 36: North America Market Y-o-Y Growth Comparison by Commercial Application, 2026-2036
- Figure 37: North America Market Attractiveness Analysis by Commercial Application
- Figure 38: North America Market Value Share and BPS Analysis by Isomer Specification, 2026 and 2036
- Figure 39: North America Market Y-o-Y Growth Comparison by Isomer Specification, 2026-2036
- Figure 40: North America Market Attractiveness Analysis by Isomer Specification
- Figure 41: North America Market Value Share and BPS Analysis by Distribution Channel, 2026 and 2036
- Figure 42: North America Market Y-o-Y Growth Comparison by Distribution Channel, 2026-2036
- Figure 43: North America Market Attractiveness Analysis by Distribution Channel
- Figure 44: Latin America Market Value Share and BPS Analysis by Country, 2026 and 2036
- Figure 45: Latin America Market Value Share and BPS Analysis by Source Origin, 2026 and 2036
- Figure 46: Latin America Market Y-o-Y Growth Comparison by Source Origin, 2026-2036
- Figure 47: Latin America Market Attractiveness Analysis by Source Origin
- Figure 48: Latin America Market Value Share and BPS Analysis by Physical Delivery Format, 2026 and 2036
- Figure 49: Latin America Market Y-o-Y Growth Comparison by Physical Delivery Format, 2026-2036
- Figure 50: Latin America Market Attractiveness Analysis by Physical Delivery Format
- Figure 51: Latin America Market Value Share and BPS Analysis by Commercial Application, 2026 and 2036
- Figure 52: Latin America Market Y-o-Y Growth Comparison by Commercial Application, 2026-2036
- Figure 53: Latin America Market Attractiveness Analysis by Commercial Application
- Figure 54: Latin America Market Value Share and BPS Analysis by Isomer Specification, 2026 and 2036
- Figure 55: Latin America Market Y-o-Y Growth Comparison by Isomer Specification, 2026-2036
- Figure 56: Latin America Market Attractiveness Analysis by Isomer Specification
- Figure 57: Latin America Market Value Share and BPS Analysis by Distribution Channel, 2026 and 2036
- Figure 58: Latin America Market Y-o-Y Growth Comparison by Distribution Channel, 2026-2036
- Figure 59: Latin America Market Attractiveness Analysis by Distribution Channel
- Figure 60: Western Europe Market Value Share and BPS Analysis by Country, 2026 and 2036
- Figure 61: Western Europe Market Value Share and BPS Analysis by Source Origin, 2026 and 2036
- Figure 62: Western Europe Market Y-o-Y Growth Comparison by Source Origin, 2026-2036
- Figure 63: Western Europe Market Attractiveness Analysis by Source Origin
- Figure 64: Western Europe Market Value Share and BPS Analysis by Physical Delivery Format, 2026 and 2036
- Figure 65: Western Europe Market Y-o-Y Growth Comparison by Physical Delivery Format, 2026-2036
- Figure 66: Western Europe Market Attractiveness Analysis by Physical Delivery Format
- Figure 67: Western Europe Market Value Share and BPS Analysis by Commercial Application, 2026 and 2036
- Figure 68: Western Europe Market Y-o-Y Growth Comparison by Commercial Application, 2026-2036
- Figure 69: Western Europe Market Attractiveness Analysis by Commercial Application
- Figure 70: Western Europe Market Value Share and BPS Analysis by Isomer Specification, 2026 and 2036
- Figure 71: Western Europe Market Y-o-Y Growth Comparison by Isomer Specification, 2026-2036
- Figure 72: Western Europe Market Attractiveness Analysis by Isomer Specification
- Figure 73: Western Europe Market Value Share and BPS Analysis by Distribution Channel, 2026 and 2036
- Figure 74: Western Europe Market Y-o-Y Growth Comparison by Distribution Channel, 2026-2036
- Figure 75: Western Europe Market Attractiveness Analysis by Distribution Channel
- Figure 76: Eastern Europe Market Value Share and BPS Analysis by Country, 2026 and 2036
- Figure 77: Eastern Europe Market Value Share and BPS Analysis by Source Origin, 2026 and 2036
- Figure 78: Eastern Europe Market Y-o-Y Growth Comparison by Source Origin, 2026-2036
- Figure 79: Eastern Europe Market Attractiveness Analysis by Source Origin
- Figure 80: Eastern Europe Market Value Share and BPS Analysis by Physical Delivery Format, 2026 and 2036
- Figure 81: Eastern Europe Market Y-o-Y Growth Comparison by Physical Delivery Format, 2026-2036
- Figure 82: Eastern Europe Market Attractiveness Analysis by Physical Delivery Format
- Figure 83: Eastern Europe Market Value Share and BPS Analysis by Commercial Application, 2026 and 2036
- Figure 84: Eastern Europe Market Y-o-Y Growth Comparison by Commercial Application, 2026-2036
- Figure 85: Eastern Europe Market Attractiveness Analysis by Commercial Application
- Figure 86: Eastern Europe Market Value Share and BPS Analysis by Isomer Specification, 2026 and 2036
- Figure 87: Eastern Europe Market Y-o-Y Growth Comparison by Isomer Specification, 2026-2036
- Figure 88: Eastern Europe Market Attractiveness Analysis by Isomer Specification
- Figure 89: Eastern Europe Market Value Share and BPS Analysis by Distribution Channel, 2026 and 2036
- Figure 90: Eastern Europe Market Y-o-Y Growth Comparison by Distribution Channel, 2026-2036
- Figure 91: Eastern Europe Market Attractiveness Analysis by Distribution Channel
- Figure 92: East Asia Market Value Share and BPS Analysis by Country, 2026 and 2036
- Figure 93: East Asia Market Value Share and BPS Analysis by Source Origin, 2026 and 2036
- Figure 94: East Asia Market Y-o-Y Growth Comparison by Source Origin, 2026-2036
- Figure 95: East Asia Market Attractiveness Analysis by Source Origin
- Figure 96: East Asia Market Value Share and BPS Analysis by Physical Delivery Format, 2026 and 2036
- Figure 97: East Asia Market Y-o-Y Growth Comparison by Physical Delivery Format, 2026-2036
- Figure 98: East Asia Market Attractiveness Analysis by Physical Delivery Format
- Figure 99: East Asia Market Value Share and BPS Analysis by Commercial Application, 2026 and 2036
- Figure 100: East Asia Market Y-o-Y Growth Comparison by Commercial Application, 2026-2036
- Figure 101: East Asia Market Attractiveness Analysis by Commercial Application
- Figure 102: East Asia Market Value Share and BPS Analysis by Isomer Specification, 2026 and 2036
- Figure 103: East Asia Market Y-o-Y Growth Comparison by Isomer Specification, 2026-2036
- Figure 104: East Asia Market Attractiveness Analysis by Isomer Specification
- Figure 105: East Asia Market Value Share and BPS Analysis by Distribution Channel, 2026 and 2036
- Figure 106: East Asia Market Y-o-Y Growth Comparison by Distribution Channel, 2026-2036
- Figure 107: East Asia Market Attractiveness Analysis by Distribution Channel
- Figure 108: South Asia and Pacific Market Value Share and BPS Analysis by Country, 2026 and 2036
- Figure 109: South Asia and Pacific Market Value Share and BPS Analysis by Source Origin, 2026 and 2036
- Figure 110: South Asia and Pacific Market Y-o-Y Growth Comparison by Source Origin, 2026-2036
- Figure 111: South Asia and Pacific Market Attractiveness Analysis by Source Origin
- Figure 112: South Asia and Pacific Market Value Share and BPS Analysis by Physical Delivery Format, 2026 and 2036
- Figure 113: South Asia and Pacific Market Y-o-Y Growth Comparison by Physical Delivery Format, 2026-2036
- Figure 114: South Asia and Pacific Market Attractiveness Analysis by Physical Delivery Format
- Figure 115: South Asia and Pacific Market Value Share and BPS Analysis by Commercial Application, 2026 and 2036
- Figure 116: South Asia and Pacific Market Y-o-Y Growth Comparison by Commercial Application, 2026-2036
- Figure 117: South Asia and Pacific Market Attractiveness Analysis by Commercial Application
- Figure 118: South Asia and Pacific Market Value Share and BPS Analysis by Isomer Specification, 2026 and 2036
- Figure 119: South Asia and Pacific Market Y-o-Y Growth Comparison by Isomer Specification, 2026-2036
- Figure 120: South Asia and Pacific Market Attractiveness Analysis by Isomer Specification
- Figure 121: South Asia and Pacific Market Value Share and BPS Analysis by Distribution Channel, 2026 and 2036
- Figure 122: South Asia and Pacific Market Y-o-Y Growth Comparison by Distribution Channel, 2026-2036
- Figure 123: South Asia and Pacific Market Attractiveness Analysis by Distribution Channel
- Figure 124: Middle East and Africa Market Value Share and BPS Analysis by Country, 2026 and 2036
- Figure 125: Middle East and Africa Market Value Share and BPS Analysis by Source Origin, 2026 and 2036
- Figure 126: Middle East and Africa Market Y-o-Y Growth Comparison by Source Origin, 2026-2036
- Figure 127: Middle East and Africa Market Attractiveness Analysis by Source Origin
- Figure 128: Middle East and Africa Market Value Share and BPS Analysis by Physical Delivery Format, 2026 and 2036
- Figure 129: Middle East and Africa Market Y-o-Y Growth Comparison by Physical Delivery Format, 2026-2036
- Figure 130: Middle East and Africa Market Attractiveness Analysis by Physical Delivery Format
- Figure 131: Middle East and Africa Market Value Share and BPS Analysis by Commercial Application, 2026 and 2036
- Figure 132: Middle East and Africa Market Y-o-Y Growth Comparison by Commercial Application, 2026-2036
- Figure 133: Middle East and Africa Market Attractiveness Analysis by Commercial Application
- Figure 134: Middle East and Africa Market Value Share and BPS Analysis by Isomer Specification, 2026 and 2036
- Figure 135: Middle East and Africa Market Y-o-Y Growth Comparison by Isomer Specification, 2026-2036
- Figure 136: Middle East and Africa Market Attractiveness Analysis by Isomer Specification
- Figure 137: Middle East and Africa Market Value Share and BPS Analysis by Distribution Channel, 2026 and 2036
- Figure 138: Middle East and Africa Market Y-o-Y Growth Comparison by Distribution Channel, 2026-2036
- Figure 139: Middle East and Africa Market Attractiveness Analysis by Distribution Channel
- Figure 140: Global Market - Tier Structure Analysis
- Figure 141: Global Market - Company Share Analysis
Frequently Asked Questions
How big is the zeaxanthin market in 2026, and what is forecast for 2036?
FMI estimates that the global zeaxanthin market size stood at USD 505.0 million in 2025 and reached USD 525.1 million in 2026. Overall industry valuation is on track to hit USD 792.4 million by 2036 as ocular supplement brands and poultry feed mills standardize bioavailable xanthophyll dosing.
What is the CAGR for the zeaxanthin market from 2026 to 2036?
The zeaxanthin sector is projected to expand at a 4.2% CAGR over the 2026 to 2036 window, adding USD 267.3 million in incremental value across nutraceutical and beverage plus animal nutrition channels.
Which source origin segment leads the zeaxanthin market?
Natural Marigold Flower Tagetes erecta Extraction holds 33.3% of source origin demand in 2026 because selective botanical saponification satisfies clean-label supplement regulations across major consumer markets.
Which physical delivery format segment leads the zeaxanthin market?
Cold Water Dispersible CWD Beadlets 5% to 10% represent 45.4% of the physical delivery format category in 2026 as starch-coated microcapsules resist tablet compression heat and disperse cleanly in functional drinks.
Which country has a notable growth outlook during the assessment period?
China leads national expansion projections at a 4.6% CAGR through 2036, supported by high-zeaxanthin marigold cultivation upgrades and pediatric vision supplement adoption.
Who are the key players in the market?
dsm-firmenich AG and BASF SE with Kemin Industries and OmniActive Health Technologies lead active carotenoid supply. Archer Daniels Midland Company and Cargill Incorporated with International Flavors and Fragrances and Kerry Group plc plus Ingredion Incorporated and Tate and Lyle plc lead premix and hydrocolloid encapsulation supply.
Preview the report firsthand - request a free sample
Get SampleGet the brochure for pricing and purchase details.
Get PDF
