


Antioxidants Market : Global Industry Analysis and Opportunity Assessment, 2036
Antioxidants Market is segmented by Product Type, Application, Form, and Region. Forecast for 2026 to 2036.
- Market Size (2026): USD 2.6 Bn
- Forecast (2036): USD 6.8 Bn
- CAGR (2026 to 2036): 10.0%
How big is the Antioxidants Market in 2026?
USD 2.6 billion in 2026, reaching USD 6.8 billion by 2036 at a 10.0% CAGR
The antioxidants market is estimated at USD 2.6 billion in 2026 and is forecast to reach USD 6.8 billion by 2036 at a 10.0% CAGR. Natural Antioxidants accounts for 56.0% of product type revenue in 2026, while Food Products leads application at 35.0%. Demand is shaped by buyers consolidating purchases around the natural antioxidants category to control cost and qualification effort.
Expansion is paced by FMCG buyers refreshing installed product type on planned cycles, not by sudden surges. Adoption is increasing due to the premium buyers place on continuity of supply over headline price. The fastest expansion sits in China at 13.5% CAGR, followed by India at 12.5%, where buying centers prioritize e-commerce and food-delivery channel scale.
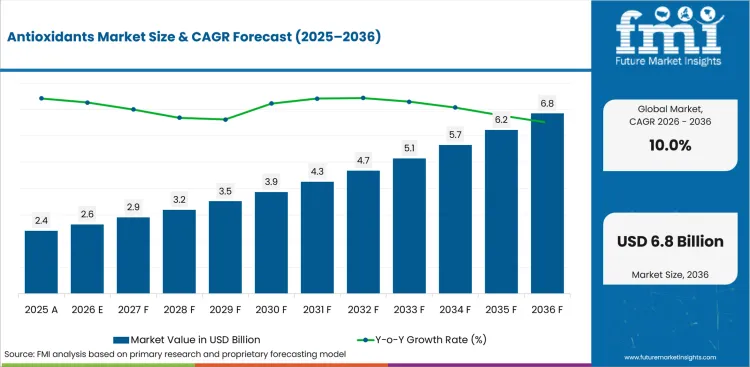
Summary of the Antioxidants Market
| Market Signal | Commercial Impact |
|---|---|
| Demand and Growth Drivers | Recurring replacement demand and high switching costs keep natural antioxidants procurement durable.
|
| Product and Segment View | Natural Antioxidants and Food Products lead their respective segments in 2026.
|
| Geography and Competitive Outlook | China is expected to remain the key growth market, with BASF SE and Koninklijke DSM N.V. leading competition.
|
| Analyst Perspective | Buyers now judge natural antioxidants on performance and total cost of ownership, not headline price.
|
Why is the Antioxidants Market growing?
Rising Natural Antioxidants and Food Products demand across FMCG end users
- Sustained procurement of natural antioxidants is shaped by replacement cycles and capacity additions among FMCG buyers in both established and emerging markets.
- China leads growth at 13.5% CAGR, supported by e-commerce and food-delivery channel scale and cost advantage of domestic producers.
- Food Products holds 35.0% of application revenue, indicating where standardization is concentrating buyer spend.
Demand is shaped by buyers seeking consistent natural antioxidants supply across multiple sites while limiting requalification. Adoption is increasing due to the operational cost of switching suppliers, which favors incumbents with broad product type coverage and responsive service.
How is the Antioxidants Market segmented?
By Product Type, Application, Form, Source, End Use and Function
- Natural Antioxidants leads the product type category with 56.0% share in 2026 on the strength of buyer familiarity and supply availability.
- Food Products leads the application category with 35.0% share as specifications standardize across buyer sites.
- Dry Form anchors the form category, marking where incremental volume is consolidating.
Why does Natural Antioxidants lead the Antioxidants Market?
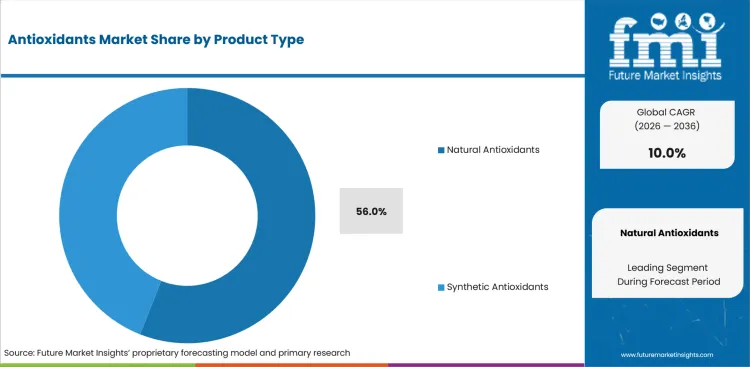
- Natural Antioxidants is expected to hold 56.0% of product type revenue in 2026 because buyers retain it for predictable performance and lower requalification effort.
How big is the Food Products segment in the Antioxidants Market?
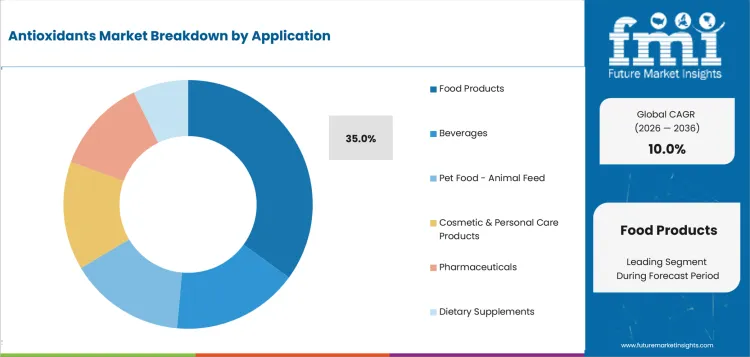
- Food Products is forecast to hold 35.0% of application revenue in 2026.
How do the remaining segments shape the Antioxidants Market?
- By form, Dry Form is the leading category in 2026.
- By source, Plant Based Sources is the leading category in 2026.
- By end use, Food Industry is the leading category in 2026.
- By function, Preservatives is the leading category in 2026.
What drives and restrains the Antioxidants Market?
Driven by natural antioxidants replacement demand; restrained by qualification and cost barriers
Recurring product type procurement supports expansion, while upfront cost and certification effort limit faster adoption among smaller buyers.
- Driver: Food Industry sustain natural antioxidants demand through replacement and capacity additions, keeping procurement recurring across the forecast period.
- Restraint: Certification and requalification effort for new product type specifications slows substitution, particularly for smaller buyers with limited engineering capacity.
- Opportunity: Suppliers offering food products configurations that drop into existing workflows can widen adoption without full replacement.
Demand is shaped by buyers protecting continuity of supply, which rewards incumbents with broad product type portfolios.
Which factors support expansion in the Antioxidants Market?
Replacement demand, standardization and service coverage support market value
- Market value is supported by natural antioxidants replacement purchases before aftermarket and service revenue accrues.
- Supplier pricing reflects product type performance and availability before service coverage affects renewal demand.
- Buyers compare qualification time and support response before committing to multi-site standardization on food products.
Which countries are growing fastest in the Antioxidants Market?
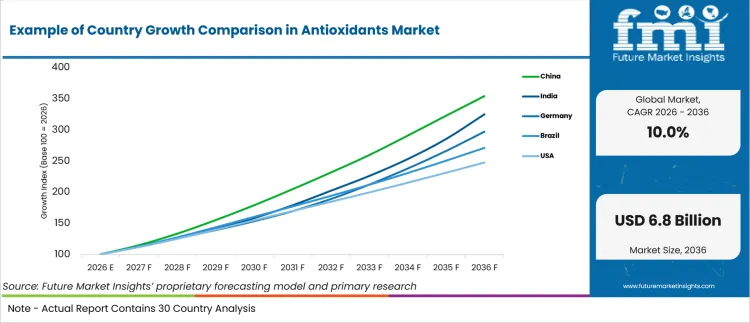
| Country | CAGR |
|---|---|
| China | 13.5% |
| India | 12.5% |
| Germany | 11.5% |
| Brazil | 10.5% |
| USA | 9.5% |
| UK | 8.5% |
| Japan | 7.5% |
Source: FMI's proprietary forecasting model and primary research
How do country-level CAGRs compare in the Antioxidants Market?
Country growth in the Antioxidants Market is expected to vary through 2036, with China at 13.5%, India at 12.5%, Germany at 11.5%, Brazil at 10.5%, USA at 9.5%, UK at 8.5%, and Japan at 7.5%. China is projected to grow fastest among the profiled countries and Japan the slowest. Higher-growth markets are shaped more by new demand formation, while established markets weigh documented performance and supply continuity before account expansion.
- China is projected at 13.5% CAGR through 2036. Buyers in China weight cost advantage of domestic producers heavily when committing to new specifications. China's exposure to e-commerce and food-delivery channel scale keeps replacement and expansion spending firm. Procurement in China tracks cost advantage of domestic producers, which sets the pace of new commitments.
- India is projected at 12.5% CAGR through 2036. India's trajectory is set less by price than by organized-retail and quick-commerce expansion. Buyers cite organized-retail and quick-commerce expansion as the reason food products budgets are released ahead of schedule. Tier-2 and tier-3 distribution deepening widens the qualified buyer base for food products beyond the largest accounts.
- Germany is projected at 11.5% CAGR through 2036. Germany demand rests on EU packaging regulation and EPR fees, with discounter (Aldi, Lidl) sourcing power adding a second pillar of support. Germany's exposure to EU packaging regulation and EPR fees keeps replacement and expansion spending firm. Demand for food products is anchored by discounter (Aldi, Lidl) sourcing power, insulating it from short cycles.
- Brazil is projected at 10.5% CAGR through 2036.
- USA is projected at 9.5% CAGR through 2036. Buyers in USA weight recyclability and sustainability mandates from major chains heavily when committing to new specifications. Where retailer private-label pressure applies, specification activity concentrates in the Northeast and West Coast metro corridors. Recyclability and sustainability mandates from major chains widens the qualified buyer base for food products beyond the largest accounts.
- UK is projected at 8.5% CAGR through 2036.
- Japan is projected at 7.5% CAGR through 2036. Japan demand rests on convenience-store (konbini) channel dominance, with strict quality and labelling standards adding a second pillar of support. Japan's exposure to convenience-store (konbini) channel dominance keeps replacement and expansion spending firm. Strict quality and labelling standards underwrites multi-year demand visibility rather than spot purchasing.
Who are the leading companies in the Antioxidants Market?
BASF SE, Koninklijke DSM N.V., Kemin Industries, Archer Daniels Midland (ADM) and International Flavors & Fragrances Inc. (IFF)
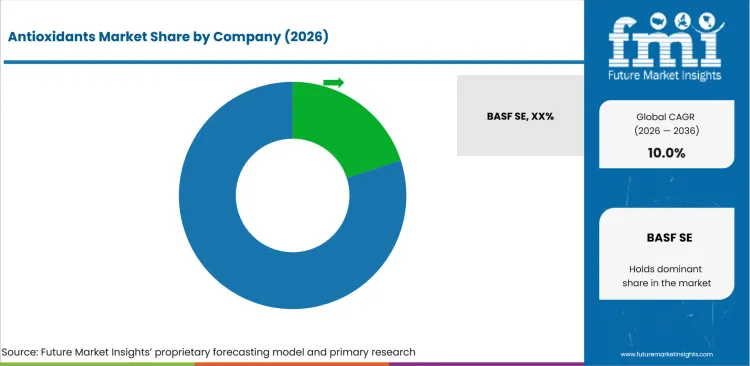
BASF SE and Koninklijke DSM N.V. compete through supply depth and qualification support across FMCG buyers. Kemin Industries maintains position through portfolio breadth, while service coverage and lead-time reliability are further competitive levers.
Who are the key players in the Antioxidants Market?
Key global companies leading the market include:
- BASF SE, Koninklijke DSM N.V., Kemin Industries, Archer Daniels Midland (ADM) and International Flavors & Fragrances Inc. (IFF) maintain leading positions through established manufacturing, portfolio breadth and direct procurement relationships.
- Camlin Fine Sciences Ltd., Barentz International and Givaudan compete through specialized configurations, competitive pricing and localized distribution in high-growth markets.
- Zhejiang NHU Co., Ltd. targets underserved applications and regional markets to establish initial procurement positions.
How do top Antioxidants Market companies compare?
BASF SE and Koninklijke DSM N.V. lead on scale; Kemin Industries also has a global footprint, while Archer Daniels Midland (ADM) and DuPont (IFF - International Flavors & Fragrances Inc.) are more regionally concentrated.
| Company | Portfolio Breadth | Qualification Depth | Supply Scale | Geographic Footprint |
|---|---|---|---|---|
| BASF SE | High | High | Strong | Global |
| Koninklijke DSM N.V. | High | High | Strong | Global |
| Kemin Industries | Medium | Medium | Moderate | Global |
| Archer Daniels Midland (ADM) | High | Medium | Moderate | Regional |
| DuPont (IFF - International Flavors & Fragrances Inc.) | Medium | Medium | Moderate | Regional |
Source: Future Market Insights competitive analysis, 2026.
Key Players in the Antioxidants Market
Global Brand Owners
- BASF SE
- Archer Daniels Midland (ADM)
- Barentz International
- Zhejiang NHU Co., Ltd.
Specialty and Private-Label Suppliers
- Koninklijke DSM N.V.
- International Flavors & Fragrances Inc. (IFF)
- Givaudan
Regional Players
- Kemin Industries
- Camlin Fine Sciences Ltd.
- BTSA Biotecnologías Aplicadas
Antioxidants Market - Scope & Definition
| Attribute | Detail |
|---|---|
| Market Definition | Products and solutions within the antioxidants market spanning Product Type, Application and Form categories |
| Key Segments Covered | Natural Antioxidants, Food Products and Dry Form and related FMCG applications |
| Applications Covered | Food Products, Beverages, Pet Food - Animal Feed and Cosmetic & Personal Care Products |
| End-Use Industries | Food Industry, Healthcare Industry, Cosmetics Industry and Agriculture Industry |
| Inclusions | Commercially sold product type, application and associated configurations |
| Exclusions | Custom one-off systems, standalone services and raw inputs outside the antioxidants market boundary |
Antioxidants Market - Research Methodology
| Method | Description |
|---|---|
| Primary Research | FMI analyst interviews with FMCG suppliers, distributors and procurement teams across major markets |
| Desk Research | Review of official activity data, regulatory releases, company disclosures and production statistics |
| Market Sizing & Forecasting | Bottom-up sizing using segment revenue, adoption rates, replacement demand and country-level activity |
| Data Validation | Cross-verification against public evidence, supplier portfolios and official indicators |
What does the Antioxidants Market report cover?
2021 to 2025 history and 2026 to 2036 forecasts across all segments and 30+ countries
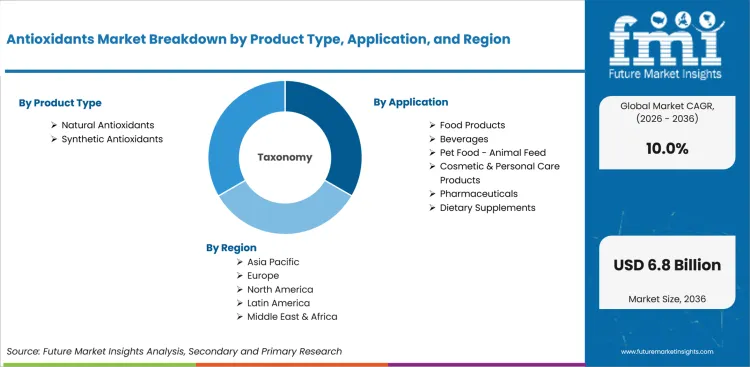
| Parameter | Details |
|---|---|
| Forecast period | 2026 to 2036 |
| Historical period | 2021 to 2025 |
| Quantitative unit | Revenue in USD billion |
| By Product Type | Natural Antioxidants and Synthetic Antioxidants |
| By Application | Food Products, Beverages, Pet Food - Animal Feed, Cosmetic & Personal Care Products, Pharmaceuticals and Dietary Supplements |
| By Form | Dry Form and Liquid Form |
| By Source | Plant Based Sources, Animal Based Sources and Chemical Sources |
| By End Use | Food Industry, Healthcare Industry, Cosmetics Industry and Agriculture Industry |
| By Function | Preservatives, Nutritional Additives and Color Stabilizers |
| Regions covered | North America, Latin America, Western Europe, Eastern Europe, East Asia, South Asia and Pacific, Middle East and Africa |
| Countries covered | USA, China, India, Germany, Brazil, UK, Japan |
| Key companies profiled | BASF SE, Koninklijke DSM N.V., Kemin Industries, Archer Daniels Midland (ADM) and DuPont (IFF - International Flavors & Fragrances Inc.) |
| Approach | Bottom-up segment-boundary approach using adoption, replacement demand and supplier disclosures |
Market Segmentation Analysis
Antioxidants Market Segmented by Product Type:
- Natural Antioxidants
- Vitamin C
- Vitamin E
- Carotenoids
- Polyphenols
- Synthetic Antioxidants
- Butylated Hydroxyanisole
- Butylated Hydroxytoluene
- Tert Butylhydroquinone
- Propyl Gallate
Antioxidants Market Segmented by Application:
- Food Products
- Fats and Oils Stabilization
- Packaged Food Preservation
- Beverages
- Beverage Fortification
- Pet Food - Animal Feed
- Livestock Feed
- Pet Food
- Cosmetic & Personal Care Products
- Skin Care Products
- Hair Care Products
- Pharmaceuticals
- Formulation Stabilization
- Therapeutic Applications
- Dietary Supplements
- Tablets
- Capsules
- Functional Powders
Antioxidants Market Segmented by Form:
- Dry Form
- Powder
- Granules
- Liquid Form
- Solutions
- Emulsions
Antioxidants Market Segmented by Source:
- Plant Based Sources
- Fruits and Vegetables
- Herbs and Spices
- Animal Based Sources
- Meat Derived Ingredients
- Dairy Derived Ingredients
- Chemical Sources
- Petrochemical Derived Antioxidants
Antioxidants Market Segmented by End Use:
- Food Industry
- Processed Food Manufacturers
- Beverage Companies
- Healthcare Industry
- Pharmaceutical Companies
- Nutraceutical Companies
- Cosmetics Industry
- Personal Care Brands
- Beauty Product Manufacturers
- Agriculture Industry
- Animal Nutrition Companies
- Feed Producers
Antioxidants Market Segmented by Function:
- Preservatives
- Oxidation Inhibition
- Shelf Life Enhancement
- Nutritional Additives
- Functional Ingredients
- Health Supplements
- Color Stabilizers
- Pigment Protection
Antioxidants Market by Region:
- North America
- USA
- Canada
- Mexico
- Latin America
- Brazil
- Chile
- Rest of Latin America
- Western Europe
- Germany
- UK
- Italy
- Spain
- France
- Nordic
- BENELUX
- Rest of Western Europe
- Eastern Europe
- Russia
- Poland
- Hungary
- Balkan & Baltic
- Rest of Eastern Europe
- East Asia
- China
- Japan
- South Korea
- South Asia and Pacific
- India
- ASEAN
- Australia & New Zealand
- Rest of South Asia and Pacific
- Middle East & Africa
- Kingdom of Saudi Arabia
- Other GCC Countries
- Türkiye
- South Africa
- Other African Union
- Rest of Middle East & Africa
Research Sources and Bibliography
- World Bank. (2026, March). World development indicators database.
- International Trade Centre. (2025, November). Trade statistics for international business development.
- OECD. (2026, February). Economic outlook and industry statistics.
- Food and Agriculture Organization. (2025, October). FAOSTAT food and agriculture data.
- European Food Safety Authority. (2026, January). Scientific outputs and data.
This bibliography is provided for reader reference and is not exhaustive.
This Report Answers
- Market size estimates for 2026 and forecasts through 2036 for the antioxidants market.
- Segment demand across product type and application with leading sub-segment shares.
- Country-level growth analysis covering USA, China, India, Germany and other markets.
- Company positioning across BASF SE, Koninklijke DSM N.V. and Kemin Industries and regional players.
- Assessment of drivers and restraints with procurement patterns across end-use buyers.
Frequently Asked Questions
What is driving growth in the antioxidants market?
Growth is supported by demand that recurs rather than repeats once. Food Industry sustains natural antioxidants demand through replacement and capacity additions, keeping procurement recurring across the forecast period. Buyers are consolidating around Natural Antioxidants to control cost and qualification effort.
What is the upside case in the antioxidants market?
Suppliers offering food products configurations that drop into existing workflows can widen adoption without full replacement. That widens adoption without forcing a full replacement cycle, which is the slowest part of any buying decision.
What can limit return on investment for buyers?
Return on investment weakens when antioxidants performance, documentation or channel acceptance is not proven before rollout. Certification and requalification effort for new product type specifications slows substitution, particularly for smaller buyers with limited engineering capacity. Requalification, rework and substitution costs can erase the planned margin gain.
What should buyers assess when shortlisting suppliers?
Procurement leaders should evaluate specification evidence, second-source availability, service response, price discipline and fit with product type requirements across food industry, healthcare industry, cosmetics industry and agriculture industry.
Why should executives track the Antioxidants Market?
Executives should track the market because Natural Antioxidants decisions affect access to food products, beverages, pet food - animal feed and cosmetic & personal care products, qualification effort and continuity of supply. Those points influence margin and switching risk.
Table of Content
- Key Takeaways
- Market Size and CAGR
- Top Growth Driver
- Fastest Growing Segment
- Leading Region
- Key Companies
- Emerging Opportunities
- Executive Summary
- Global Market Outlook
- Demand-side Trends
- Supply-side Trends
- Technology Roadmap Analysis
- Analysis and Recommendations
- Analyst Perspective (What is happening? Why now? What should investors know?)
- Key Questions Answered
- How large is the market?
- What is the CAGR?
- What are key trends?
- Which region dominates?
- Who are the leaders?
- Market Overview
- Market Coverage / Taxonomy
- Market Definition / Scope / Limitations
- Research Methodology
- Chapter Orientation
- Analytical Lens and Working Hypotheses
- Market Structure, Signals, and Trend Drivers
- Benchmarking and Cross-market Comparability
- Market Sizing, Forecasting, and Opportunity Mapping
- Research Design and Evidence Framework
- Desk Research Programme (Secondary Evidence)
- Expert Input and Fieldwork (Primary Evidence)
- Tooling, Models, and Reference Databases
- Data Engineering and Model Build
- Quality Assurance and Audit Trail
- Market Background
- Market Dynamics (Drivers, Restraints, Opportunity, Trends)
- Scenario Forecast (Optimistic, Likely, Conservative)
- Impact Analysis
- AI Impact
- Sustainability Impact
- Regulatory Impact
- Technology Impact
- Consumer / Buyer Analysis
- Purchase Drivers
- Adoption Barriers
- Buyer Journey
- Opportunity Map Analysis
- Product Life Cycle Analysis
- Supply Chain Analysis
- Investment Feasibility Matrix
- Value Chain Analysis
- PESTLE and Porter's Analysis
- Regulatory Landscape
- Regional Parent Market Outlook
- Production and Consumption Statistics
- Import and Export Statistics
- Global Market Analysis and Forecast, 2021 to 2036
- Historical Market Size Value (USD Billion) Analysis, 2021 to 2025
- Current and Future Market Size Value (USD Billion) Projections, 2026 to 2036
- Y-o-Y Growth Trend Analysis
- Absolute $ Opportunity Analysis
- Global Market Pricing Analysis, 2021 to 2036
- Global Market Analysis and Forecast, By Product Type, 2021 to 2036
- Introduction / Key Findings
- Historical Market Size Value (USD Billion) Analysis By Product Type, 2021 to 2025
- Current and Future Market Size Value (USD Billion) Analysis and Forecast By Product Type, 2026 to 2036
- Natural Antioxidants
- Vitamin C
- Vitamin E
- Carotenoids
- Polyphenols
- Synthetic Antioxidants
- Butylated Hydroxyanisole
- Butylated Hydroxytoluene
- Tert Butylhydroquinone
- Propyl Gallate
- Natural Antioxidants
- Y-o-Y Growth Trend Analysis By Product Type, 2021 to 2025
- Absolute $ Opportunity Analysis By Product Type, 2026 to 2036
- Global Market Analysis and Forecast, By Application, 2021 to 2036
- Introduction / Key Findings
- Historical Market Size Value (USD Billion) Analysis By Application, 2021 to 2025
- Current and Future Market Size Value (USD Billion) Analysis and Forecast By Application, 2026 to 2036
- Food Products
- Fats and Oils Stabilization
- Packaged Food Preservation
- Beverages
- Beverage Fortification
- Pet Food - Animal Feed
- Livestock Feed
- Pet Food
- Cosmetic & Personal Care Products
- Skin Care Products
- Hair Care Products
- Pharmaceuticals
- Formulation Stabilization
- Therapeutic Applications
- Dietary Supplements
- Tablets
- Capsules
- Functional Powders
- Food Products
- Y-o-Y Growth Trend Analysis By Application, 2021 to 2025
- Absolute $ Opportunity Analysis By Application, 2026 to 2036
- Global Market Analysis and Forecast, By Form, 2021 to 2036
- Introduction / Key Findings
- Historical Market Size Value (USD Billion) Analysis By Form, 2021 to 2025
- Current and Future Market Size Value (USD Billion) Analysis and Forecast By Form, 2026 to 2036
- Dry Form
- Powder
- Granules
- Liquid Form
- Solutions
- Emulsions
- Dry Form
- Y-o-Y Growth Trend Analysis By Form, 2021 to 2025
- Absolute $ Opportunity Analysis By Form, 2026 to 2036
- Global Market Analysis and Forecast, By Source, 2021 to 2036
- Introduction / Key Findings
- Historical Market Size Value (USD Billion) Analysis By Source, 2021 to 2025
- Current and Future Market Size Value (USD Billion) Analysis and Forecast By Source, 2026 to 2036
- Plant Based Sources
- Fruits and Vegetables
- Herbs and Spices
- Animal Based Sources
- Meat Derived Ingredients
- Dairy Derived Ingredients
- Chemical Sources
- Petrochemical Derived Antioxidants
- Plant Based Sources
- Y-o-Y Growth Trend Analysis By Source, 2021 to 2025
- Absolute $ Opportunity Analysis By Source, 2026 to 2036
- Global Market Analysis and Forecast, By End Use, 2021 to 2036
- Introduction / Key Findings
- Historical Market Size Value (USD Billion) Analysis By End Use, 2021 to 2025
- Current and Future Market Size Value (USD Billion) Analysis and Forecast By End Use, 2026 to 2036
- Food Industry
- Processed Food Manufacturers
- Beverage Companies
- Healthcare Industry
- Pharmaceutical Companies
- Nutraceutical Companies
- Cosmetics Industry
- Personal Care Brands
- Beauty Product Manufacturers
- Agriculture Industry
- Animal Nutrition Companies
- Feed Producers
- Food Industry
- Y-o-Y Growth Trend Analysis By End Use, 2021 to 2025
- Absolute $ Opportunity Analysis By End Use, 2026 to 2036
- Global Market Analysis and Forecast, By Function
- Introduction / Key Findings
- Historical Market Size Value (USD Billion) Analysis By Function, 2021 to 2025
- Current and Future Market Size Value (USD Billion) Analysis and Forecast By Function, 2026 to 2036
- Preservatives
- Oxidation Inhibition
- Shelf Life Enhancement
- Nutritional Additives
- Functional Ingredients
- Health Supplements
- Color Stabilizers
- Pigment Protection
- Preservatives
- Y-o-Y Growth Trend Analysis By Function, 2021 to 2025
- Absolute $ Opportunity Analysis By Function, 2026 to 2036
- Global Market Analysis and Forecast, By Region, 2021 to 2036
- Introduction
- Historical Market Size Value (USD Billion) Analysis By Region, 2021 to 2025
- Current Market Size Value (USD Billion) Analysis and Forecast By Region, 2026 to 2036
- North America
- Latin America
- Western Europe
- Eastern Europe
- East Asia
- South Asia and Pacific
- Middle East and Africa
- Market Attractiveness Analysis By Region
- North America Market Analysis and Forecast, By Country, 2021 to 2036
- Historical Market Size Value (USD Billion) Trend Analysis By Market Taxonomy, 2021 to 2025
- Market Size Value (USD Billion) Forecast By Market Taxonomy, 2026 to 2036
- By Country
- USA
- Canada
- By Product Type
- By Application
- By Form
- By Source
- By End Use
- By Function
- By Country
- Market Attractiveness Analysis
- By Country
- By Product Type
- By Application
- By Form
- By Source
- By End Use
- By Function
- Key Takeaways
- Latin America Market Analysis and Forecast, By Country
- Historical Market Size Value (USD Billion) Trend Analysis By Market Taxonomy, 2021 to 2025
- Market Size Value (USD Billion) Forecast By Market Taxonomy, 2026 to 2036
- By Country
- Brazil
- Mexico
- Chile
- Rest of Latin America
- By Product Type
- By Application
- By Form
- By Source
- By End Use
- By Function
- By Country
- Market Attractiveness Analysis
- By Country
- By Product Type
- By Application
- By Form
- By Source
- By End Use
- By Function
- Key Takeaways
- Western Europe Market Analysis and Forecast, By Country
- Historical Market Size Value (USD Billion) Trend Analysis By Market Taxonomy, 2021 to 2025
- Market Size Value (USD Billion) Forecast By Market Taxonomy, 2026 to 2036
- By Country
- Germany
- UK
- Italy
- Spain
- France
- Nordic
- BENELUX
- Rest of Western Europe
- By Product Type
- By Application
- By Form
- By Source
- By End Use
- By Function
- By Country
- Market Attractiveness Analysis
- By Country
- By Product Type
- By Application
- By Form
- By Source
- By End Use
- By Function
- Key Takeaways
- Eastern Europe Market Analysis and Forecast, By Country
- Historical Market Size Value (USD Billion) Trend Analysis By Market Taxonomy, 2021 to 2025
- Market Size Value (USD Billion) Forecast By Market Taxonomy, 2026 to 2036
- By Country
- Russia
- Poland
- Hungary
- Balkan & Baltic
- Rest of Eastern Europe
- By Product Type
- By Application
- By Form
- By Source
- By End Use
- By Function
- By Country
- Market Attractiveness Analysis
- By Country
- By Product Type
- By Application
- By Form
- By Source
- By End Use
- By Function
- Key Takeaways
- East Asia Market Analysis and Forecast, By Country
- Historical Market Size Value (USD Billion) Trend Analysis By Market Taxonomy, 2021 to 2025
- Market Size Value (USD Billion) Forecast By Market Taxonomy, 2026 to 2036
- By Country
- China
- Japan
- South Korea
- By Product Type
- By Application
- By Form
- By Source
- By End Use
- By Function
- By Country
- Market Attractiveness Analysis
- By Country
- By Product Type
- By Application
- By Form
- By Source
- By End Use
- By Function
- Key Takeaways
- South Asia and Pacific Market Analysis and Forecast, By Country
- Historical Market Size Value (USD Billion) Trend Analysis By Market Taxonomy, 2021 to 2025
- Market Size Value (USD Billion) Forecast By Market Taxonomy, 2026 to 2036
- By Country
- India
- ASEAN
- Australia & New Zealand
- Rest of South Asia and Pacific
- By Product Type
- By Application
- By Form
- By Source
- By End Use
- By Function
- By Country
- Market Attractiveness Analysis
- By Country
- By Product Type
- By Application
- By Form
- By Source
- By End Use
- By Function
- Key Takeaways
- Middle East and Africa Market Analysis and Forecast, By Country
- Historical Market Size Value (USD Billion) Trend Analysis By Market Taxonomy, 2021 to 2025
- Market Size Value (USD Billion) Forecast By Market Taxonomy, 2026 to 2036
- By Country
- Kingdom of Saudi Arabia
- Other GCC Countries
- Türkiye
- South Africa
- Other African Union
- Rest of Middle East and Africa
- By Product Type
- By Application
- By Form
- By Source
- By End Use
- By Function
- By Country
- Market Attractiveness Analysis
- By Country
- By Product Type
- By Application
- By Form
- By Source
- By End Use
- By Function
- Key Takeaways
- Key Countries Market Analysis
- USA
- Pricing Analysis
- Market Share Analysis, 2025
- By Product Type
- By Application
- By Form
- By Source
- By End Use
- By Function
- Canada
- Pricing Analysis
- Market Share Analysis, 2025
- By Product Type
- By Application
- By Form
- By Source
- By End Use
- By Function
- Mexico
- Pricing Analysis
- Market Share Analysis, 2025
- By Product Type
- By Application
- By Form
- By Source
- By End Use
- By Function
- Brazil
- Pricing Analysis
- Market Share Analysis, 2025
- By Product Type
- By Application
- By Form
- By Source
- By End Use
- By Function
- Chile
- Pricing Analysis
- Market Share Analysis, 2025
- By Product Type
- By Application
- By Form
- By Source
- By End Use
- By Function
- Germany
- Pricing Analysis
- Market Share Analysis, 2025
- By Product Type
- By Application
- By Form
- By Source
- By End Use
- By Function
- UK
- Pricing Analysis
- Market Share Analysis, 2025
- By Product Type
- By Application
- By Form
- By Source
- By End Use
- By Function
- Italy
- Pricing Analysis
- Market Share Analysis, 2025
- By Product Type
- By Application
- By Form
- By Source
- By End Use
- By Function
- Spain
- Pricing Analysis
- Market Share Analysis, 2025
- By Product Type
- By Application
- By Form
- By Source
- By End Use
- By Function
- France
- Pricing Analysis
- Market Share Analysis, 2025
- By Product Type
- By Application
- By Form
- By Source
- By End Use
- By Function
- India
- Pricing Analysis
- Market Share Analysis, 2025
- By Product Type
- By Application
- By Form
- By Source
- By End Use
- By Function
- ASEAN
- Pricing Analysis
- Market Share Analysis, 2025
- By Product Type
- By Application
- By Form
- By Source
- By End Use
- By Function
- Australia & New Zealand
- Pricing Analysis
- Market Share Analysis, 2025
- By Product Type
- By Application
- By Form
- By Source
- By End Use
- By Function
- China
- Pricing Analysis
- Market Share Analysis, 2025
- By Product Type
- By Application
- By Form
- By Source
- By End Use
- By Function
- Japan
- Pricing Analysis
- Market Share Analysis, 2025
- By Product Type
- By Application
- By Form
- By Source
- By End Use
- By Function
- South Korea
- Pricing Analysis
- Market Share Analysis, 2025
- By Product Type
- By Application
- By Form
- By Source
- By End Use
- By Function
- Russia
- Pricing Analysis
- Market Share Analysis, 2025
- By Product Type
- By Application
- By Form
- By Source
- By End Use
- By Function
- Poland
- Pricing Analysis
- Market Share Analysis, 2025
- By Product Type
- By Application
- By Form
- By Source
- By End Use
- By Function
- Hungary
- Pricing Analysis
- Market Share Analysis, 2025
- By Product Type
- By Application
- By Form
- By Source
- By End Use
- By Function
- Kingdom of Saudi Arabia
- Pricing Analysis
- Market Share Analysis, 2025
- By Product Type
- By Application
- By Form
- By Source
- By End Use
- By Function
- Türkiye
- Pricing Analysis
- Market Share Analysis, 2025
- By Product Type
- By Application
- By Form
- By Source
- By End Use
- By Function
- South Africa
- Pricing Analysis
- Market Share Analysis, 2025
- By Product Type
- By Application
- By Form
- By Source
- By End Use
- By Function
- USA
- Market Structure Analysis
- Competition Dashboard
- Competition Benchmarking
- Market Share Analysis of Top Players
- By Regional
- By Product Type
- By Application
- By Form
- By Source
- By End Use
- By Function
- Emerging Startups
- Innovation Benchmarking
- Competition Analysis
- Competition Deep Dive
- Case Studies
- Success Stories
- Recent Developments
- Competition Deep Dive
- Assumptions & Acronyms Used
List of Tables
- Table 1: Global Market Value (USD Billion) Forecast by Region, 2021 to 2036
- Table 2: Global Market Value (USD Billion) Forecast by Product Type, 2021 to 2036
- Table 3: Global Market Value (USD Billion) Forecast by Application, 2021 to 2036
- Table 4: Global Market Value (USD Billion) Forecast by Form, 2021 to 2036
- Table 5: Global Market Value (USD Billion) Forecast by Source, 2021 to 2036
- Table 6: Global Market Value (USD Billion) Forecast by End Use, 2021 to 2036
- Table 7: Global Market Value (USD Billion) Forecast by Function, 2021 to 2036
- Table 8: North America Market Value (USD Billion) Forecast by Country, 2021 to 2036
- Table 9: North America Market Value (USD Billion) Forecast by Product Type, 2021 to 2036
- Table 10: North America Market Value (USD Billion) Forecast by Application, 2021 to 2036
- Table 11: North America Market Value (USD Billion) Forecast by Form, 2021 to 2036
- Table 12: North America Market Value (USD Billion) Forecast by Source, 2021 to 2036
- Table 13: North America Market Value (USD Billion) Forecast by End Use, 2021 to 2036
- Table 14: North America Market Value (USD Billion) Forecast by Function, 2021 to 2036
- Table 15: Latin America Market Value (USD Billion) Forecast by Country, 2021 to 2036
- Table 16: Latin America Market Value (USD Billion) Forecast by Product Type, 2021 to 2036
- Table 17: Latin America Market Value (USD Billion) Forecast by Application, 2021 to 2036
- Table 18: Latin America Market Value (USD Billion) Forecast by Form, 2021 to 2036
- Table 19: Latin America Market Value (USD Billion) Forecast by Source, 2021 to 2036
- Table 20: Latin America Market Value (USD Billion) Forecast by End Use, 2021 to 2036
- Table 21: Latin America Market Value (USD Billion) Forecast by Function, 2021 to 2036
- Table 22: Western Europe Market Value (USD Billion) Forecast by Country, 2021 to 2036
- Table 23: Western Europe Market Value (USD Billion) Forecast by Product Type, 2021 to 2036
- Table 24: Western Europe Market Value (USD Billion) Forecast by Application, 2021 to 2036
- Table 25: Western Europe Market Value (USD Billion) Forecast by Form, 2021 to 2036
- Table 26: Western Europe Market Value (USD Billion) Forecast by Source, 2021 to 2036
- Table 27: Western Europe Market Value (USD Billion) Forecast by End Use, 2021 to 2036
- Table 28: Western Europe Market Value (USD Billion) Forecast by Function, 2021 to 2036
- Table 29: Eastern Europe Market Value (USD Billion) Forecast by Country, 2021 to 2036
- Table 30: Eastern Europe Market Value (USD Billion) Forecast by Product Type, 2021 to 2036
- Table 31: Eastern Europe Market Value (USD Billion) Forecast by Application, 2021 to 2036
- Table 32: Eastern Europe Market Value (USD Billion) Forecast by Form, 2021 to 2036
- Table 33: Eastern Europe Market Value (USD Billion) Forecast by Source, 2021 to 2036
- Table 34: Eastern Europe Market Value (USD Billion) Forecast by End Use, 2021 to 2036
- Table 35: Eastern Europe Market Value (USD Billion) Forecast by Function, 2021 to 2036
- Table 36: East Asia Market Value (USD Billion) Forecast by Country, 2021 to 2036
- Table 37: East Asia Market Value (USD Billion) Forecast by Product Type, 2021 to 2036
- Table 38: East Asia Market Value (USD Billion) Forecast by Application, 2021 to 2036
- Table 39: East Asia Market Value (USD Billion) Forecast by Form, 2021 to 2036
- Table 40: East Asia Market Value (USD Billion) Forecast by Source, 2021 to 2036
- Table 41: East Asia Market Value (USD Billion) Forecast by End Use, 2021 to 2036
- Table 42: East Asia Market Value (USD Billion) Forecast by Function, 2021 to 2036
- Table 43: South Asia and Pacific Market Value (USD Billion) Forecast by Country, 2021 to 2036
- Table 44: South Asia and Pacific Market Value (USD Billion) Forecast by Product Type, 2021 to 2036
- Table 45: South Asia and Pacific Market Value (USD Billion) Forecast by Application, 2021 to 2036
- Table 46: South Asia and Pacific Market Value (USD Billion) Forecast by Form, 2021 to 2036
- Table 47: South Asia and Pacific Market Value (USD Billion) Forecast by Source, 2021 to 2036
- Table 48: South Asia and Pacific Market Value (USD Billion) Forecast by End Use, 2021 to 2036
- Table 49: South Asia and Pacific Market Value (USD Billion) Forecast by Function, 2021 to 2036
- Table 50: Middle East and Africa Market Value (USD Billion) Forecast by Country, 2021 to 2036
- Table 51: Middle East and Africa Market Value (USD Billion) Forecast by Product Type, 2021 to 2036
- Table 52: Middle East and Africa Market Value (USD Billion) Forecast by Application, 2021 to 2036
- Table 53: Middle East and Africa Market Value (USD Billion) Forecast by Form, 2021 to 2036
- Table 54: Middle East and Africa Market Value (USD Billion) Forecast by Source, 2021 to 2036
- Table 55: Middle East and Africa Market Value (USD Billion) Forecast by End Use, 2021 to 2036
- Table 56: Middle East and Africa Market Value (USD Billion) Forecast by Function, 2021 to 2036
List of Figures
- Figure 1: Global Market Pricing Analysis
- Figure 2: Global Market Value (USD Billion) Forecast 2021-2036
- Figure 3: Global Market Value Share and BPS Analysis by Product Type, 2026 and 2036
- Figure 4: Global Market Y-o-Y Growth Comparison by Product Type, 2026-2036
- Figure 5: Global Market Attractiveness Analysis by Product Type
- Figure 6: Global Market Value Share and BPS Analysis by Application, 2026 and 2036
- Figure 7: Global Market Y-o-Y Growth Comparison by Application, 2026-2036
- Figure 8: Global Market Attractiveness Analysis by Application
- Figure 9: Global Market Value Share and BPS Analysis by Form, 2026 and 2036
- Figure 10: Global Market Y-o-Y Growth Comparison by Form, 2026-2036
- Figure 11: Global Market Attractiveness Analysis by Form
- Figure 12: Global Market Value Share and BPS Analysis by Source, 2026 and 2036
- Figure 13: Global Market Y-o-Y Growth Comparison by Source, 2026-2036
- Figure 14: Global Market Attractiveness Analysis by Source
- Figure 15: Global Market Value Share and BPS Analysis by End Use, 2026 and 2036
- Figure 16: Global Market Y-o-Y Growth Comparison by End Use, 2026-2036
- Figure 17: Global Market Attractiveness Analysis by End Use
- Figure 18: Global Market Value Share and BPS Analysis by Function, 2026 and 2036
- Figure 19: Global Market Y-o-Y Growth Comparison by Function, 2026-2036
- Figure 20: Global Market Attractiveness Analysis by Function
- Figure 21: Global Market Value (USD Billion) Share and BPS Analysis by Region, 2026 and 2036
- Figure 22: Global Market Y-o-Y Growth Comparison by Region, 2026-2036
- Figure 23: Global Market Attractiveness Analysis by Region
- Figure 24: North America Market Incremental Dollar Opportunity, 2026-2036
- Figure 25: Latin America Market Incremental Dollar Opportunity, 2026-2036
- Figure 26: Western Europe Market Incremental Dollar Opportunity, 2026-2036
- Figure 27: Eastern Europe Market Incremental Dollar Opportunity, 2026-2036
- Figure 28: East Asia Market Incremental Dollar Opportunity, 2026-2036
- Figure 29: South Asia and Pacific Market Incremental Dollar Opportunity, 2026-2036
- Figure 30: Middle East and Africa Market Incremental Dollar Opportunity, 2026-2036
- Figure 31: North America Market Value Share and BPS Analysis by Country, 2026 and 2036
- Figure 32: North America Market Value Share and BPS Analysis by Product Type, 2026 and 2036
- Figure 33: North America Market Y-o-Y Growth Comparison by Product Type, 2026-2036
- Figure 34: North America Market Attractiveness Analysis by Product Type
- Figure 35: North America Market Value Share and BPS Analysis by Application, 2026 and 2036
- Figure 36: North America Market Y-o-Y Growth Comparison by Application, 2026-2036
- Figure 37: North America Market Attractiveness Analysis by Application
- Figure 38: North America Market Value Share and BPS Analysis by Form, 2026 and 2036
- Figure 39: North America Market Y-o-Y Growth Comparison by Form, 2026-2036
- Figure 40: North America Market Attractiveness Analysis by Form
- Figure 41: North America Market Value Share and BPS Analysis by Source, 2026 and 2036
- Figure 42: North America Market Y-o-Y Growth Comparison by Source, 2026-2036
- Figure 43: North America Market Attractiveness Analysis by Source
- Figure 44: North America Market Value Share and BPS Analysis by End Use, 2026 and 2036
- Figure 45: North America Market Y-o-Y Growth Comparison by End Use, 2026-2036
- Figure 46: North America Market Attractiveness Analysis by End Use
- Figure 47: North America Market Value Share and BPS Analysis by Function, 2026 and 2036
- Figure 48: North America Market Y-o-Y Growth Comparison by Function, 2026-2036
- Figure 49: North America Market Attractiveness Analysis by Function
- Figure 50: Latin America Market Value Share and BPS Analysis by Country, 2026 and 2036
- Figure 51: Latin America Market Value Share and BPS Analysis by Product Type, 2026 and 2036
- Figure 52: Latin America Market Y-o-Y Growth Comparison by Product Type, 2026-2036
- Figure 53: Latin America Market Attractiveness Analysis by Product Type
- Figure 54: Latin America Market Value Share and BPS Analysis by Application, 2026 and 2036
- Figure 55: Latin America Market Y-o-Y Growth Comparison by Application, 2026-2036
- Figure 56: Latin America Market Attractiveness Analysis by Application
- Figure 57: Latin America Market Value Share and BPS Analysis by Form, 2026 and 2036
- Figure 58: Latin America Market Y-o-Y Growth Comparison by Form, 2026-2036
- Figure 59: Latin America Market Attractiveness Analysis by Form
- Figure 60: Latin America Market Value Share and BPS Analysis by Source, 2026 and 2036
- Figure 61: Latin America Market Y-o-Y Growth Comparison by Source, 2026-2036
- Figure 62: Latin America Market Attractiveness Analysis by Source
- Figure 63: Latin America Market Value Share and BPS Analysis by End Use, 2026 and 2036
- Figure 64: Latin America Market Y-o-Y Growth Comparison by End Use, 2026-2036
- Figure 65: Latin America Market Attractiveness Analysis by End Use
- Figure 66: Latin America Market Value Share and BPS Analysis by Function, 2026 and 2036
- Figure 67: Latin America Market Y-o-Y Growth Comparison by Function, 2026-2036
- Figure 68: Latin America Market Attractiveness Analysis by Function
- Figure 69: Western Europe Market Value Share and BPS Analysis by Country, 2026 and 2036
- Figure 70: Western Europe Market Value Share and BPS Analysis by Product Type, 2026 and 2036
- Figure 71: Western Europe Market Y-o-Y Growth Comparison by Product Type, 2026-2036
- Figure 72: Western Europe Market Attractiveness Analysis by Product Type
- Figure 73: Western Europe Market Value Share and BPS Analysis by Application, 2026 and 2036
- Figure 74: Western Europe Market Y-o-Y Growth Comparison by Application, 2026-2036
- Figure 75: Western Europe Market Attractiveness Analysis by Application
- Figure 76: Western Europe Market Value Share and BPS Analysis by Form, 2026 and 2036
- Figure 77: Western Europe Market Y-o-Y Growth Comparison by Form, 2026-2036
- Figure 78: Western Europe Market Attractiveness Analysis by Form
- Figure 79: Western Europe Market Value Share and BPS Analysis by Source, 2026 and 2036
- Figure 80: Western Europe Market Y-o-Y Growth Comparison by Source, 2026-2036
- Figure 81: Western Europe Market Attractiveness Analysis by Source
- Figure 82: Western Europe Market Value Share and BPS Analysis by End Use, 2026 and 2036
- Figure 83: Western Europe Market Y-o-Y Growth Comparison by End Use, 2026-2036
- Figure 84: Western Europe Market Attractiveness Analysis by End Use
- Figure 85: Western Europe Market Value Share and BPS Analysis by Function, 2026 and 2036
- Figure 86: Western Europe Market Y-o-Y Growth Comparison by Function, 2026-2036
- Figure 87: Western Europe Market Attractiveness Analysis by Function
- Figure 88: Eastern Europe Market Value Share and BPS Analysis by Country, 2026 and 2036
- Figure 89: Eastern Europe Market Value Share and BPS Analysis by Product Type, 2026 and 2036
- Figure 90: Eastern Europe Market Y-o-Y Growth Comparison by Product Type, 2026-2036
- Figure 91: Eastern Europe Market Attractiveness Analysis by Product Type
- Figure 92: Eastern Europe Market Value Share and BPS Analysis by Application, 2026 and 2036
- Figure 93: Eastern Europe Market Y-o-Y Growth Comparison by Application, 2026-2036
- Figure 94: Eastern Europe Market Attractiveness Analysis by Application
- Figure 95: Eastern Europe Market Value Share and BPS Analysis by Form, 2026 and 2036
- Figure 96: Eastern Europe Market Y-o-Y Growth Comparison by Form, 2026-2036
- Figure 97: Eastern Europe Market Attractiveness Analysis by Form
- Figure 98: Eastern Europe Market Value Share and BPS Analysis by Source, 2026 and 2036
- Figure 99: Eastern Europe Market Y-o-Y Growth Comparison by Source, 2026-2036
- Figure 100: Eastern Europe Market Attractiveness Analysis by Source
- Figure 101: Eastern Europe Market Value Share and BPS Analysis by End Use, 2026 and 2036
- Figure 102: Eastern Europe Market Y-o-Y Growth Comparison by End Use, 2026-2036
- Figure 103: Eastern Europe Market Attractiveness Analysis by End Use
- Figure 104: Eastern Europe Market Value Share and BPS Analysis by Function, 2026 and 2036
- Figure 105: Eastern Europe Market Y-o-Y Growth Comparison by Function, 2026-2036
- Figure 106: Eastern Europe Market Attractiveness Analysis by Function
- Figure 107: East Asia Market Value Share and BPS Analysis by Country, 2026 and 2036
- Figure 108: East Asia Market Value Share and BPS Analysis by Product Type, 2026 and 2036
- Figure 109: East Asia Market Y-o-Y Growth Comparison by Product Type, 2026-2036
- Figure 110: East Asia Market Attractiveness Analysis by Product Type
- Figure 111: East Asia Market Value Share and BPS Analysis by Application, 2026 and 2036
- Figure 112: East Asia Market Y-o-Y Growth Comparison by Application, 2026-2036
- Figure 113: East Asia Market Attractiveness Analysis by Application
- Figure 114: East Asia Market Value Share and BPS Analysis by Form, 2026 and 2036
- Figure 115: East Asia Market Y-o-Y Growth Comparison by Form, 2026-2036
- Figure 116: East Asia Market Attractiveness Analysis by Form
- Figure 117: East Asia Market Value Share and BPS Analysis by Source, 2026 and 2036
- Figure 118: East Asia Market Y-o-Y Growth Comparison by Source, 2026-2036
- Figure 119: East Asia Market Attractiveness Analysis by Source
- Figure 120: East Asia Market Value Share and BPS Analysis by End Use, 2026 and 2036
- Figure 121: East Asia Market Y-o-Y Growth Comparison by End Use, 2026-2036
- Figure 122: East Asia Market Attractiveness Analysis by End Use
- Figure 123: East Asia Market Value Share and BPS Analysis by Function, 2026 and 2036
- Figure 124: East Asia Market Y-o-Y Growth Comparison by Function, 2026-2036
- Figure 125: East Asia Market Attractiveness Analysis by Function
- Figure 126: South Asia and Pacific Market Value Share and BPS Analysis by Country, 2026 and 2036
- Figure 127: South Asia and Pacific Market Value Share and BPS Analysis by Product Type, 2026 and 2036
- Figure 128: South Asia and Pacific Market Y-o-Y Growth Comparison by Product Type, 2026-2036
- Figure 129: South Asia and Pacific Market Attractiveness Analysis by Product Type
- Figure 130: South Asia and Pacific Market Value Share and BPS Analysis by Application, 2026 and 2036
- Figure 131: South Asia and Pacific Market Y-o-Y Growth Comparison by Application, 2026-2036
- Figure 132: South Asia and Pacific Market Attractiveness Analysis by Application
- Figure 133: South Asia and Pacific Market Value Share and BPS Analysis by Form, 2026 and 2036
- Figure 134: South Asia and Pacific Market Y-o-Y Growth Comparison by Form, 2026-2036
- Figure 135: South Asia and Pacific Market Attractiveness Analysis by Form
- Figure 136: South Asia and Pacific Market Value Share and BPS Analysis by Source, 2026 and 2036
- Figure 137: South Asia and Pacific Market Y-o-Y Growth Comparison by Source, 2026-2036
- Figure 138: South Asia and Pacific Market Attractiveness Analysis by Source
- Figure 139: South Asia and Pacific Market Value Share and BPS Analysis by End Use, 2026 and 2036
- Figure 140: South Asia and Pacific Market Y-o-Y Growth Comparison by End Use, 2026-2036
- Figure 141: South Asia and Pacific Market Attractiveness Analysis by End Use
- Figure 142: South Asia and Pacific Market Value Share and BPS Analysis by Function, 2026 and 2036
- Figure 143: South Asia and Pacific Market Y-o-Y Growth Comparison by Function, 2026-2036
- Figure 144: South Asia and Pacific Market Attractiveness Analysis by Function
- Figure 145: Middle East and Africa Market Value Share and BPS Analysis by Country, 2026 and 2036
- Figure 146: Middle East and Africa Market Value Share and BPS Analysis by Product Type, 2026 and 2036
- Figure 147: Middle East and Africa Market Y-o-Y Growth Comparison by Product Type, 2026-2036
- Figure 148: Middle East and Africa Market Attractiveness Analysis by Product Type
- Figure 149: Middle East and Africa Market Value Share and BPS Analysis by Application, 2026 and 2036
- Figure 150: Middle East and Africa Market Y-o-Y Growth Comparison by Application, 2026-2036
- Figure 151: Middle East and Africa Market Attractiveness Analysis by Application
- Figure 152: Middle East and Africa Market Value Share and BPS Analysis by Form, 2026 and 2036
- Figure 153: Middle East and Africa Market Y-o-Y Growth Comparison by Form, 2026-2036
- Figure 154: Middle East and Africa Market Attractiveness Analysis by Form
- Figure 155: Middle East and Africa Market Value Share and BPS Analysis by Source, 2026 and 2036
- Figure 156: Middle East and Africa Market Y-o-Y Growth Comparison by Source, 2026-2036
- Figure 157: Middle East and Africa Market Attractiveness Analysis by Source
- Figure 158: Middle East and Africa Market Value Share and BPS Analysis by End Use, 2026 and 2036
- Figure 159: Middle East and Africa Market Y-o-Y Growth Comparison by End Use, 2026-2036
- Figure 160: Middle East and Africa Market Attractiveness Analysis by End Use
- Figure 161: Middle East and Africa Market Value Share and BPS Analysis by Function, 2026 and 2036
- Figure 162: Middle East and Africa Market Y-o-Y Growth Comparison by Function, 2026-2036
- Figure 163: Middle East and Africa Market Attractiveness Analysis by Function
- Figure 164: Global Market - Tier Structure Analysis
- Figure 165: Global Market - Company Share Analysis


