Apple Cider Vinegar Market Size and Share Forecast Outlook 2025 to 2035

The global apple cider vinegar market is projected to grow from USD 723.5 million in 2025 to USD 1,259.5 million by 2035, registering a CAGR of 5.7%.
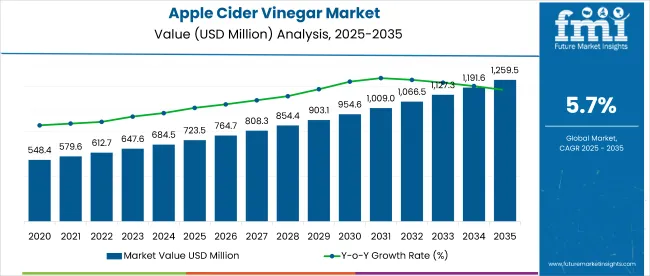
Quick Stats - Apple Cider Vinegar Market

  • Market Value (2025): USD 723.5 million
  • Forecast Value (2035): USD 1,259.5 million
  • Forecast CAGR: 5.7%
  • Distribution Channel Leader in 2025: Supermarkets or Hypermarkets (39.6% market share)
  • Top Application Segment: Food & Beverage (43.6% share)
  • Key Growth Region: East Asia (Japan is the fastest-growing market with a 6.2% CAGR)

Apple Cider Vinegar Market

Metric Value
Industry Size (2025E) USD 723.5 million
Industry Value (2035F) USD 1,259.5 million
CAGR (2025 to 2035) 5.7%

The market expansion is being driven by increasing health-consciousness, rising demand for natural and organic products, and the growing use of apple cider vinegar in various food and beverage applications. Additionally, the growing adoption of apple cider vinegar in wellness products, such as skin and hair care formulations, is fueling market growth. Consumer awareness of the health benefits of apple cider vinegar, including its potential to support weight loss, regulate blood sugar, and improve digestion, is contributing to its widespread consumption.

The market holds a significant share in several related markets. Within the food and beverage market, it holds 0.5-1%, reflecting its wide use in cooking, dressings, and beverages. In the functional food ingredients market, it contributes around 1-2% as consumers seek health benefits like improved digestion and weight loss. In the health and wellness market, the share is around 0.5-1% due to its use in wellness products.

In the organic food market, the share is increasing, reaching 1-2%, driven by demand for natural ingredients. However, in the personal care and cosmetics and dietary supplements market, its share remains smaller, around 0.1-0.5%.

Government regulations impacting the market focus on food safety, quality standards, and labeling. In countries like the USA, the Food and Drug Administration (FDA) regulates the labeling and safety of apple cider vinegar, ensuring product quality and transparency for consumers.

In Europe, the European Food Safety Authority (EFSA) provides guidance on health claims related to apple cider vinegar, particularly those related to digestive health and weight management. These regulations drive the market toward better quality control and production standards, ensuring that apple cider vinegar products meet both safety and health expectations.

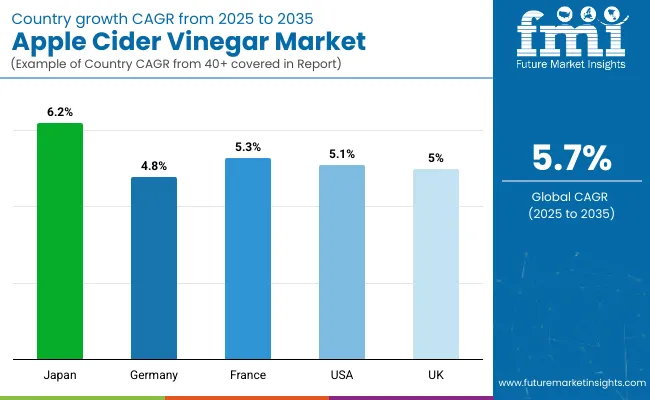
The Japan market is projected to be the fastest-growing in the market, expected to expand at a CAGR of 6.2% from 2025 to 2035. Supermarkets/hypermarkets will lead the distribution channel segment with a 39.6% share, while the food & beverage will dominate the application segment with a 43.6% share. The USA, UK, Germany, and France are also expected to grow steadily, with CAGRs of 5.1%, 5%, 5.3%, and 5.3%, respectively.

Analyzing Apple Cider Vinegar Market by Top Investment Segments

The market is segmented by application, distribution channel, and region. By application, the market is divided into food & beverages, pharmaceuticals, personal care, and household & industrial applications. In terms of distribution channel, the market is classified into supermarkets/hypermarkets, drug stores, convenience stores, specialist stores, and retail stores. Regionally, the market is classified into North America, Latin America, Western Europe, Eastern Europe, South Asia & Pacific, East Asia, and the Middle East & Africa.
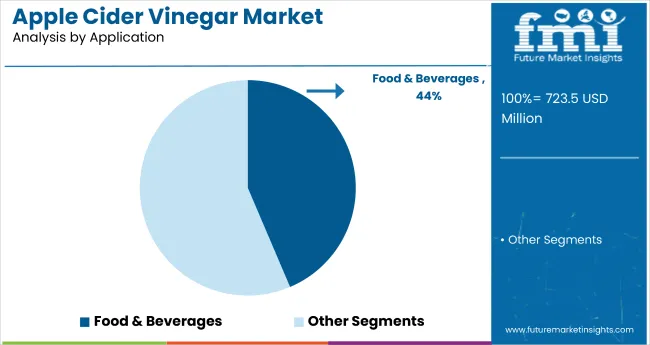
Food & Beverages to Lead the Application Segment with 43.6% Market Share

Apple Cider Vinegar Market Analysis By Application

The food & beverages are expected to dominate the application segment, holding 43.6% of the market share by 2025, driven by its extensive use in food preparations, dressings, sauces, and drinks, along with growing health trends.
  • Apple cider vinegar is widely used in food preparation, including dressings, sauces, and beverages, driving its demand in this sector.
  • The increasing popularity of healthy and organic food products will continue to drive growth in this segment.

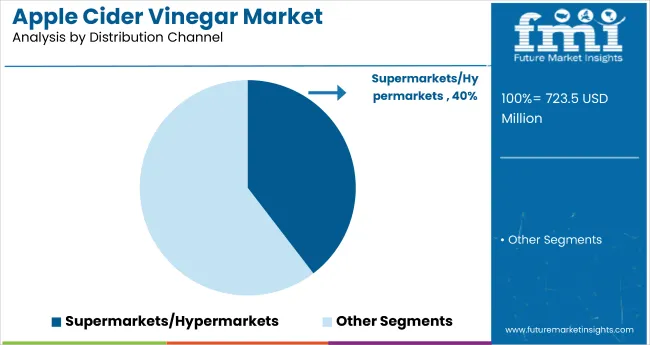
Supermarkets/Hypermarkets to Capture the Distribution Channel with 39.6% Market Share

Apple Cider Vinegar Market Analysis By Distribution Channel

Supermarkets and hypermarkets are projected to lead the distribution channel segment, accounting for 39.6% of the market share by 2025, due to their widespread reach, convenience, and availability of apple cider vinegar products.

  • These retail outlets remain the primary point of sale for apple cider vinegar, offering convenience for consumers to purchase the product.
  • Their wide geographical reach and product availability make them the preferred choice for buyers.

Top Apple Cider Vinegar Market Dynamics

The global apple cider vinegar market is experiencing steady growth, driven by increasing consumer demand for health-conscious, natural products. Apple cider vinegar is widely recognized for its health benefits, including weight management, digestive health, and skin care.

Recent Trends in the Apple Cider Vinegar Market

  • The rise of organic and natural food trends is significantly boosting the demand for pure, unfiltered apple cider vinegar, as consumers become more health-conscious.
  • Apple cider vinegar's growing use in wellness products, such as dietary supplements and skincare, is expanding its market presence.

Challenges in the Apple Cider Vinegar Market
  • The premium pricing of organic apple cider vinegar and its variants limits its accessibility for price-sensitive consumers.
  • Variations in taste, quality, and production methods create challenges for manufacturers in maintaining consistency and meeting diverse consumer preferences.

Top Countries Producing, Regulating, and Driving the Demand for Apple Cider Vinegar

Country Wise Analysis Of Apple Cider Vinegar Market

Countries CAGR (2025 to 2035)
Japan 6.2%
Germany 4.8%
France 5.3%
USA 5.1%
UK 5.0%

Japan’s momentum is driven by the country’s high focus on health and wellness, combined with the growing preference for organic and natural products. Germany and France maintain strong demand, supported by EU regulations promoting organic food and sustainability. Meanwhile, developed economies like the USA (5.1% CAGR), UK (5.3%), and Japan (6.2%) are expected to expand at a steady pace, in line with the global growth rate.

Japan leads in the market with the highest growth, driven by its strong focus on functional food ingredients, wellness, and natural remedies. Germany and France follow closely, benefiting from EU regulations that promote organic food products and sustainability, fostering increasing demand for apple cider vinegar in health-conscious consumers.

The USA also experiences significant growth, fueled by rising demand for wellness supplements, health foods, and beverages, especially within the vegan and organic product sectors. The UK shows steady growth despite post-Brexit regulatory challenges, with increased consumer awareness of health benefits and a shift toward organic, natural food product.

The report covers an in-depth analysis of 40+ countries; five top-performing OECD countries are highlighted below. 

In-depth Analysis of Apple Cider Vinegar Demand in Japan

The Japan apple cider vinegar revenue is growing at a CAGR of 6.2% from 2025 to 2035. The growth is driven by the country’s focus on functional food ingredients, natural remedies, and a health-conscious population. Japan's high-tech wellness culture contributes to the rising demand for apple cider vinegar in dietary supplements, beverages, and skincare.

  • High demand in health supplements, beverages, and skincare.
  • Preference for organic, natural product formulations.

Growth Outlook for Apple Cider Vinegar in Germany

The sales of apple cider vinegar in Germany are expected to expand at a CAGR of 4.8% during the forecast period, in line with the global average but strongly driven by EU regulations promoting organic food products. Germany’s emphasis on environmental sustainability, organic farming, and healthy food consumption is fostering the demand for apple cider vinegar.

  • Strong EU regulatory pressures on organic and functional food products.
  • Growing use in food processing, beverages, and wellness applications.

Apple Cider Vinegar Demand in France

The French apple cider vinegar market is projected to grow at a CAGR of 5.3% during the forecast period, propelled by government initiatives focused on organic food and sustainable consumption. France’s strict regulations on food safety and health standards further boost demand for apple cider vinegar, particularly in beverages, food processing, and wellness products.

  • High demand for organic food products and wellness solutions.
  • Increasing use in functional foods, beverages, and skincare.

Demand Trajectory for Apple Cider Vinegar in the USA

The USA apple cider vinegar market is projected to grow at a CAGR of 5.1% from 2025 to 2035, in line with the global growth rate. The demand for apple cider vinegar in the USA is fueled by the growing popularity of wellness supplements, health foods, and beverages. USA consumers are increasingly drawn to organic and natural ingredients, with apple cider vinegar playing a key role in health-conscious diets.

  • Strong demand for health supplements, functional foods, and beverages.
  • Growing adoption in vegan and organic product categories.

Apple Cider Vinegar Trends in the UK

The UK apple cider vinegar revenue is projected to grow at a CAGR of 5% from 2025 to 2035, representing steady growth in the organic food and wellness sectors. The market is driven by increased consumer awareness of health benefits and a strong shift towards organic, natural food products.
  • Focus on organic food consumption and wellness products.
  • Increasing demand in health supplements and functional foods.

Leading Apple Cider Vinegar Suppliers and Manufacturers

Apple Cider Vinegar Market Analysis By Company

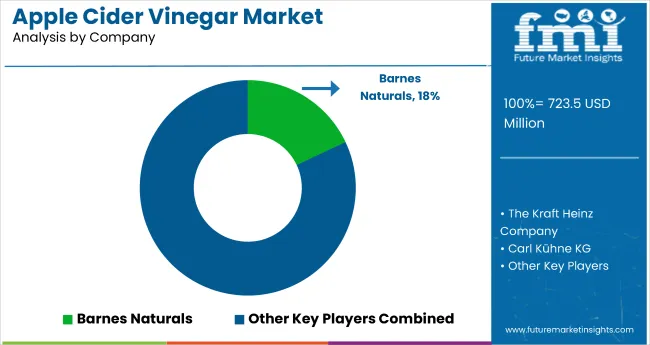
The market is moderately consolidated, with leading players like Barnes Naturals, The Kraft Heinz Company, Carl Kühne KG, Castelo Alimentos S/A, and Old Dutch Mustard Co., Inc. dominating the industry. These companies provide high-quality apple cider vinegar catering to a wide range of applications including food and beverages, wellness products, and personal care. Barnes Naturals focuses on organic, unfiltered apple cider vinegar, while The Kraft Heinz Company offers a range of flavored vinegar products.

Carl Kühne KG provides premium-quality apple cider vinegar with a focus on sustainability, and Castelo Alimentos S/A specializes in the mass production of vinegar for various food processing applications. Old Dutch Mustard Co., Inc. offers apple cider vinegar as an ingredient in sauces and condiments. Other key players such as Marukan Vinegar USA Inc., Aspall, Pepsico Inc., Molson Coors Beverage Company, and Manzana Products Co. Inc. contribute by providing a variety of apple cider vinegar products with diverse formulations for consumers.

Apple Cider Vinegar Market Report Scope

Report Attributes Details
Market Size (2025) USD 723.5 million
Projected Market Size (2035) USD 1,259.5 million
CAGR (2025 to 2035) 5.7%
Base Year for Estimation 2024
Historical Period 2020 to 2024
Projections Period 2025 to 2035
Report Parameter USD million for value/ volume in metric tons
Application Analyzed Food & Beverages, Pharmaceuticals, Personal Care, and Household & Industrial Applications
Distribution Channel Analyzed Supermarkets/Hypermarkets, Drug Stores, Convenience Stores, Specialist Stores, and Retail Stores
Regions Covered North America, Latin America, Western Europe, South Asia, East Asia, Eastern Europe, and Middle East & Africa
Countries Covered United States, United Kingdom, Germany, France, Japan, China, India, Brazil, South Korea, Australia
Key Players Influencing the Market Barnes Naturals, The Kraft Heinz Company, Carl Kühne KG, Castelo Alimentos S/A, Old Dutch Mustard Co., Inc., Marukan Vinegar USA Inc., Aspall, Pepsico Inc., Molson Coors Beverage Company, Manzana Products Co. Inc
Additional Attributes Dollar sales by application type, share by distribution channel, regional demand growth, policy influence, organic product trends, competitive benchmarking

Key Segments Covered by Apple Cider Vinegar Industry Survey Report

By Application:

  • Food & Beverages
  • Pharmaceuticals
  • Personal Care
  • Household and Industrial Applications

By Distribution Channel:

  • Supermarkets or Hypermarkets
  • Drug Stores
  • Convenience Stores
  • Specialist Stores
  • Independent Retailers
  • Departmental Stores
  • Online Stores

By Region:

  • North America
  • Latin America
  • Europe
  • East Asia
  • South Asia and Pacific
  • Middle East and Africa (MEA)

Table of Content

  1. Executive Summary
    • Global Market Outlook
    • Demand-side Trends
    • Supply-side Trends
    • Technology Roadmap Analysis
    • Analysis and Recommendations
  2. Market Overview
    • Market Coverage / Taxonomy
    • Market Definition / Scope / Limitations
  3. Market Background
    • Market Dynamics
      • Drivers
      • Restraints
      • Opportunity
      • Trends
    • Scenario Forecast
      • Demand in Optimistic Scenario
      • Demand in Likely Scenario
      • Demand in Conservative Scenario
    • Opportunity Map Analysis
    • Product Life Cycle Analysis
    • Supply Chain Analysis
      • Supply Side Participants and their Roles
        • Producers
        • Mid-Level Participants (Traders/ Agents/ Brokers)
        • Wholesalers and Distributors
      • Value Added and Value Created at Node in the Supply Chain
      • List of Raw Material Suppliers
      • List of Existing and Potential Buyer’s
    • Investment Feasibility Matrix
    • Value Chain Analysis
      • Profit Margin Analysis
      • Wholesalers and Distributors
      • Retailers
    • PESTLE and Porter’s Analysis
    • Regulatory Landscape
      • By Key Regions
      • By Key Countries
    • Regional Parent Market Outlook
    • Production and Consumption Statistics
    • Import and Export Statistics
  4. Global Market Analysis 2020 to 2024 and Forecast, 2025 to 2035
    • Historical Market Size Value (USD Million) & Volume (Metric Tons) Analysis, 2020 to 2024
    • Current and Future Market Size Value (USD Million) & Volume (Metric Tons) Projections, 2025 to 2035
      • Y-o-Y Growth Trend Analysis
      • Absolute $ Opportunity Analysis
  5. Global Market Pricing Analysis 2020 to 2024 and Forecast 2025 to 2035
  6. Global Market Analysis 2020 to 2024 and Forecast 2025 to 2035, By Application
    • Introduction / Key Findings
    • Historical Market Size Value (USD Million) & Volume (Metric Tons) Analysis By Application, 2020 to 2024
    • Current and Future Market Size Value (USD Million) & Volume (Metric Tons) Analysis and Forecast By Application, 2025 to 2035
      • Food & Beverages
      • Pharmaceuticals
      • Personal Care
      • Household and Industrial Applications
    • Y-o-Y Growth Trend Analysis By Application, 2020 to 2024
    • Absolute $ Opportunity Analysis By Application, 2025 to 2035
  7. Global Market Analysis 2020 to 2024 and Forecast 2025 to 2035, By Distribution Channel
    • Introduction / Key Findings
    • Historical Market Size Value (USD Million) & Volume (Metric Tons) Analysis By Distribution Channel, 2020 to 2024
    • Current and Future Market Size Value (USD Million) & Volume (Metric Tons) Analysis and Forecast By Distribution Channel, 2025 to 2035
      • Supermarkets/Hypermarkets
      • Drug Stores
      • Convenience Stores
      • Specialist Stores
      • Retail Stores
    • Y-o-Y Growth Trend Analysis By Distribution Channel, 2020 to 2024
    • Absolute $ Opportunity Analysis By Distribution Channel, 2025 to 2035
  8. Global Market Analysis 2020 to 2024 and Forecast 2025 to 2035, By Region
    • Introduction
    • Historical Market Size Value (USD Million) & Volume (Metric Tons) Analysis By Region, 2020 to 2024
    • Current Market Size Value (USD Million) & Volume (Metric Tons) Analysis and Forecast By Region, 2025 to 2035
      • North America
      • Latin America
      • Western Europe
      • Eastern Europe
      • East Asia
      • South Asia & Pacific
      • Middle East and Africa
    • Market Attractiveness Analysis By Region
  9. North America Market Analysis 2020 to 2024 and Forecast 2025 to 2035, By Country
    • Historical Market Size Value (USD Million) & Volume (Metric Tons) Trend Analysis By Market Taxonomy, 2020 to 2024
    • Market Size Value (USD Million) & Volume (Metric Tons) Forecast By Market Taxonomy, 2025 to 2035
      • By Country
        • USA
        • Canada
        • Mexico
      • By Application
      • By Distribution Channel
    • Market Attractiveness Analysis
      • By Country
      • By Application
      • By Distribution Channel
    • Key Takeaways
  10. Latin America Market Analysis 2020 to 2024 and Forecast 2025 to 2035, By Country
    • Historical Market Size Value (USD Million) & Volume (Metric Tons) Trend Analysis By Market Taxonomy, 2020 to 2024
    • Market Size Value (USD Million) & Volume (Metric Tons) Forecast By Market Taxonomy, 2025 to 2035
      • By Country
        • Brazil
        • Argentina
        • Rest of LATAM
      • By Application
      • By Distribution Channel
    • Market Attractiveness Analysis
      • By Country
      • By Application
      • By Distribution Channel
    • Key Takeaways
  11. Western Europe Market Analysis 2020 to 2024 and Forecast 2025 to 2035, By Country
    • Historical Market Size Value (USD Million) & Volume (Metric Tons) Trend Analysis By Market Taxonomy, 2020 to 2024
    • Market Size Value (USD Million) & Volume (Metric Tons) Forecast By Market Taxonomy, 2025 to 2035
      • By Country
        • Germany
        • Italy
        • France
        • UK
        • Spain
        • BENELUX
        • Nordic
        • Rest of W.Europe
      • By Application
      • By Distribution Channel
    • Market Attractiveness Analysis
      • By Country
      • By Application
      • By Distribution Channel
    • Key Takeaways
  12. Eastern Europe Market Analysis 2020 to 2024 and Forecast 2025 to 2035, By Country
    • Historical Market Size Value (USD Million) & Volume (Metric Tons) Trend Analysis By Market Taxonomy, 2020 to 2024
    • Market Size Value (USD Million) & Volume (Metric Tons) Forecast By Market Taxonomy, 2025 to 2035
      • By Country
        • Russia
        • Hungary
        • Poland
        • Balkan & Baltics
        • Rest of E. Europe
      • By Application
      • By Distribution Channel
    • Market Attractiveness Analysis
      • By Country
      • By Application
      • By Distribution Channel
    • Key Takeaways
  13. East Asia Market Analysis 2020 to 2024 and Forecast 2025 to 2035, By Country
    • Historical Market Size Value (USD Million) & Volume (Metric Tons) Trend Analysis By Market Taxonomy, 2020 to 2024
    • Market Size Value (USD Million) & Volume (Metric Tons) Forecast By Market Taxonomy, 2025 to 2035
      • By Country
        • China
        • Japan
        • South Korea
      • By Application
      • By Distribution Channel
    • Market Attractiveness Analysis
      • By Country
      • By Application
      • By Distribution Channel
    • Key Takeaways
  14. South Asia & Pacific Market Analysis 2020 to 2024 and Forecast 2025 to 2035, By Country
    • Historical Market Size Value (USD Million) & Volume (Metric Tons) Trend Analysis By Market Taxonomy, 2020 to 2024
    • Market Size Value (USD Million) & Volume (Metric Tons) Forecast By Market Taxonomy, 2025 to 2035
      • By Country
        • India
        • Australia & New Zealand
        • ASEAN
        • Rest of SAP
      • By Application
      • By Distribution Channel
    • Market Attractiveness Analysis
      • By Country
      • By Application
      • By Distribution Channel
    • Key Takeaways
  15. Middle East and Africa Market Analysis 2020 to 2024 and Forecast 2025 to 2035, By Country
    • Historical Market Size Value (USD Million) & Volume (Metric Tons) Trend Analysis By Market Taxonomy, 2020 to 2024
    • Market Size Value (USD Million) & Volume (Metric Tons) Forecast By Market Taxonomy, 2025 to 2035
      • By Country
        • GCC Countries
        • Northern Africa
        • South Africa
        • Turkiye
        • Rest of MEA
      • By Application
      • By Distribution Channel
    • Market Attractiveness Analysis
      • By Country
      • By Application
      • By Distribution Channel
    • Key Takeaways
  16. Key Countries Market Analysis
    • USA
      • Pricing Analysis
      • Market Share Analysis, 2024
        • By Application
        • By Distribution Channel
    • Canada
      • Pricing Analysis
      • Market Share Analysis, 2024
        • By Application
        • By Distribution Channel
    • Brazil
      • Pricing Analysis
      • Market Share Analysis, 2024
        • By Application
        • By Distribution Channel
    • Mexico
      • Pricing Analysis
      • Market Share Analysis, 2024
        • By Application
        • By Distribution Channel
    • Argentina
      • Pricing Analysis
      • Market Share Analysis, 2024
        • By Application
        • By Distribution Channel
  17. Market Structure Analysis
    • Competition Dashboard
    • Competition Benchmarking
    • Market Share Analysis of Top Players
      • By Regional
      • By Application
      • By Distribution Channel
  18. Competition Analysis
    • Competition Deep Dive
      • Barnes Naturals
        • Overview
        • Product Portfolio
        • Profitability by Market Segments (Product/Age /Sales Channel/Region)
        • Sales Footprint
        • Strategy Overview
          • Marketing Strategy
          • Product Strategy
          • Channel Strategy
      • The Kraft Heinz Company
        • Overview
        • Product Portfolio
        • Profitability by Market Segments (Product/Age /Sales Channel/Region)
        • Sales Footprint
        • Strategy Overview
          • Marketing Strategy
          • Product Strategy
          • Channel Strategy
      • Carl Kuhne KG
        • Overview
        • Product Portfolio
        • Profitability by Market Segments (Product/Age /Sales Channel/Region)
        • Sales Footprint
        • Strategy Overview
          • Marketing Strategy
          • Product Strategy
          • Channel Strategy
      • Castelo Alimentos S/A
        • Overview
        • Product Portfolio
        • Profitability by Market Segments (Product/Age /Sales Channel/Region)
        • Sales Footprint
        • Strategy Overview
          • Marketing Strategy
          • Product Strategy
          • Channel Strategy
      • Old Dutch Mustard Co., Inc.
        • Overview
        • Product Portfolio
        • Profitability by Market Segments (Product/Age /Sales Channel/Region)
        • Sales Footprint
        • Strategy Overview
          • Marketing Strategy
          • Product Strategy
          • Channel Strategy
      • Marukan Vinegar USA Inc.
        • Overview
        • Product Portfolio
        • Profitability by Market Segments (Product/Age /Sales Channel/Region)
        • Sales Footprint
        • Strategy Overview
          • Marketing Strategy
          • Product Strategy
          • Channel Strategy
      • Aspall
        • Overview
        • Product Portfolio
        • Profitability by Market Segments (Product/Age /Sales Channel/Region)
        • Sales Footprint
        • Strategy Overview
          • Marketing Strategy
          • Product Strategy
          • Channel Strategy
      • Pepsico Inc
        • Overview
        • Product Portfolio
        • Profitability by Market Segments (Product/Age /Sales Channel/Region)
        • Sales Footprint
        • Strategy Overview
          • Marketing Strategy
          • Product Strategy
          • Channel Strategy
      • Molson Coors Beverage Company
        • Overview
        • Product Portfolio
        • Profitability by Market Segments (Product/Age /Sales Channel/Region)
        • Sales Footprint
        • Strategy Overview
          • Marketing Strategy
          • Product Strategy
          • Channel Strategy
      • Manzana Products Co. Inc
        • Overview
        • Product Portfolio
        • Profitability by Market Segments (Product/Age /Sales Channel/Region)
        • Sales Footprint
        • Strategy Overview
          • Marketing Strategy
          • Product Strategy
          • Channel Strategy
  19. Assumptions & Acronyms Used
  20. Research Methodology

List of Tables

  • Table 1: Global Market Value (USD Million) Forecast by Region, 2020 to 2035
  • Table 2: Global Market Volume (Metric Tons) Forecast by Region, 2020 to 2035
  • Table 3: Global Market Value (USD Million) Forecast by Application, 2020 to 2035
  • Table 4: Global Market Volume (Metric Tons) Forecast by Application, 2020 to 2035
  • Table 5: Global Market Value (USD Million) Forecast by Distribution Channel, 2020 to 2035
  • Table 6: Global Market Volume (Metric Tons) Forecast by Distribution Channel, 2020 to 2035
  • Table 7: North America Market Value (USD Million) Forecast by Country, 2020 to 2035
  • Table 8: North America Market Volume (Metric Tons) Forecast by Country, 2020 to 2035
  • Table 9: North America Market Value (USD Million) Forecast by Application, 2020 to 2035
  • Table 10: North America Market Volume (Metric Tons) Forecast by Application, 2020 to 2035
  • Table 11: North America Market Value (USD Million) Forecast by Distribution Channel, 2020 to 2035
  • Table 12: North America Market Volume (Metric Tons) Forecast by Distribution Channel, 2020 to 2035
  • Table 13: Latin America Market Value (USD Million) Forecast by Country, 2020 to 2035
  • Table 14: Latin America Market Volume (Metric Tons) Forecast by Country, 2020 to 2035
  • Table 15: Latin America Market Value (USD Million) Forecast by Application, 2020 to 2035
  • Table 16: Latin America Market Volume (Metric Tons) Forecast by Application, 2020 to 2035
  • Table 17: Latin America Market Value (USD Million) Forecast by Distribution Channel, 2020 to 2035
  • Table 18: Latin America Market Volume (Metric Tons) Forecast by Distribution Channel, 2020 to 2035
  • Table 19: Western Europe Market Value (USD Million) Forecast by Country, 2020 to 2035
  • Table 20: Western Europe Market Volume (Metric Tons) Forecast by Country, 2020 to 2035
  • Table 21: Western Europe Market Value (USD Million) Forecast by Application, 2020 to 2035
  • Table 22: Western Europe Market Volume (Metric Tons) Forecast by Application, 2020 to 2035
  • Table 23: Western Europe Market Value (USD Million) Forecast by Distribution Channel, 2020 to 2035
  • Table 24: Western Europe Market Volume (Metric Tons) Forecast by Distribution Channel, 2020 to 2035
  • Table 25: Eastern Europe Market Value (USD Million) Forecast by Country, 2020 to 2035
  • Table 26: Eastern Europe Market Volume (Metric Tons) Forecast by Country, 2020 to 2035
  • Table 27: Eastern Europe Market Value (USD Million) Forecast by Application, 2020 to 2035
  • Table 28: Eastern Europe Market Volume (Metric Tons) Forecast by Application, 2020 to 2035
  • Table 29: Eastern Europe Market Value (USD Million) Forecast by Distribution Channel, 2020 to 2035
  • Table 30: Eastern Europe Market Volume (Metric Tons) Forecast by Distribution Channel, 2020 to 2035
  • Table 31: East Asia Market Value (USD Million) Forecast by Country, 2020 to 2035
  • Table 32: East Asia Market Volume (Metric Tons) Forecast by Country, 2020 to 2035
  • Table 33: East Asia Market Value (USD Million) Forecast by Application, 2020 to 2035
  • Table 34: East Asia Market Volume (Metric Tons) Forecast by Application, 2020 to 2035
  • Table 35: East Asia Market Value (USD Million) Forecast by Distribution Channel, 2020 to 2035
  • Table 36: East Asia Market Volume (Metric Tons) Forecast by Distribution Channel, 2020 to 2035
  • Table 37: South Asia & Pacific Market Value (USD Million) Forecast by Country, 2020 to 2035
  • Table 38: South Asia & Pacific Market Volume (Metric Tons) Forecast by Country, 2020 to 2035
  • Table 39: South Asia & Pacific Market Value (USD Million) Forecast by Application, 2020 to 2035
  • Table 40: South Asia & Pacific Market Volume (Metric Tons) Forecast by Application, 2020 to 2035
  • Table 41: South Asia & Pacific Market Value (USD Million) Forecast by Distribution Channel, 2020 to 2035
  • Table 42: South Asia & Pacific Market Volume (Metric Tons) Forecast by Distribution Channel, 2020 to 2035
  • Table 43: Middle East and Africa Market Value (USD Million) Forecast by Country, 2020 to 2035
  • Table 44: Middle East and Africa Market Volume (Metric Tons) Forecast by Country, 2020 to 2035
  • Table 45: Middle East and Africa Market Value (USD Million) Forecast by Application, 2020 to 2035
  • Table 46: Middle East and Africa Market Volume (Metric Tons) Forecast by Application, 2020 to 2035
  • Table 47: Middle East and Africa Market Value (USD Million) Forecast by Distribution Channel, 2020 to 2035
  • Table 48: Middle East and Africa Market Volume (Metric Tons) Forecast by Distribution Channel, 2020 to 2035

List of Figures

  • Figure 1: Global Market Volume (Metric Tons) Forecast 2020 to 2035
  • Figure 2: Global Market Pricing Analysis
  • Figure 3: Global Market Value (USD Million) Forecast 2020 to 2035
  • Figure 4: Global Market Value Share and BPS Analysis by Application, 2025 and 2035
  • Figure 5: Global Market Y-o-Y Growth Comparison by Application, 2025 to 2035
  • Figure 6: Global Market Attractiveness Analysis by Application
  • Figure 7: Global Market Value Share and BPS Analysis by Distribution Channel, 2025 and 2035
  • Figure 8: Global Market Y-o-Y Growth Comparison by Distribution Channel, 2025 to 2035
  • Figure 9: Global Market Attractiveness Analysis by Distribution Channel
  • Figure 10: Global Market Value (USD Million) Share and BPS Analysis by Region, 2025 and 2035
  • Figure 11: Global Market Y-o-Y Growth Comparison by Region, 2025 to 2035
  • Figure 12: Global Market Attractiveness Analysis by Region
  • Figure 13: North America Market Incremental $ Opportunity, 2025 to 2035
  • Figure 14: Latin America Market Incremental $ Opportunity, 2025 to 2035
  • Figure 15: Western Europe Market Incremental $ Opportunity, 2025 to 2035
  • Figure 16: Eastern Europe Market Incremental $ Opportunity, 2025 to 2035
  • Figure 17: East Asia Market Incremental $ Opportunity, 2025 to 2035
  • Figure 18: South Asia & Pacific Market Incremental $ Opportunity, 2025 to 2035
  • Figure 19: Middle East and Africa Market Incremental $ Opportunity, 2025 to 2035
  • Figure 20: North America Market Value Share and BPS Analysis by Country, 2025 and 2035
  • Figure 21: North America Market Value Share and BPS Analysis by Application, 2025 and 2035
  • Figure 22: North America Market Y-o-Y Growth Comparison by Application, 2025 to 2035
  • Figure 23: North America Market Attractiveness Analysis by Application
  • Figure 24: North America Market Value Share and BPS Analysis by Distribution Channel, 2025 and 2035
  • Figure 25: North America Market Y-o-Y Growth Comparison by Distribution Channel, 2025 to 2035
  • Figure 26: North America Market Attractiveness Analysis by Distribution Channel
  • Figure 27: Latin America Market Value Share and BPS Analysis by Country, 2025 and 2035
  • Figure 28: Latin America Market Value Share and BPS Analysis by Application, 2025 and 2035
  • Figure 29: Latin America Market Y-o-Y Growth Comparison by Application, 2025 to 2035
  • Figure 30: Latin America Market Attractiveness Analysis by Application
  • Figure 31: Latin America Market Value Share and BPS Analysis by Distribution Channel, 2025 and 2035
  • Figure 32: Latin America Market Y-o-Y Growth Comparison by Distribution Channel, 2025 to 2035
  • Figure 33: Latin America Market Attractiveness Analysis by Distribution Channel
  • Figure 34: Western Europe Market Value Share and BPS Analysis by Country, 2025 and 2035
  • Figure 35: Western Europe Market Value Share and BPS Analysis by Application, 2025 and 2035
  • Figure 36: Western Europe Market Y-o-Y Growth Comparison by Application, 2025 to 2035
  • Figure 37: Western Europe Market Attractiveness Analysis by Application
  • Figure 38: Western Europe Market Value Share and BPS Analysis by Distribution Channel, 2025 and 2035
  • Figure 39: Western Europe Market Y-o-Y Growth Comparison by Distribution Channel, 2025 to 2035
  • Figure 40: Western Europe Market Attractiveness Analysis by Distribution Channel
  • Figure 41: Eastern Europe Market Value Share and BPS Analysis by Country, 2025 and 2035
  • Figure 42: Eastern Europe Market Value Share and BPS Analysis by Application, 2025 and 2035
  • Figure 43: Eastern Europe Market Y-o-Y Growth Comparison by Application, 2025 to 2035
  • Figure 44: Eastern Europe Market Attractiveness Analysis by Application
  • Figure 45: Eastern Europe Market Value Share and BPS Analysis by Distribution Channel, 2025 and 2035
  • Figure 46: Eastern Europe Market Y-o-Y Growth Comparison by Distribution Channel, 2025 to 2035
  • Figure 47: Eastern Europe Market Attractiveness Analysis by Distribution Channel
  • Figure 48: East Asia Market Value Share and BPS Analysis by Country, 2025 and 2035
  • Figure 49: East Asia Market Value Share and BPS Analysis by Application, 2025 and 2035
  • Figure 50: East Asia Market Y-o-Y Growth Comparison by Application, 2025 to 2035
  • Figure 51: East Asia Market Attractiveness Analysis by Application
  • Figure 52: East Asia Market Value Share and BPS Analysis by Distribution Channel, 2025 and 2035
  • Figure 53: East Asia Market Y-o-Y Growth Comparison by Distribution Channel, 2025 to 2035
  • Figure 54: East Asia Market Attractiveness Analysis by Distribution Channel
  • Figure 55: South Asia & Pacific Market Value Share and BPS Analysis by Country, 2025 and 2035
  • Figure 56: South Asia & Pacific Market Value Share and BPS Analysis by Application, 2025 and 2035
  • Figure 57: South Asia & Pacific Market Y-o-Y Growth Comparison by Application, 2025 to 2035
  • Figure 58: South Asia & Pacific Market Attractiveness Analysis by Application
  • Figure 59: South Asia & Pacific Market Value Share and BPS Analysis by Distribution Channel, 2025 and 2035
  • Figure 60: South Asia & Pacific Market Y-o-Y Growth Comparison by Distribution Channel, 2025 to 2035
  • Figure 61: South Asia & Pacific Market Attractiveness Analysis by Distribution Channel
  • Figure 62: Middle East and Africa Market Value Share and BPS Analysis by Country, 2025 and 2035
  • Figure 63: Middle East and Africa Market Value Share and BPS Analysis by Application, 2025 and 2035
  • Figure 64: Middle East and Africa Market Y-o-Y Growth Comparison by Application, 2025 to 2035
  • Figure 65: Middle East and Africa Market Attractiveness Analysis by Application
  • Figure 66: Middle East and Africa Market Value Share and BPS Analysis by Distribution Channel, 2025 and 2035
  • Figure 67: Middle East and Africa Market Y-o-Y Growth Comparison by Distribution Channel, 2025 to 2035
  • Figure 68: Middle East and Africa Market Attractiveness Analysis by Distribution Channel
  • Figure 69: Global Market - Tier Structure Analysis
  • Figure 70: Global Market - Company Share Analysis

Frequently Asked Questions

What is the projected size of the apple cider vinegar market in 2025?

The market is valued at USD 723.5 million in 2025.

What is the outlook on apple cider vinegar demand by 2035?

The market is forecasted to reach USD 1,259.5 million by 2035, reflecting a CAGR of 5.7%.

Which segment leads the apple cider vinegar market by application in 2025?

The food & beverages will lead the application segment, accounting for 43.6% of the global market share in 2025.

What is the top distribution channel for the apple cider vinegar market in 2025?

Supermarkets/hypermarkets will dominate the distribution channel segment with a 39.6% share in 2025.

Which country is projected to have the fastest-growing apple cider vinegar market?

Japan is projected to grow at the fastest rate, with a CAGR of 6.2% from 2025 to 2035.

Explore Similar Insights

Future Market Insights

Apple Cider Vinegar Market