Reports

- Global Locations -

Headquarters

Future Market Insights, Inc.

Christiana Corporate, 200
Continental Drive, Suite 401,
Newark, Delaware - 19713,
United States

T: +1-845-579-5705

Americas

Future Market Insights, Inc.

616 Corporate Way, Suite 2-9018,
Valley Cottage, NY 10989, United States

T: +1-347-918-3531

MEA

Future Market Insights

1602-6 Jumeirah Bay X2 Tower, Plot No: JLT-PH2-X2A,
Jumeirah Lakes Towers, Dubai,
United Arab Emirates

Europe

Future Market Insights

3rd Floor, 207 Regent Street,
W1B 3HH London
United Kingdom

T: + 44 (0) 20 8123 9659
D: +44 (0) 20 3287 4268

Asia Pacific

Future Market Insights

IndiaLand Global Tech Park, Unit UG-1, Behind Grand HighStreet, Phase 1, Hinjawadi, MH, Pune – 411057, India

Central Venous Catheter Market Outlook for 2023 to 2033

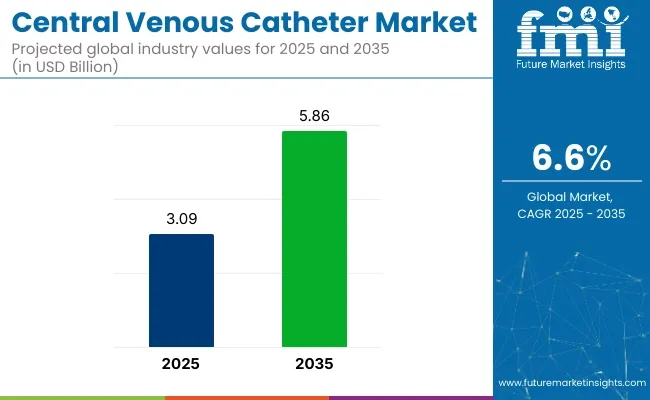
The global central venous catheter market size is slated to attain a valuation of US$ 5,314.5 million by 2033. Our healthcare analysts opine that central venous catheter manufacturers can expect a modest CAGR of 5.1% through 2033, with a current valuation of US$ 3,238.1 million in 2023.

Attributes Details
Central Venous Catheter Market Size, 2022 US$ 3,074.7 million
Central Venous Catheter Market Size, 2023 US$ 3,238.1 million
Central Venous Catheter Market Size, 2033 US$ 5,314.5 million
Value CAGR (2023 to 2033) 5.1%

Key Market Highlights:

A Near-persistent CAGR to Influence Sales Over the Next Decade

Historically, the central venous catheter industry performance has witnessed an average CAGR of 4.7% (2018 to 2022), likely increasing by 0.4% by 2033. The demand for CVC is significantly influenced by the rising prevalence of chronic diseases. Long-term intravenous medicines are frequently needed for diseases like cancer, diabetes, cardiovascular disorders, and renal disorders. In these situations, CVCs are crucial because they offer dependable and secure access to the bloodstream for the delivery of fluids, chemotherapy, medicines, and parenteral nutrition. The demand for CVCs is rising along with the worldwide burden of chronic diseases since these devices make efficient disease management and treatment possible.

Bioresorbable Catheters Represent a Promising Area of Research & Development

Bioresorbable catheters are a cutting-edge innovation in the global market for healthcare devices, particularly central venous catheters (CVCs). After serving their intended purpose, the body will gradually absorb and digest these catheters. Applications for bioresorbable catheters are numerous. In many different medical applications, such as post-operative care, pediatric care, and critical care units, they can be used to meet short-term intravenous access demands. These catheters are especially useful when temporary vascular access is required without making the long-term commitment of a permanent implant.

Research and development on bioresorbable central venous catheters is ongoing within the medical device sector. In order to improve these catheters' biocompatibility, durability, and degradation profiles, researchers are constantly experimenting with new materials and designs. The goal of this continual innovation is to raise patient safety and results. Bioresorbable CVCs are anticipated to enhance patient care and outcomes as research and development activities proceed in this industry.

As a recent development, the OPTRELLTM Mapping Catheter with TRUErefTM Technology powered by the CARTO® 3 System was launched in the United States in July 2023 by Biosense Webster, Inc., a world pioneer in the treatment of cardiac arrhythmias and a subsidiary of Johnson & Johnson MedTech. The OPTRELLTM Mapping Catheter is a high-density diagnostic catheter with tiny electrodes arranged in a fixed array formation to provide high-definition electrophysiological mapping in cases of complex cardiac arrhythmias like persistent atrial fibrillation (AFib), redo AFib ablation, atrial tachycardia, and ventricular tachycardia.

Don't pay for what you don't need

Customize your report by selecting specific countries or regions and save 30%!

Historical Performance of the Central Venous Catheter Market (2018 to 2022) Vs. Forecast Outlook (2023 to 2033)

Attributes Details
Central Venous Catheter Market Size (2018) US$ 2,446.9 million
Central Venous Catheter Market Size (2022) US$ 3,074.7 million
Central Venous Catheter Market (CAGR 2018 to 2022) 4.7%

A paradigm-shifting development in recent years is the expansion of home healthcare services. Chronic illness patients who traditionally needed lengthy hospital stays can now receive care in the convenience of their own homes. In this approach, changing central venous catheters (CVCs) is essential. Patients are taught how to maintain and change the dressings on their catheters, enabling them to receive intravenous therapies without frequently visiting the hospital. This change improves patient quality of life while lowering healthcare expenses and the demand for healthcare facilities. As a result, there is increasing demand for CVCs that may be used at home, as well as patient support and education.

The infrastructure for healthcare in emerging nations has seen active investment, increasing access to cutting-edge treatments and equipment. In areas where prior access to such devices was restricted, the development of healthcare services is increasing demand for CVCs. The establishment of new healthcare facilities outfitted with cutting-edge medical tools and technologies has accelerated the acceptance of CVCs and increased the availability of these devices to patients in these areas.

In the coming years, the CVC market will continue to place a high priority on infection control. It is anticipated that the development of sophisticated infection prevention strategies will continue. For instance, catheter antimicrobial coatings might advance, significantly lowering the incidence of catheter-related bloodstream infections. Healthcare facilities will use more stringent aseptic procedures and stricter catheter maintenance procedures. By lowering problems and enhancing general healthcare outcomes, the continued search for safer CVCs will be advantageous to patients.

CVC producers may seek eco-friendly materials and sustainable production techniques as sustainability becomes a more important factor in healthcare. The production and disposal of medical devices may impact the environment less if biodegradable or recyclable catheter materials gain popularity. Healthcare facilities will probably emphasize green purchasing methods, which will result in the adoption of sustainable CVC options in their supply chains.

Central Venous Catheter Market Trends Analysis

Trends
  • The development of biocompatible, bioresorbable CVCs is attracting interest. These catheters gradually disintegrate in the body by removing the need for removal procedures and lowering the possibility of long-term problems.
  • Teleoperated CVC insertion systems, which enable precise remote-controlled catheter placements, have been developed due to advancements in robotic-assisted surgery and are especially useful in difficult situations or remote locations.
  • Innovative catheter navigation systems use electromagnetic or ultrasound guiding to increase catheter tip placement precision, lowering the risk of problems and raising overall procedure safety.
  • Utilizing 3D printing technology, specific CVCs are being made that are shaped to the anatomy of the patient. These patient-specific catheters minimize the possibility of misinsertion and insertion-related issues.
Opportunities
  • Growing trends in telemedicine and remote patient monitoring present CVCs with remote monitoring capabilities with opportunities to support telehealth services and improve at-home patient care.
  • The trend toward personalized medicine may result in CVC solutions that are specifically designed to meet the needs of each patient, lowering problems and enhancing outcomes.
  • Opportunities for CVCs are brought forth by the rising trend toward minimally invasive surgical techniques. These catheters continue to be in demand because they are necessary for safe and efficient vascular access during minimally invasive operations.
  • Comprehensive patient education and training programs pertaining to CVC care and management have the potential to be developed. Knowledgeable patients and caregivers can help improve results and minimize complications.
Challenges
  • Providing data privacy and security for patient information transferred through smart CVCs is a serious concern and potential threat as technology, and data collecting are being integrated into healthcare.
  • Regulations and market practices involving CVC use may be impacted by ethical and legal issues like informed consent and patient rights.
  • In some clinical situations, developments in alternative technologies, such as peripherally inserted central catheters (PICCs) or implantable port devices, may represent a challenge to the viability of standard CVCs.
  • The effectiveness of infection control techniques, such as CVCs with an antimicrobial coating, is threatened by the evolution of antimicrobial resistance. There can be difficulties in preventing catheter-related infections if resistance increases.
Sabyasachi Ghosh
Sabyasachi Ghosh

Principal Consultant

Talk to Analyst

Find your sweet spots for generating winning opportunities in this market.

Comparative View of Adjacent Central Venous Catheter Market

Future Market Insights (FMI) has compared two other markets, the Catheter Tip Syringe Market and the Catheter-directed Thrombolysis Market. The tables show that the Central Venous Catheter Market is expanding at a slightly lower CAGR than the other two. However, it signifies a greater revenue potential over the other two markets in the due course.

The growing prevalence of chronic diseases, backed by the rising geriatric population, is expected to influence growth in the three markets. Likewise, the increasing investments in the healthcare industry will bode well for the three markets.

Central Venous Catheter Market:

Attributes Central Venous Catheter Market
CAGR (2023 to 2033) 5.1%
Market Value (2023) US$ 3,238.1 million
Growth Factors
  • Growing investments in the healthcare industry in emerging nations.
  • Increasing geriatric population.
  • Increasing prevalence of chronic diseases.
Future Opportunities Growth in telehealth and telemedicine initiatives.
Market Trends Increasing expenditure on healthcare.

Catheter Tip Syringe Market:

Attributes Catheter Tip Syringe Market
CAGR (2023 to 2033) 7.1%
Market Value (2023) US$ 950.4 million
Growth Factors
  • Rising prevalence of lifestyle diseases.
  • Increase in neonatal admissions.
  • Rise in diabetic patients globally.
Future Opportunities Rise in patient pool with chronic disorders.
Market Trends Expanding global elderly population.

Catheter-directed Thrombolysis Market:

Attributes Catheter-directed Thrombolysis Market
CAGR (2023 to 2033) 5.9%
Market Value (2023) US$ 454.8 million
Growth Factors
  • Availability of emergency medical services and favorable insurance coverage.
  • Growth in geriatric population.
  • Improvements in the regulatory framework.
Future Opportunities Product innovation and technological developments.
Market Trends Increasing fluoroscopy practice.

Category-wise Insights

PICC Catheters are the Leading Product Type in the Industry

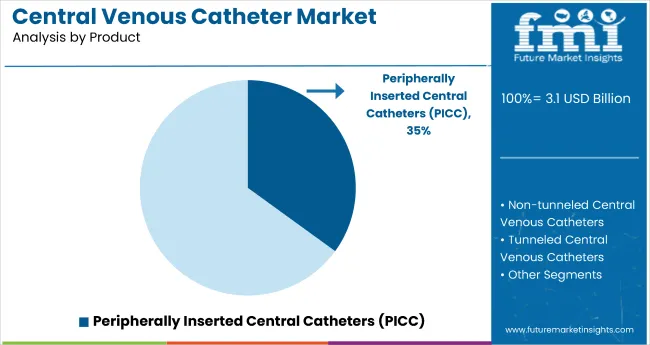
In 2022, the PICC catheters segment garnered 31.9% of the central venous catheter market shares.

Segment PICC Catheters
Value Share (2022) 31.9%

PICC catheters can be utilized in hospitals, outpatient clinics, and home healthcare, among other healthcare facilities. They can be used with a variety of patient populations and clinical settings due to their adaptability. Compared to conventional CVCs like central venous or tunneled catheters, PICC catheters require less invasive insertion. They normally do not require surgical insertion because they are put into a peripheral vein in the arm. Patients find more comfort in this less invasive method, which lowers the possibility of surgical complications and promotes the growth of the PICC catheter market.

Non-Anti-Microbial Catheters’ Cost Benefits Contribute to their High Use

In 2022, the non-anti-microbial catheter segment garnered 75.7% of the central venous catheter market shares.

Segment Non-Anti-Microbial Catheters
Value Share (2022) 75.7%

Catheters without antibacterial agents can be used for a variety of clinical indications. They can be used for a variety of intravenous therapies, such as parenteral nutrition, chemotherapy, fluid administration, and blood transfusions. Due to their adaptability, they are frequently chosen in therapeutic settings. Catheters that are non-antimicrobial typically cost less than their anti-microbial equivalents. Healthcare facilities may use non-antimicrobial alternatives to reduce costs, particularly when infection rates are tightly managed by other strategies such stringent aseptic procedures. These factors are largely responsible for the antimicrobial coated central venous catheter market growth.

Double Lumen is the Preferred Design Type in the Industry

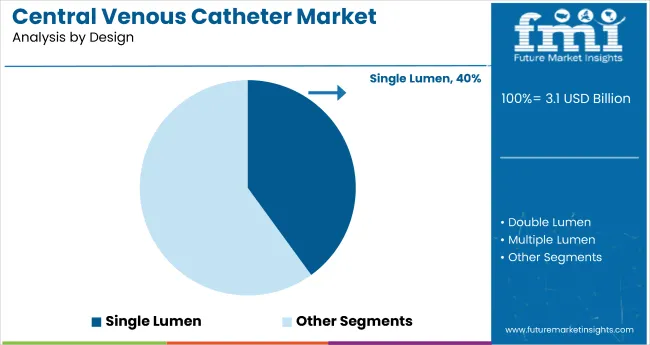
In 2022, the double lumen segment gained 63.6% of the central venous catheter market shares.

Segment Double Lumen
Value Share (2022) 63.6%

Double lumen catheters are ideally suited for complicated therapies that call for continuous intravenous medicine administration while also monitoring the patient's hemodynamic status or taking blood samples. A wide range of clinical settings, such as critical care, hemodialysis, and oncology therapies, are supported by this design. Double lumen catheters are frequently managed by healthcare personnel with experience and training, making them an increasingly common choice in clinical practice. Knowing how to utilize these catheters can increase physician confidence, which ultimately leads to increased demand.

Hospitals are the Dominant End-users in the CVC Industry

In 2022, the hospitals segment garnered 60.3% of the central venous catheter market shares.

Segment Hospitals
Value Share (2022) 60.3%

Hospitals offer a variety of medical specializations, such as intensive care units (ICUs), surgery, cancer, cardiology, and pediatrics, among others. Since CVCs are used in many medical departments and specializations, hospitals serve as the primary destination for CVC demand. The infrastructure, supplies, and personnel needed to operate and maintain CVCs efficiently are often available in hospitals. The facilities for procedures like CVC insertions and replacements, as well as the qualified medical staff and sterile conditions, are included in this.

Get the data you need at a Fraction of the cost

Personalize your report by choosing insights you need
and save 40%!

 Country-wise Insights

Countries Value CAGR (2023 to 2033)
United Kingdom 9.0%
Germany 3.3%
India 4.6%
China 6.5%
Australia 5.1%

Rise of Home Healthcare Services Boosts Product Demand in the United Kingdom

The central venous catheter market in the United Kingdom will thrive at a CAGR of 9.0% through 2033. The United Kingdom has a sophisticated healthcare system that provides excellent medical treatment. The most recent medical technologies, such as CVCs, are available in contemporary hospitals and healthcare institutions to satisfy patient needs. Home healthcare services are being promoted in the United Kingdom as a way to relieve hospital overcrowding and deliver more patient-centered care. The adoption of CVCs in home healthcare settings has increased, enabling patients to receive intravenous therapies in the convenience of their own homes.

Surging Healthcare Expenditure Favors Market Growth in Europe

Germany’s central venous catheter market will develop at a 3.3% CAGR through 2033. In Europe, Germany has one of the leading populations of senior citizens. Market expansion is being driven by the aging population's increased propensity to need sophisticated medical procedures, such as CVCs, for ailments like cancer, heart disease, and chronic illnesses. Germany consistently ranks as one of the nations with the most per-capita healthcare spending. This monetary investment in healthcare infrastructure and services encourages the use of cutting-edge medical innovations like CVCs.

Rural Healthcare Initiatives Uptick Demand in India

India central venous catheter market will progress at a 4.6% CAGR through 2033. Chronic disorders like diabetes and cardiovascular disease are becoming more common in India. CVCs are required for dispensing drugs and therapies to control certain illnesses. India is making a concerted effort to provide access to healthcare in remote and neglected areas. The demand for CVCs in outlying and rural healthcare settings is rising as the healthcare infrastructure develops. The Indian government has launched a few of healthcare initiatives, such as Ayushman Bharat, with the goal of ensuring financial security and access to high-quality medical treatment. These programs have broadened the population's access to cutting-edge medical treatments, including CVCs.

Shift Towards Value-based Care Will Play a Vital Role in Market Expansion in China

China’s central venous catheter market will rise at a 6.5% CAGR through 2033. China is rapidly urbanizing, and the proportion of urban residents is rising. With the growth of contemporary healthcare infrastructure and facilities, there is an increased need for cutting-edge medical tools like CVCs. The growing middle class in China has better access to healthcare services and a larger need for cutting-edge medical procedures. The rising use of CVCs, particularly in metropolitan areas, is influenced by this demographic transition. Value-based care approaches, which emphasize cost-effectiveness and healthcare outcomes, are being adopted progressively in China. CVCs are essential to these developing healthcare practices because they help to improve patient outcomes.

Telehealth and Telemedicine Initiatives Present Growth Avenues in Australia

Australia’s central venous catheter market growth will accelerate at a 5.1% CAGR through 2033. The enormous geography of Australia includes isolated and rural places with scant access to medical facilities. CVCs are essential in these areas for providing emergency treatment and intravenous therapies, which helps the market grow. Telehealth and telemedicine have been aggressively accepted in Australia, particularly in rural areas. Demand is increased by the ease with which home-based care and telemedicine consultations are made possible by CVCs with remote monitoring capabilities. In Australia, mobile clinics and outreach initiatives are typical for reaching out to remote and underprivileged regions with medical care. CVCs are crucial for these mobile healthcare units since they increase their capabilities and range of operations.

Competitive Landscape

A blend of international and regional businesses defines the central venous catheter (CVC) market's competitive environment. Prominent multinational corporations with sizable market shares include Becton, Dickinson and Company (BD), Teleflex Inc., and C.R. Bard (now acquired by BD). These market leaders use their vast product portfolios, well-developed distribution systems, and strong R&D departments to keep a competitive edge.

Regional players are essential to supplying local markets at the same time. They frequently concentrate on specialized markets, personalization, and affordable fixes while taking into account particular regional tastes and healthcare needs. Global and regional firms frequently use partnerships, mergers, and acquisitions to increase their market share, gain access to new technology, and improve their product offerings.

Recent Developments

  • In January 2023, Coloplast introduced a new catheter in the United States. People with bladder and urine issues are the target market for the SpeediCath Flex Set catheter. All SpeediCath catheters have Triple Action Coating Technology, a choice for people with spinal cord injuries (SCI) and intended to lower the risk of urethral injury and urinary tract infections (UTIs).
  • A pioneer in infusion therapy, B. Braun Medical Inc. (B. Braun) announced the introduction of its new Introcan Safety 2 IV Catheter with one-time blood control in July 2022. The newest innovation from B. Braun makes IV access safer for the clinician by lowering the possibility of needlestick injuries and exposure to blood with the Introcan Safety 2 IV Catheter.

Key Players in the Central Venous Catheter Market

  • Angio Dynamics
  • C.R. Bard
  • Teleflex Incorporated
  • B. Braun Melsungen AG
  • Kimal Healthcare
  • Come B.V.
  • Medtronic Plc
  • Smiths Medical
  • Vygon (UK) Ltd.
  • Becton, Dickinson, and Company
  • Argon Medical Devices Inc.
  • Boston Scientific Corporation
  • Cook Medical Incorporated
  • Medical Components Inc.
  • Fresenius Kabi AG

Central Venous Catheter Market Segmentation

By Product:

  • Dialysis Catheters
  • Acute Hemodialysis Catheter
  • Chronic Hemodialysis Catheter
  • Peritoneal Dialysis Catheter
  • PICC Catheters
  • Implantable Port
  • CVC Catheters
  • Tunneled Catheters
  • Non-tunneled Catheters

By Property:

  • Anti-microbial Catheter
  • Non-Anti-Microbial Catheter

By Design:

  • Single Lumen
  • Double Lumen
  • Multiple Lumen

By End-user:

  • Hospitals
  • Ambulatory Surgical Centers
  • Dialysis Centers
  • Specialty Clinics
  • Others

By Region:

  • North America
  • Latin America
  • Europe
  • South Asia
  • East Asia
  • Oceania
  • Middle East and Africa

Frequently Asked Questions

How Big is the Central Venous Catheter Market?

The central venous catheter market size is valued at US$ 3,238.1 million in 2023.

What is the Projected CAGR of the Central Venous Catheter Market?

The central venous catheter market share will rise at a 5.1% CAGR through 2033.

How Big Will be the Central Venous Catheter Market?

The central venous catheter market will be worth US$ 5,314.5 million by 2033.

Which is the Leading Product Type in the Central Venous Catheter Market?

The PICC catheters are the leading product type in the central venous catheter market.

Which Country is Rising with a High CAGR in the Central Venous Catheter Market?

The United Kingdom’s central venous catheter market will rise at a 9.0% CAGR through 2033.

Table of Content

1. Executive Summary

    1.1. Global Market Outlook

    1.2. Demand-side Trends

    1.3. Supply-side Trends

    1.4. Technology Roadmap Analysis

    1.5. Analysis and Recommendations

2. Market Overview

    2.1. Market Coverage / Taxonomy

    2.2. Market Definition / Scope / Limitations

3. Market Background

    3.1. Market Dynamics

        3.1.1. Drivers

        3.1.2. Restraints

        3.1.3. Opportunity

        3.1.4. Trends

    3.2. Scenario Forecast

        3.2.1. Demand in Optimistic Scenario

        3.2.2. Demand in Likely Scenario

        3.2.3. Demand in Conservative Scenario

    3.3. Opportunity Map Analysis

    3.4. Investment Feasibility Matrix

    3.5. PESTLE and Porter’s Analysis

    3.6. Regulatory Landscape

        3.6.1. By Key Regions

        3.6.2. By Key Countries

    3.7. Regional Parent Market Outlook

4. Global Market Analysis 2018 to 2022 and Forecast, 2023 to 2033

    4.1. Historical Market Size Value (US$ Million) Analysis, 2018 to 2022

    4.2. Current and Future Market Size Value (US$ Million) Projections, 2023 to 2033

        4.2.1. Y-o-Y Growth Trend Analysis

        4.2.2. Absolute $ Opportunity Analysis

5. Global Market Analysis 2018 to 2022 and Forecast 2023 to 2033, By Product

    5.1. Introduction / Key Findings

    5.2. Historical Market Size Value (US$ Million) Analysis By Product, 2018 to 2022

    5.3. Current and Future Market Size Value (US$ Million) Analysis and Forecast By Product, 2023 to 2033

        5.3.1. Dialysis Catheters

            5.3.1.1. Acute Hemodialysis Catheter

            5.3.1.2. Chronic Hemodialysis Catheter

            5.3.1.3. Peritoneal Dialysis Catheter

        5.3.2. PICC Catheters

        5.3.3. Implantable Port

        5.3.4. CVC Catheters

            5.3.4.1. Tunneled Catheters

            5.3.4.2. Non-Tunneled Catheters

    5.4. Y-o-Y Growth Trend Analysis By Product, 2018 to 2022

    5.5. Absolute $ Opportunity Analysis By Product, 2023 to 2033

6. Global Market Analysis 2018 to 2022 and Forecast 2023 to 2033, By Property

    6.1. Introduction / Key Findings

    6.2. Historical Market Size Value (US$ Million) Analysis By Property, 2018 to 2022

    6.3. Current and Future Market Size Value (US$ Million) Analysis and Forecast By Property, 2023 to 2033

        6.3.1. Anti-microbial Catheter

        6.3.2. Non-Anti-Microbial Catheter

    6.4. Y-o-Y Growth Trend Analysis By Property, 2018 to 2022

    6.5. Absolute $ Opportunity Analysis By Property, 2023 to 2033

7. Global Market Analysis 2018 to 2022 and Forecast 2023 to 2033, By Design

    7.1. Introduction / Key Findings

    7.2. Historical Market Size Value (US$ Million) Analysis by Design, 2018 to 2022

    7.3. Current and Future Market Size Value (US$ Million) Analysis and Forecast by Design, 2023 to 2033

        7.3.1. Single Lumen

        7.3.2. Double Lumen

        7.3.3. Multiple Lumen

    7.4. Y-o-Y Growth Trend Analysis by Design, 2018 to 2022

    7.5. Absolute $ Opportunity Analysis by Design, 2023 to 2033

8. Global Market Analysis 2018 to 2022 and Forecast 2023 to 2033, By End User

    8.1. Introduction / Key Findings

    8.2. Historical Market Size Value (US$ Million) Analysis By End User, 2018 to 2022

    8.3. Current and Future Market Size Value (US$ Million) Analysis and Forecast By End User, 2023 to 2033

        8.3.1. Hospitals

        8.3.2. Ambulatory Surgical Centers

        8.3.3. Dialysis Centers

        8.3.4. Specialty Clinics & Others

    8.4. Y-o-Y Growth Trend Analysis By End User, 2018 to 2022

    8.5. Absolute $ Opportunity Analysis By End User, 2023 to 2033

9. Global Market Analysis 2018 to 2022 and Forecast 2023 to 2033, By Region

    9.1. Introduction

    9.2. Historical Market Size Value (US$ Million) Analysis By Region, 2018 to 2022

    9.3. Current Market Size Value (US$ Million) Analysis and Forecast By Region, 2023 to 2033

        9.3.1. North America

        9.3.2. Latin America

        9.3.3. Western Europe

        9.3.4. Eastern Europe

        9.3.5. South Asia and Pacific

        9.3.6. East Asia

        9.3.7. Middle East and Africa

    9.4. Market Attractiveness Analysis By Region

10. North America Market Analysis 2018 to 2022 and Forecast 2023 to 2033, By Country

    10.1. Historical Market Size Value (US$ Million) Trend Analysis By Market Taxonomy, 2018 to 2022

    10.2. Market Size Value (US$ Million) Forecast By Market Taxonomy, 2023 to 2033

        10.2.1. By Country

            10.2.1.1. The USA

            10.2.1.2. Canada

        10.2.2. By Product

        10.2.3. By Property

        10.2.4. By Design

        10.2.5. By End User

    10.3. Market Attractiveness Analysis

        10.3.1. By Country

        10.3.2. By Product

        10.3.3. By Property

        10.3.4. By Design

        10.3.5. By End User

    10.4. Key Takeaways

11. Latin America Market Analysis 2018 to 2022 and Forecast 2023 to 2033, By Country

    11.1. Historical Market Size Value (US$ Million) Trend Analysis By Market Taxonomy, 2018 to 2022

    11.2. Market Size Value (US$ Million) Forecast By Market Taxonomy, 2023 to 2033

        11.2.1. By Country

            11.2.1.1. Brazil

            11.2.1.2. Mexico

            11.2.1.3. Rest of Latin America

        11.2.2. By Product

        11.2.3. By Property

        11.2.4. By Design

        11.2.5. By End User

    11.3. Market Attractiveness Analysis

        11.3.1. By Country

        11.3.2. By Product

        11.3.3. By Property

        11.3.4. By Design

        11.3.5. By End User

    11.4. Key Takeaways

12. Western Europe Market Analysis 2018 to 2022 and Forecast 2023 to 2033, By Country

    12.1. Historical Market Size Value (US$ Million) Trend Analysis By Market Taxonomy, 2018 to 2022

    12.2. Market Size Value (US$ Million) Forecast By Market Taxonomy, 2023 to 2033

        12.2.1. By Country

            12.2.1.1. Germany

            12.2.1.2. United Kingdom

            12.2.1.3. France

            12.2.1.4. Spain

            12.2.1.5. Italy

            12.2.1.6. Rest of Western Europe

        12.2.2. By Product

        12.2.3. By Property

        12.2.4. By Design

        12.2.5. By End User

    12.3. Market Attractiveness Analysis

        12.3.1. By Country

        12.3.2. By Product

        12.3.3. By Property

        12.3.4. By Design

        12.3.5. By End User

    12.4. Key Takeaways

13. Eastern Europe Market Analysis 2018 to 2022 and Forecast 2023 to 2033, By Country

    13.1. Historical Market Size Value (US$ Million) Trend Analysis By Market Taxonomy, 2018 to 2022

    13.2. Market Size Value (US$ Million) Forecast By Market Taxonomy, 2023 to 2033

        13.2.1. By Country

            13.2.1.1. Poland

            13.2.1.2. Russia

            13.2.1.3. Czech Republic

            13.2.1.4. Romania

            13.2.1.5. Rest of Eastern Europe

        13.2.2. By Product

        13.2.3. By Property

        13.2.4. By Design

        13.2.5. By End User

    13.3. Market Attractiveness Analysis

        13.3.1. By Country

        13.3.2. By Product

        13.3.3. By Property

        13.3.4. By Design

        13.3.5. By End User

    13.4. Key Takeaways

14. South Asia and Pacific Market Analysis 2018 to 2022 and Forecast 2023 to 2033, By Country

    14.1. Historical Market Size Value (US$ Million) Trend Analysis By Market Taxonomy, 2018 to 2022

    14.2. Market Size Value (US$ Million) Forecast By Market Taxonomy, 2023 to 2033

        14.2.1. By Country

            14.2.1.1. India

            14.2.1.2. Bangladesh

            14.2.1.3. Australia

            14.2.1.4. New Zealand

            14.2.1.5. Rest of South Asia and Pacific

        14.2.2. By Product

        14.2.3. By Property

        14.2.4. By Design

        14.2.5. By End User

    14.3. Market Attractiveness Analysis

        14.3.1. By Country

        14.3.2. By Product

        14.3.3. By Property

        14.3.4. By Design

        14.3.5. By End User

    14.4. Key Takeaways

15. East Asia Market Analysis 2018 to 2022 and Forecast 2023 to 2033, By Country

    15.1. Historical Market Size Value (US$ Million) Trend Analysis By Market Taxonomy, 2018 to 2022

    15.2. Market Size Value (US$ Million) Forecast By Market Taxonomy, 2023 to 2033

        15.2.1. By Country

            15.2.1.1. China

            15.2.1.2. Japan

            15.2.1.3. South Korea

        15.2.2. By Product

        15.2.3. By Property

        15.2.4. By Design

        15.2.5. By End User

    15.3. Market Attractiveness Analysis

        15.3.1. By Country

        15.3.2. By Product

        15.3.3. By Property

        15.3.4. By Design

        15.3.5. By End User

    15.4. Key Takeaways

16. Middle East and Africa Market Analysis 2018 to 2022 and Forecast 2023 to 2033, By Country

    16.1. Historical Market Size Value (US$ Million) Trend Analysis By Market Taxonomy, 2018 to 2022

    16.2. Market Size Value (US$ Million) Forecast By Market Taxonomy, 2023 to 2033

        16.2.1. By Country

            16.2.1.1. GCC Countries

            16.2.1.2. South Africa

            16.2.1.3. Israel

            16.2.1.4. Rest of MEA

        16.2.2. By Product

        16.2.3. By Property

        16.2.4. By Design

        16.2.5. By End User

    16.3. Market Attractiveness Analysis

        16.3.1. By Country

        16.3.2. By Product

        16.3.3. By Property

        16.3.4. By Design

        16.3.5. By End User

    16.4. Key Takeaways

17. Key Countries Market Analysis

    17.1. USA

        17.1.1. Pricing Analysis

        17.1.2. Market Share Analysis, 2022

            17.1.2.1. By Product

            17.1.2.2. By Property

            17.1.2.3. By Design

            17.1.2.4. By End User

    17.2. Canada

        17.2.1. Pricing Analysis

        17.2.2. Market Share Analysis, 2022

            17.2.2.1. By Product

            17.2.2.2. By Property

            17.2.2.3. By Design

            17.2.2.4. By End User

    17.3. Brazil

        17.3.1. Pricing Analysis

        17.3.2. Market Share Analysis, 2022

            17.3.2.1. By Product

            17.3.2.2. By Property

            17.3.2.3. By Design

            17.3.2.4. By End User

    17.4. Mexico

        17.4.1. Pricing Analysis

        17.4.2. Market Share Analysis, 2022

            17.4.2.1. By Product

            17.4.2.2. By Property

            17.4.2.3. By Design

            17.4.2.4. By End User

    17.5. Germany

        17.5.1. Pricing Analysis

        17.5.2. Market Share Analysis, 2022

            17.5.2.1. By Product

            17.5.2.2. By Property

            17.5.2.3. By Design

            17.5.2.4. By End User

    17.6. United Kingdom

        17.6.1. Pricing Analysis

        17.6.2. Market Share Analysis, 2022

            17.6.2.1. By Product

            17.6.2.2. By Property

            17.6.2.3. By Design

            17.6.2.4. By End User

    17.7. France

        17.7.1. Pricing Analysis

        17.7.2. Market Share Analysis, 2022

            17.7.2.1. By Product

            17.7.2.2. By Property

            17.7.2.3. By Design

            17.7.2.4. By End User

    17.8. Spain

        17.8.1. Pricing Analysis

        17.8.2. Market Share Analysis, 2022

            17.8.2.1. By Product

            17.8.2.2. By Property

            17.8.2.3. By Design

            17.8.2.4. By End User

    17.9. Italy

        17.9.1. Pricing Analysis

        17.9.2. Market Share Analysis, 2022

            17.9.2.1. By Product

            17.9.2.2. By Property

            17.9.2.3. By Design

            17.9.2.4. By End User

    17.10. Poland

        17.10.1. Pricing Analysis

        17.10.2. Market Share Analysis, 2022

            17.10.2.1. By Product

            17.10.2.2. By Property

            17.10.2.3. By Design

            17.10.2.4. By End User

    17.11. Russia

        17.11.1. Pricing Analysis

        17.11.2. Market Share Analysis, 2022

            17.11.2.1. By Product

            17.11.2.2. By Property

            17.11.2.3. By Design

            17.11.2.4. By End User

    17.12. Czech Republic

        17.12.1. Pricing Analysis

        17.12.2. Market Share Analysis, 2022

            17.12.2.1. By Product

            17.12.2.2. By Property

            17.12.2.3. By Design

            17.12.2.4. By End User

    17.13. Romania

        17.13.1. Pricing Analysis

        17.13.2. Market Share Analysis, 2022

            17.13.2.1. By Product

            17.13.2.2. By Property

            17.13.2.3. By Design

            17.13.2.4. By End User

    17.14. India

        17.14.1. Pricing Analysis

        17.14.2. Market Share Analysis, 2022

            17.14.2.1. By Product

            17.14.2.2. By Property

            17.14.2.3. By Design

            17.14.2.4. By End User

    17.15. Bangladesh

        17.15.1. Pricing Analysis

        17.15.2. Market Share Analysis, 2022

            17.15.2.1. By Product

            17.15.2.2. By Property

            17.15.2.3. By Design

            17.15.2.4. By End User

    17.16. Australia

        17.16.1. Pricing Analysis

        17.16.2. Market Share Analysis, 2022

            17.16.2.1. By Product

            17.16.2.2. By Property

            17.16.2.3. By Design

            17.16.2.4. By End User

    17.17. New Zealand

        17.17.1. Pricing Analysis

        17.17.2. Market Share Analysis, 2022

            17.17.2.1. By Product

            17.17.2.2. By Property

            17.17.2.3. By Design

            17.17.2.4. By End User

    17.18. China

        17.18.1. Pricing Analysis

        17.18.2. Market Share Analysis, 2022

            17.18.2.1. By Product

            17.18.2.2. By Property

            17.18.2.3. By Design

            17.18.2.4. By End User

    17.19. Japan

        17.19.1. Pricing Analysis

        17.19.2. Market Share Analysis, 2022

            17.19.2.1. By Product

            17.19.2.2. By Property

            17.19.2.3. By Design

            17.19.2.4. By End User

    17.20. South Korea

        17.20.1. Pricing Analysis

        17.20.2. Market Share Analysis, 2022

            17.20.2.1. By Product

            17.20.2.2. By Property

            17.20.2.3. By Design

            17.20.2.4. By End User

    17.21. GCC Countries

        17.21.1. Pricing Analysis

        17.21.2. Market Share Analysis, 2022

            17.21.2.1. By Product

            17.21.2.2. By Property

            17.21.2.3. By Design

            17.21.2.4. By End User

    17.22. South Africa

        17.22.1. Pricing Analysis

        17.22.2. Market Share Analysis, 2022

            17.22.2.1. By Product

            17.22.2.2. By Property

            17.22.2.3. By Design

            17.22.2.4. By End User

    17.23. Israel

        17.23.1. Pricing Analysis

        17.23.2. Market Share Analysis, 2022

            17.23.2.1. By Product

            17.23.2.2. By Property

            17.23.2.3. By Design

            17.23.2.4. By End User

18. Market Structure Analysis

    18.1. Competition Dashboard

    18.2. Competition Benchmarking

    18.3. Market Share Analysis of Top Players

        18.3.1. By Regional

        18.3.2. By Product

        18.3.3. By Property

        18.3.4. By Design

        18.3.5. By End User

19. Competition Analysis

    19.1. Competition Deep Dive

        19.1.1. Angio Dynamics

            19.1.1.1. Overview

            19.1.1.2. Product Portfolio

            19.1.1.3. Profitability by Market Segments

            19.1.1.4. Sales Footprint

            19.1.1.5. Strategy Overview

                19.1.1.5.1. Marketing Strategy

        19.1.2. C.R. Bard

            19.1.2.1. Overview

            19.1.2.2. Product Portfolio

            19.1.2.3. Profitability by Market Segments

            19.1.2.4. Sales Footprint

            19.1.2.5. Strategy Overview

                19.1.2.5.1. Marketing Strategy

        19.1.3. Teleflex Incorporated

            19.1.3.1. Overview

            19.1.3.2. Product Portfolio

            19.1.3.3. Profitability by Market Segments

            19.1.3.4. Sales Footprint

            19.1.3.5. Strategy Overview

                19.1.3.5.1. Marketing Strategy

        19.1.4. B. Braun Melsungen AG

            19.1.4.1. Overview

            19.1.4.2. Product Portfolio

            19.1.4.3. Profitability by Market Segments

            19.1.4.4. Sales Footprint

            19.1.4.5. Strategy Overview

                19.1.4.5.1. Marketing Strategy

        19.1.5. Kimal Healthcare

            19.1.5.1. Overview

            19.1.5.2. Product Portfolio

            19.1.5.3. Profitability by Market Segments

            19.1.5.4. Sales Footprint

            19.1.5.5. Strategy Overview

                19.1.5.5.1. Marketing Strategy

        19.1.6. Come B.V.

            19.1.6.1. Overview

            19.1.6.2. Product Portfolio

            19.1.6.3. Profitability by Market Segments

            19.1.6.4. Sales Footprint

            19.1.6.5. Strategy Overview

                19.1.6.5.1. Marketing Strategy

        19.1.7. Medtronic Plc

            19.1.7.1. Overview

            19.1.7.2. Product Portfolio

            19.1.7.3. Profitability by Market Segments

            19.1.7.4. Sales Footprint

            19.1.7.5. Strategy Overview

                19.1.7.5.1. Marketing Strategy

        19.1.8. Smiths Medical

            19.1.8.1. Overview

            19.1.8.2. Product Portfolio

            19.1.8.3. Profitability by Market Segments

            19.1.8.4. Sales Footprint

            19.1.8.5. Strategy Overview

                19.1.8.5.1. Marketing Strategy

        19.1.9. Vygon (UK) Ltd

            19.1.9.1. Overview

            19.1.9.2. Product Portfolio

            19.1.9.3. Profitability by Market Segments

            19.1.9.4. Sales Footprint

            19.1.9.5. Strategy Overview

                19.1.9.5.1. Marketing Strategy

        19.1.10. Becton, Dickinson, and Company

            19.1.10.1. Overview

            19.1.10.2. Product Portfolio

            19.1.10.3. Profitability by Market Segments

            19.1.10.4. Sales Footprint

            19.1.10.5. Strategy Overview

                19.1.10.5.1. Marketing Strategy

        19.1.11. Argon Medical Devices, Inc.

            19.1.11.1. Overview

            19.1.11.2. Product Portfolio

            19.1.11.3. Profitability by Market Segments

            19.1.11.4. Sales Footprint

            19.1.11.5. Strategy Overview

                19.1.11.5.1. Marketing Strategy

        19.1.12. Boston Scientific Corporation

            19.1.12.1. Overview

            19.1.12.2. Product Portfolio

            19.1.12.3. Profitability by Market Segments

            19.1.12.4. Sales Footprint

            19.1.12.5. Strategy Overview

                19.1.12.5.1. Marketing Strategy

        19.1.13. Cook Medical Incorporated

            19.1.13.1. Overview

            19.1.13.2. Product Portfolio

            19.1.13.3. Profitability by Market Segments

            19.1.13.4. Sales Footprint

            19.1.13.5. Strategy Overview

                19.1.13.5.1. Marketing Strategy

        19.1.14. Medical Components, Inc.

            19.1.14.1. Overview

            19.1.14.2. Product Portfolio

            19.1.14.3. Profitability by Market Segments

            19.1.14.4. Sales Footprint

            19.1.14.5. Strategy Overview

                19.1.14.5.1. Marketing Strategy

        19.1.15. Fresenius Kabi AG

            19.1.15.1. Overview

            19.1.15.2. Product Portfolio

            19.1.15.3. Profitability by Market Segments

            19.1.15.4. Sales Footprint

            19.1.15.5. Strategy Overview

                19.1.15.5.1. Marketing Strategy

20. Assumptions & Acronyms Used

21. Research Methodology

Don't pay for what you don't need

Customize your report by selecting specific countries or regions and save 30%!

List of Tables

Table 1: Global Market Value (US$ Million) Forecast by Region, 2018 to 2033

Table 2: Global Market Value (US$ Million) Forecast by Product, 2018 to 2033

Table 3: Global Market Value (US$ Million) Forecast by Property, 2018 to 2033

Table 4: Global Market Value (US$ Million) Forecast by Design, 2018 to 2033

Table 5: Global Market Value (US$ Million) Forecast by End User, 2018 to 2033

Table 6: North America Market Value (US$ Million) Forecast by Country, 2018 to 2033

Table 7: North America Market Value (US$ Million) Forecast by Product, 2018 to 2033

Table 8: North America Market Value (US$ Million) Forecast by Property, 2018 to 2033

Table 9: North America Market Value (US$ Million) Forecast by Design, 2018 to 2033

Table 10: North America Market Value (US$ Million) Forecast by End User, 2018 to 2033

Table 11: Latin America Market Value (US$ Million) Forecast by Country, 2018 to 2033

Table 12: Latin America Market Value (US$ Million) Forecast by Product, 2018 to 2033

Table 13: Latin America Market Value (US$ Million) Forecast by Property, 2018 to 2033

Table 14: Latin America Market Value (US$ Million) Forecast by Design, 2018 to 2033

Table 15: Latin America Market Value (US$ Million) Forecast by End User, 2018 to 2033

Table 16: Western Europe Market Value (US$ Million) Forecast by Country, 2018 to 2033

Table 17: Western Europe Market Value (US$ Million) Forecast by Product, 2018 to 2033

Table 18: Western Europe Market Value (US$ Million) Forecast by Property, 2018 to 2033

Table 19: Western Europe Market Value (US$ Million) Forecast by Design, 2018 to 2033

Table 20: Western Europe Market Value (US$ Million) Forecast by End User, 2018 to 2033

Table 21: Eastern Europe Market Value (US$ Million) Forecast by Country, 2018 to 2033

Table 22: Eastern Europe Market Value (US$ Million) Forecast by Product, 2018 to 2033

Table 23: Eastern Europe Market Value (US$ Million) Forecast by Property, 2018 to 2033

Table 24: Eastern Europe Market Value (US$ Million) Forecast by Design, 2018 to 2033

Table 25: Eastern Europe Market Value (US$ Million) Forecast by End User, 2018 to 2033

Table 26: South Asia and Pacific Market Value (US$ Million) Forecast by Country, 2018 to 2033

Table 27: South Asia and Pacific Market Value (US$ Million) Forecast by Product, 2018 to 2033

Table 28: South Asia and Pacific Market Value (US$ Million) Forecast by Property, 2018 to 2033

Table 29: South Asia and Pacific Market Value (US$ Million) Forecast by Design, 2018 to 2033

Table 30: South Asia and Pacific Market Value (US$ Million) Forecast by End User, 2018 to 2033

Table 31: East Asia Market Value (US$ Million) Forecast by Country, 2018 to 2033

Table 32: East Asia Market Value (US$ Million) Forecast by Product, 2018 to 2033

Table 33: East Asia Market Value (US$ Million) Forecast by Property, 2018 to 2033

Table 34: East Asia Market Value (US$ Million) Forecast by Design, 2018 to 2033

Table 35: East Asia Market Value (US$ Million) Forecast by End User, 2018 to 2033

Table 36: Middle East and Africa Market Value (US$ Million) Forecast by Country, 2018 to 2033

Table 37: Middle East and Africa Market Value (US$ Million) Forecast by Product, 2018 to 2033

Table 38: Middle East and Africa Market Value (US$ Million) Forecast by Property, 2018 to 2033

Table 39: Middle East and Africa Market Value (US$ Million) Forecast by Design, 2018 to 2033

Table 40: Middle East and Africa Market Value (US$ Million) Forecast by End User, 2018 to 2033
Sabyasachi Ghosh
Sabyasachi Ghosh

Principal Consultant

Talk to Analyst

Find your sweet spots for generating winning opportunities in this market.

List of Charts

Figure 1: Global Market Value (US$ Million) by Product, 2023 to 2033

Figure 2: Global Market Value (US$ Million) by Property, 2023 to 2033

Figure 3: Global Market Value (US$ Million) by Design, 2023 to 2033

Figure 4: Global Market Value (US$ Million) by End User, 2023 to 2033

Figure 5: Global Market Value (US$ Million) by Region, 2023 to 2033

Figure 6: Global Market Value (US$ Million) Analysis by Region, 2018 to 2033

Figure 7: Global Market Value Share (%) and BPS Analysis by Region, 2023 to 2033

Figure 8: Global Market Y-o-Y Growth (%) Projections by Region, 2023 to 2033

Figure 9: Global Market Value (US$ Million) Analysis by Product, 2018 to 2033

Figure 10: Global Market Value Share (%) and BPS Analysis by Product, 2023 to 2033

Figure 11: Global Market Y-o-Y Growth (%) Projections by Product, 2023 to 2033

Figure 12: Global Market Value (US$ Million) Analysis by Property, 2018 to 2033

Figure 13: Global Market Value Share (%) and BPS Analysis by Property, 2023 to 2033

Figure 14: Global Market Y-o-Y Growth (%) Projections by Property, 2023 to 2033

Figure 15: Global Market Value (US$ Million) Analysis by Design, 2018 to 2033

Figure 16: Global Market Value Share (%) and BPS Analysis by Design, 2023 to 2033

Figure 17: Global Market Y-o-Y Growth (%) Projections by Design, 2023 to 2033

Figure 18: Global Market Value (US$ Million) Analysis by End User, 2018 to 2033

Figure 19: Global Market Value Share (%) and BPS Analysis by End User, 2023 to 2033

Figure 20: Global Market Y-o-Y Growth (%) Projections by End User, 2023 to 2033

Figure 21: Global Market Attractiveness by Product, 2023 to 2033

Figure 22: Global Market Attractiveness by Property, 2023 to 2033

Figure 23: Global Market Attractiveness by Design, 2023 to 2033

Figure 24: Global Market Attractiveness by End User, 2023 to 2033

Figure 25: Global Market Attractiveness by Region, 2023 to 2033

Figure 26: North America Market Value (US$ Million) by Product, 2023 to 2033

Figure 27: North America Market Value (US$ Million) by Property, 2023 to 2033

Figure 28: North America Market Value (US$ Million) by Design, 2023 to 2033

Figure 29: North America Market Value (US$ Million) by End User, 2023 to 2033

Figure 30: North America Market Value (US$ Million) by Country, 2023 to 2033

Figure 31: North America Market Value (US$ Million) Analysis by Country, 2018 to 2033

Figure 32: North America Market Value Share (%) and BPS Analysis by Country, 2023 to 2033

Figure 33: North America Market Y-o-Y Growth (%) Projections by Country, 2023 to 2033

Figure 34: North America Market Value (US$ Million) Analysis by Product, 2018 to 2033

Figure 35: North America Market Value Share (%) and BPS Analysis by Product, 2023 to 2033

Figure 36: North America Market Y-o-Y Growth (%) Projections by Product, 2023 to 2033

Figure 37: North America Market Value (US$ Million) Analysis by Property, 2018 to 2033

Figure 38: North America Market Value Share (%) and BPS Analysis by Property, 2023 to 2033

Figure 39: North America Market Y-o-Y Growth (%) Projections by Property, 2023 to 2033

Figure 40: North America Market Value (US$ Million) Analysis by Design, 2018 to 2033

Figure 41: North America Market Value Share (%) and BPS Analysis by Design, 2023 to 2033

Figure 42: North America Market Y-o-Y Growth (%) Projections by Design, 2023 to 2033

Figure 43: North America Market Value (US$ Million) Analysis by End User, 2018 to 2033

Figure 44: North America Market Value Share (%) and BPS Analysis by End User, 2023 to 2033

Figure 45: North America Market Y-o-Y Growth (%) Projections by End User, 2023 to 2033

Figure 46: North America Market Attractiveness by Product, 2023 to 2033

Figure 47: North America Market Attractiveness by Property, 2023 to 2033

Figure 48: North America Market Attractiveness by Design, 2023 to 2033

Figure 49: North America Market Attractiveness by End User, 2023 to 2033

Figure 50: North America Market Attractiveness by Country, 2023 to 2033

Figure 51: Latin America Market Value (US$ Million) by Product, 2023 to 2033

Figure 52: Latin America Market Value (US$ Million) by Property, 2023 to 2033

Figure 53: Latin America Market Value (US$ Million) by Design, 2023 to 2033

Figure 54: Latin America Market Value (US$ Million) by End User, 2023 to 2033

Figure 55: Latin America Market Value (US$ Million) by Country, 2023 to 2033

Figure 56: Latin America Market Value (US$ Million) Analysis by Country, 2018 to 2033

Figure 57: Latin America Market Value Share (%) and BPS Analysis by Country, 2023 to 2033

Figure 58: Latin America Market Y-o-Y Growth (%) Projections by Country, 2023 to 2033

Figure 59: Latin America Market Value (US$ Million) Analysis by Product, 2018 to 2033

Figure 60: Latin America Market Value Share (%) and BPS Analysis by Product, 2023 to 2033

Figure 61: Latin America Market Y-o-Y Growth (%) Projections by Product, 2023 to 2033

Figure 62: Latin America Market Value (US$ Million) Analysis by Property, 2018 to 2033

Figure 63: Latin America Market Value Share (%) and BPS Analysis by Property, 2023 to 2033

Figure 64: Latin America Market Y-o-Y Growth (%) Projections by Property, 2023 to 2033

Figure 65: Latin America Market Value (US$ Million) Analysis by Design, 2018 to 2033

Figure 66: Latin America Market Value Share (%) and BPS Analysis by Design, 2023 to 2033

Figure 67: Latin America Market Y-o-Y Growth (%) Projections by Design, 2023 to 2033

Figure 68: Latin America Market Value (US$ Million) Analysis by End User, 2018 to 2033

Figure 69: Latin America Market Value Share (%) and BPS Analysis by End User, 2023 to 2033

Figure 70: Latin America Market Y-o-Y Growth (%) Projections by End User, 2023 to 2033

Figure 71: Latin America Market Attractiveness by Product, 2023 to 2033

Figure 72: Latin America Market Attractiveness by Property, 2023 to 2033

Figure 73: Latin America Market Attractiveness by Design, 2023 to 2033

Figure 74: Latin America Market Attractiveness by End User, 2023 to 2033

Figure 75: Latin America Market Attractiveness by Country, 2023 to 2033

Figure 76: Western Europe Market Value (US$ Million) by Product, 2023 to 2033

Figure 77: Western Europe Market Value (US$ Million) by Property, 2023 to 2033

Figure 78: Western Europe Market Value (US$ Million) by Design, 2023 to 2033

Figure 79: Western Europe Market Value (US$ Million) by End User, 2023 to 2033

Figure 80: Western Europe Market Value (US$ Million) by Country, 2023 to 2033

Figure 81: Western Europe Market Value (US$ Million) Analysis by Country, 2018 to 2033

Figure 82: Western Europe Market Value Share (%) and BPS Analysis by Country, 2023 to 2033

Figure 83: Western Europe Market Y-o-Y Growth (%) Projections by Country, 2023 to 2033

Figure 84: Western Europe Market Value (US$ Million) Analysis by Product, 2018 to 2033

Figure 85: Western Europe Market Value Share (%) and BPS Analysis by Product, 2023 to 2033

Figure 86: Western Europe Market Y-o-Y Growth (%) Projections by Product, 2023 to 2033

Figure 87: Western Europe Market Value (US$ Million) Analysis by Property, 2018 to 2033

Figure 88: Western Europe Market Value Share (%) and BPS Analysis by Property, 2023 to 2033

Figure 89: Western Europe Market Y-o-Y Growth (%) Projections by Property, 2023 to 2033

Figure 90: Western Europe Market Value (US$ Million) Analysis by Design, 2018 to 2033

Figure 91: Western Europe Market Value Share (%) and BPS Analysis by Design, 2023 to 2033

Figure 92: Western Europe Market Y-o-Y Growth (%) Projections by Design, 2023 to 2033

Figure 93: Western Europe Market Value (US$ Million) Analysis by End User, 2018 to 2033

Figure 94: Western Europe Market Value Share (%) and BPS Analysis by End User, 2023 to 2033

Figure 95: Western Europe Market Y-o-Y Growth (%) Projections by End User, 2023 to 2033

Figure 96: Western Europe Market Attractiveness by Product, 2023 to 2033

Figure 97: Western Europe Market Attractiveness by Property, 2023 to 2033

Figure 98: Western Europe Market Attractiveness by Design, 2023 to 2033

Figure 99: Western Europe Market Attractiveness by End User, 2023 to 2033

Figure 100: Western Europe Market Attractiveness by Country, 2023 to 2033

Figure 101: Eastern Europe Market Value (US$ Million) by Product, 2023 to 2033

Figure 102: Eastern Europe Market Value (US$ Million) by Property, 2023 to 2033

Figure 103: Eastern Europe Market Value (US$ Million) by Design, 2023 to 2033

Figure 104: Eastern Europe Market Value (US$ Million) by End User, 2023 to 2033

Figure 105: Eastern Europe Market Value (US$ Million) by Country, 2023 to 2033

Figure 106: Eastern Europe Market Value (US$ Million) Analysis by Country, 2018 to 2033

Figure 107: Eastern Europe Market Value Share (%) and BPS Analysis by Country, 2023 to 2033

Figure 108: Eastern Europe Market Y-o-Y Growth (%) Projections by Country, 2023 to 2033

Figure 109: Eastern Europe Market Value (US$ Million) Analysis by Product, 2018 to 2033

Figure 110: Eastern Europe Market Value Share (%) and BPS Analysis by Product, 2023 to 2033

Figure 111: Eastern Europe Market Y-o-Y Growth (%) Projections by Product, 2023 to 2033

Figure 112: Eastern Europe Market Value (US$ Million) Analysis by Property, 2018 to 2033

Figure 113: Eastern Europe Market Value Share (%) and BPS Analysis by Property, 2023 to 2033

Figure 114: Eastern Europe Market Y-o-Y Growth (%) Projections by Property, 2023 to 2033

Figure 115: Eastern Europe Market Value (US$ Million) Analysis by Design, 2018 to 2033

Figure 116: Eastern Europe Market Value Share (%) and BPS Analysis by Design, 2023 to 2033

Figure 117: Eastern Europe Market Y-o-Y Growth (%) Projections by Design, 2023 to 2033

Figure 118: Eastern Europe Market Value (US$ Million) Analysis by End User, 2018 to 2033

Figure 119: Eastern Europe Market Value Share (%) and BPS Analysis by End User, 2023 to 2033

Figure 120: Eastern Europe Market Y-o-Y Growth (%) Projections by End User, 2023 to 2033

Figure 121: Eastern Europe Market Attractiveness by Product, 2023 to 2033

Figure 122: Eastern Europe Market Attractiveness by Property, 2023 to 2033

Figure 123: Eastern Europe Market Attractiveness by Design, 2023 to 2033

Figure 124: Eastern Europe Market Attractiveness by End User, 2023 to 2033

Figure 125: Eastern Europe Market Attractiveness by Country, 2023 to 2033

Figure 126: South Asia and Pacific Market Value (US$ Million) by Product, 2023 to 2033

Figure 127: South Asia and Pacific Market Value (US$ Million) by Property, 2023 to 2033

Figure 128: South Asia and Pacific Market Value (US$ Million) by Design, 2023 to 2033

Figure 129: South Asia and Pacific Market Value (US$ Million) by End User, 2023 to 2033

Figure 130: South Asia and Pacific Market Value (US$ Million) by Country, 2023 to 2033

Figure 131: South Asia and Pacific Market Value (US$ Million) Analysis by Country, 2018 to 2033

Figure 132: South Asia and Pacific Market Value Share (%) and BPS Analysis by Country, 2023 to 2033

Figure 133: South Asia and Pacific Market Y-o-Y Growth (%) Projections by Country, 2023 to 2033

Figure 134: South Asia and Pacific Market Value (US$ Million) Analysis by Product, 2018 to 2033

Figure 135: South Asia and Pacific Market Value Share (%) and BPS Analysis by Product, 2023 to 2033

Figure 136: South Asia and Pacific Market Y-o-Y Growth (%) Projections by Product, 2023 to 2033

Figure 137: South Asia and Pacific Market Value (US$ Million) Analysis by Property, 2018 to 2033

Figure 138: South Asia and Pacific Market Value Share (%) and BPS Analysis by Property, 2023 to 2033

Figure 139: South Asia and Pacific Market Y-o-Y Growth (%) Projections by Property, 2023 to 2033

Figure 140: South Asia and Pacific Market Value (US$ Million) Analysis by Design, 2018 to 2033

Figure 141: South Asia and Pacific Market Value Share (%) and BPS Analysis by Design, 2023 to 2033

Figure 142: South Asia and Pacific Market Y-o-Y Growth (%) Projections by Design, 2023 to 2033

Figure 143: South Asia and Pacific Market Value (US$ Million) Analysis by End User, 2018 to 2033

Figure 144: South Asia and Pacific Market Value Share (%) and BPS Analysis by End User, 2023 to 2033

Figure 145: South Asia and Pacific Market Y-o-Y Growth (%) Projections by End User, 2023 to 2033

Figure 146: South Asia and Pacific Market Attractiveness by Product, 2023 to 2033

Figure 147: South Asia and Pacific Market Attractiveness by Property, 2023 to 2033

Figure 148: South Asia and Pacific Market Attractiveness by Design, 2023 to 2033

Figure 149: South Asia and Pacific Market Attractiveness by End User, 2023 to 2033

Figure 150: South Asia and Pacific Market Attractiveness by Country, 2023 to 2033

Figure 151: East Asia Market Value (US$ Million) by Product, 2023 to 2033

Figure 152: East Asia Market Value (US$ Million) by Property, 2023 to 2033

Figure 153: East Asia Market Value (US$ Million) by Design, 2023 to 2033

Figure 154: East Asia Market Value (US$ Million) by End User, 2023 to 2033

Figure 155: East Asia Market Value (US$ Million) by Country, 2023 to 2033

Figure 156: East Asia Market Value (US$ Million) Analysis by Country, 2018 to 2033

Figure 157: East Asia Market Value Share (%) and BPS Analysis by Country, 2023 to 2033

Figure 158: East Asia Market Y-o-Y Growth (%) Projections by Country, 2023 to 2033

Figure 159: East Asia Market Value (US$ Million) Analysis by Product, 2018 to 2033

Figure 160: East Asia Market Value Share (%) and BPS Analysis by Product, 2023 to 2033

Figure 161: East Asia Market Y-o-Y Growth (%) Projections by Product, 2023 to 2033

Figure 162: East Asia Market Value (US$ Million) Analysis by Property, 2018 to 2033

Figure 163: East Asia Market Value Share (%) and BPS Analysis by Property, 2023 to 2033

Figure 164: East Asia Market Y-o-Y Growth (%) Projections by Property, 2023 to 2033

Figure 165: East Asia Market Value (US$ Million) Analysis by Design, 2018 to 2033

Figure 166: East Asia Market Value Share (%) and BPS Analysis by Design, 2023 to 2033

Figure 167: East Asia Market Y-o-Y Growth (%) Projections by Design, 2023 to 2033

Figure 168: East Asia Market Value (US$ Million) Analysis by End User, 2018 to 2033

Figure 169: East Asia Market Value Share (%) and BPS Analysis by End User, 2023 to 2033

Figure 170: East Asia Market Y-o-Y Growth (%) Projections by End User, 2023 to 2033

Figure 171: East Asia Market Attractiveness by Product, 2023 to 2033

Figure 172: East Asia Market Attractiveness by Property, 2023 to 2033

Figure 173: East Asia Market Attractiveness by Design, 2023 to 2033

Figure 174: East Asia Market Attractiveness by End User, 2023 to 2033

Figure 175: East Asia Market Attractiveness by Country, 2023 to 2033

Figure 176: Middle East and Africa Market Value (US$ Million) by Product, 2023 to 2033

Figure 177: Middle East and Africa Market Value (US$ Million) by Property, 2023 to 2033

Figure 178: Middle East and Africa Market Value (US$ Million) by Design, 2023 to 2033

Figure 179: Middle East and Africa Market Value (US$ Million) by End User, 2023 to 2033

Figure 180: Middle East and Africa Market Value (US$ Million) by Country, 2023 to 2033

Figure 181: Middle East and Africa Market Value (US$ Million) Analysis by Country, 2018 to 2033

Figure 182: Middle East and Africa Market Value Share (%) and BPS Analysis by Country, 2023 to 2033

Figure 183: Middle East and Africa Market Y-o-Y Growth (%) Projections by Country, 2023 to 2033

Figure 184: Middle East and Africa Market Value (US$ Million) Analysis by Product, 2018 to 2033

Figure 185: Middle East and Africa Market Value Share (%) and BPS Analysis by Product, 2023 to 2033

Figure 186: Middle East and Africa Market Y-o-Y Growth (%) Projections by Product, 2023 to 2033

Figure 187: Middle East and Africa Market Value (US$ Million) Analysis by Property, 2018 to 2033

Figure 188: Middle East and Africa Market Value Share (%) and BPS Analysis by Property, 2023 to 2033

Figure 189: Middle East and Africa Market Y-o-Y Growth (%) Projections by Property, 2023 to 2033

Figure 190: Middle East and Africa Market Value (US$ Million) Analysis by Design, 2018 to 2033

Figure 191: Middle East and Africa Market Value Share (%) and BPS Analysis by Design, 2023 to 2033

Figure 192: Middle East and Africa Market Y-o-Y Growth (%) Projections by Design, 2023 to 2033

Figure 193: Middle East and Africa Market Value (US$ Million) Analysis by End User, 2018 to 2033

Figure 194: Middle East and Africa Market Value Share (%) and BPS Analysis by End User, 2023 to 2033

Figure 195: Middle East and Africa Market Y-o-Y Growth (%) Projections by End User, 2023 to 2033

Figure 196: Middle East and Africa Market Attractiveness by Product, 2023 to 2033

Figure 197: Middle East and Africa Market Attractiveness by Property, 2023 to 2033

Figure 198: Middle East and Africa Market Attractiveness by Design, 2023 to 2033

Figure 199: Middle East and Africa Market Attractiveness by End User, 2023 to 2033

Figure 200: Middle East and Africa Market Attractiveness by Country, 2023 to 2033

Recommendations

Healthcare

Venous Thromboembolism Treatment Market

Published : February 2024

Explore Healthcare Insights

View Reports

Central Venous Catheter Market