

- Industry Size (2026)
- USD 1.44 Bn
- Forecast (2036)
- USD 1.85 Bn
- CAGR (2026 to 2036)
- 2.5%
Middle East and North Africa Frozen Food Market Size, Market Forecast and Outlook By FMI
The Middle East and North Africa frozen food market is expected to expand from USD 1.44 billion in 2026 to USD 1.85 billion by 2036. Demand is anticipated to register a 2.5% CAGR during the forecast period. Frozen fruits and vegetables are likely to lead with a 34.6% share, while ready-to-eat products are projected to account for 41.2% of category revenue in 2026.
Summary of the Middle East and North Africa Frozen Food Market
- Demand and Growth Drivers
- Urban lifestyles are likely to support demand for frozen meals and quick-prep foods.
- Hot climate conditions are increasing reliance on long-shelf-life food formats.
- Modern retail growth is improving freezer access across major city markets.
- Product and Segment View
- Frozen fruits and vegetables are likely to lead due to year-round availability and stable quality.
- Ready-to-eat products should retain preference as households seek convenient meal options.
- IQF formats are gaining relevance as brands protect taste and nutrient quality.
- Geography and Competitive Outlook
- GCC markets are likely to hold strong demand through premium retail and hospitality channels.
- North Africa is anticipated to gain gradually as organized retail and cold storage expand.
- Brands with halal-certified ranges and localized meal formats are likely to gain preference.
- Analyst Opinion
- Nandini Roy Choudhury, Principal Consultant for Food and Beverage at FMI, suggests, “The Middle East and North Africa frozen food market is moving toward convenient formats that match urban household needs. Companies with strong cold chain access, localized product development, and trusted retail placement are likely to gain better traction across frozen meals and produce categories.”
- Middle East and North Africa Frozen Food Market Value Analysis
- The Middle East and North Africa frozen food market is moving from storage convenience toward meal planning support.
- Demand is likely to improve as urban consumers seek quick food options with consistent quality.
- Product value is expected to rise through IQF produce and premium ready meals.
- Spending is anticipated to gain from cold chain investment and wider modern retail coverage.
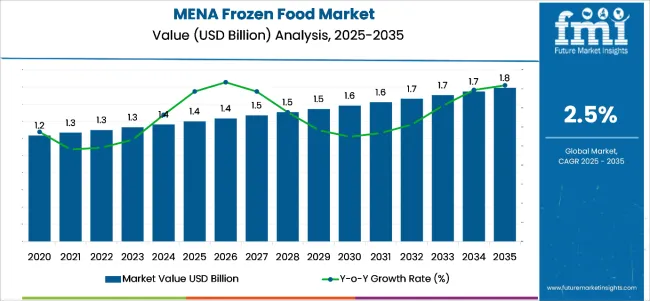
Key Takeaways, Market Size, and Forecast
| Metric | Value |
|---|---|
| Market Size (2025) | USD 1.4 Billion |
| Market Size (2026) | USD 1.44 Billion |
| Market Size (2036) | USD 1.85 Billion |
| CAGR (2026–2036) | 2.5% |
| Leading Type (2026) | Frozen Fruits And Vegetables |
| Leading Type Share (2026) | 34.6% |
| Leading Category (2026) | Ready-To-Eat Products |
| Leading Category Share (2026) | 41.2% |
| Key Growth Markets | UAE, Saudi Arabia |
Why is the Middle East and North Africa Frozen Food Market Growing?
The Middle East and North Africa frozen food market is expanding due to growth in city-based consumption, busy lifestyles, and rising demand for convenient, long-shelf-life food products without compromising quality. Frozen foods offer year-round availability of seasonal items such as fruits, vegetables, and seafood, aligning well with consumer needs in the region’s hot climate where food preservation is critical.
Growing adoption of modern retail formats, including supermarkets and hypermarkets, alongside the rapid rise of e-commerce grocery platforms, is enhancing product accessibility. Consumers are increasingly receptive to ready-to-eat and ready-to-cook frozen meals, driven by changing dietary habits and exposure to international cuisines.
Health and quality-conscious consumers are recognizing frozen food’s ability to preserve nutrients, taste, and texture, making it a viable alternative to fresh produce. Additionally, regional investments in cold chain infrastructure, advanced freezing technologies, and innovative product offerings such as fortified frozen meals and plant-based frozen options are further accelerating market penetration.
Middle East and North Africa Frozen Food Market Analysis by Top Investment Segments
The market is segmented by type, category, distribution channel, freezing technique, and country. By type, the market is divided into fruits and vegetables, meat and fish, dessert, snacks, cooked ready meals, and others (frozen bakery items, frozen sauces & gravies, mixed/variety packs, and value-added ingredient blends). Based on category, the market is classified into ready-to-eat, ready-to-cook, ready-to-drink, and others (ingredient kits, partially prepared bases, and meal components).
In terms of distribution channel, the market is segmented into supermarkets & hypermarkets, convenience stores, online channels, and others (HoReCa hotels/restaurant/cafés, specialty frozen stores, and direct-to-consumer subscription services). By freezing technique, the market is divided into blast freezing, belt freezing, individual quick freezing (IQF), and others (cryogenic/liquid nitrogen freezing, plate freezing, and tunnel freezing). By country, the market is classified into UAE, Saudi Arabia, Qatar, Kuwait, and Egypt.
By Type, Fruits & Vegetables Account for 20.0% of the Market Share
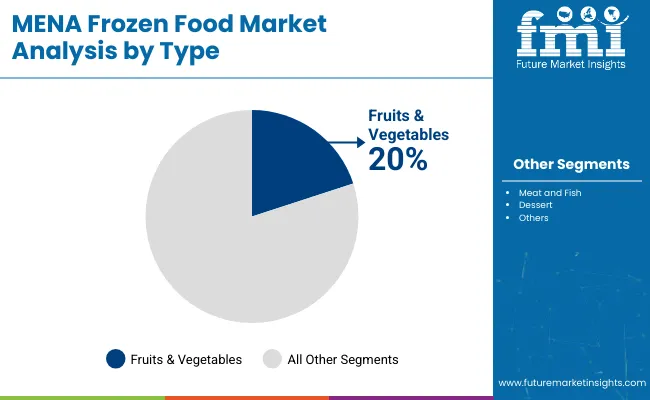
Fruits & vegetables hold the largest share in the Middle East and North Africa frozen food market at 20.0% in 2025. This segment is the most lucrative due to its steady year-round demand, lower raw material costs compared to processed meals, and strong appeal across both health-conscious and mainstream consumers. Premiumized offerings such as IQF berries, mixed vegetable blends, and blanched vegetable kits allow brands to capture higher margins than bulk frozen produce.
Growth is fueled by nutrient-retention messaging, expanded freezer space in retail, and rising foodservice usage for quick-prep menus. Seasonal availability advantages and stable pricing make it a reliable revenue driver. However, success hinges on cold-chain reliability, processing quality, and packaging choices that maintain brand trust. Strategic focus on IQF technology, traceability, and value-added SKUs can further consolidate leadership in this segment. Critical constraints include cold-chain integrity, blanching/processing quality, and packaging concerns; failures on these fronts erode margins and damage brand trust.
By Category, Ready-to-Eat (RTE) Accounts for 40.0% of the Market Share
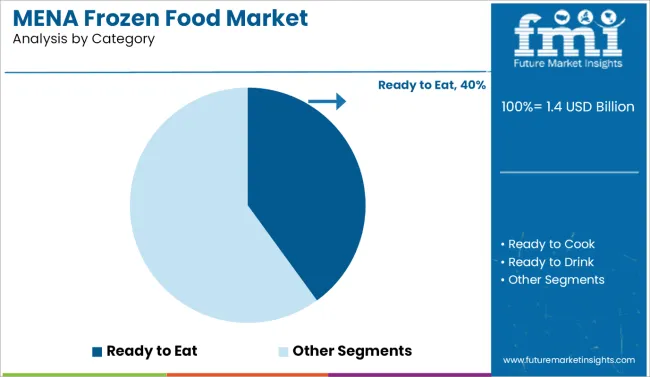
Ready-to-eat (RTE) is the most lucrative segment in the Middle East & North Africa frozen food market with a 2025 share of 40%, because it captures the intersection of high consumer willingness to pay, strong repeat purchase behavior, and favorable margin structures. RTE benefits from growth in city-based consumption, dual-income households, and accelerated e-commerce and instant-delivery adoption channels that favor convenience and premium positioning.
Product innovation (ethnic ready meals, health-focused low-salt/plant-based lines, single-serve premium bowls) supports higher ASPs and private-label substitution, while HoReCa demand for single-portion frozen solutions adds B2B volume. Operationally, RTE commands better gross margins than basic frozen vegetables due to value-added processing, specialized packaging, and branding. Key risks include cold-chain costs, regulatory labeling, and pressures around packaging; however, investments in cold-chain efficiency, recyclable packaging, and localized SKU development unlock further upside.
Middle East and North Africa Frozen Food Market Analysis by Key Countries
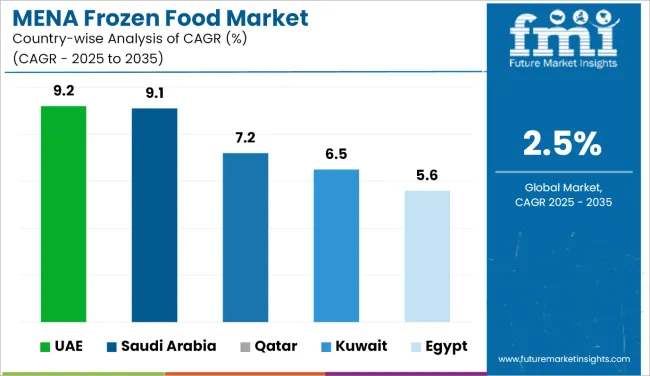
In the Middle East and North Africa frozen food market, the United Arab Emirates leads with a CAGR of 9.2%, driven by a robust expatriate population, tourism, and advanced retail infrastructure. Saudi Arabia follows closely at 9.1%, supported by Vision 2030 reforms, modern retail expansion, and a strong preference for poultry and seafood. Qatar posts a solid 7.2%, benefiting from high incomes, a premium consumer base, and post World Cup tourism momentum.
Kuwait records 6.5%, where high purchasing power and changing family structures sustain demand for premium imports and convenience foods. Egypt grows more moderately at 5.6%, propelled by population growth, affordability, and rising female workforce participation, but constrained by slower e-commerce adoption.
Market Penetration of Frozen Food Market in UAE
Sales of frozen food in UAE are expected to grow at a CAGR of 9.2% from 2025 to 2035. Rising expatriate population and busy lifestyles are driving demand for ready-to-eat and premium frozen products. Increasing retail penetration and strong cold chain infrastructure enhance product accessibility.
Tourism growth further boosts the hospitality sector's demand for frozen meats, seafood, and desserts. E-commerce grocery platforms are expanding their frozen product offerings, tapping into urban and tech-savvy consumers. Government regulations on food safety encourage high-quality imports, strengthening trust in frozen food consumption. Premiumization trends see growth in healthier and organic frozen options.
- Rising demand for convenience-based frozen food solutions.
- Growing influence of tourism on HoReCa frozen product demand.
- Expanding e-commerce channels for frozen food sales.
Consumption Growth Pathways in Saudi Arabia’s Frozen Food Market
Revenue from frozen food in Saudi Arabia will grow at a CAGR of 9.1% from 2025 to 2035. The nation’s growing working population is embracing quick-meal solutions, increasing demand for frozen ready meals and snacks. Vision 2030 initiatives boost retail modernization and food service growth. Demand for frozen poultry, fish, and ready bakery products is surging, particularly in urban centers.
Large-scale supermarket and hypermarket expansion enhances accessibility. Premium imported frozen goods are increasingly favored due to rising incomes. Investment in cold chain technology ensures minimal product spoilage during transport. Healthy frozen options are entering the mainstream as consumers adopt balanced diets.
- Rapid expansion of modern retail formats across cities.
- Vision 2030 reforms enhancing food industry investment.
- Growing urban preference for frozen poultry and seafood.
Demand Diversification Trends in Egypt’s Frozen Food Market
Demand for frozen food in Egypt is projected to expand at a CAGR of 5.6% from 2025 to 2035. Population growth and urbanization are increasing the demand for frozen vegetables, meat, and snacks. Rising female workforce participation is driving purchases of ready-to-cook products. Economic reforms have improved the retail landscape, leading to more organized outlets. Affordability remains key, with bulk-pack frozen products seeing popularity among middle-income consumers.
E-commerce penetration is slower than in Gulf markets but gradually expanding. Government campaigns on food safety are building trust in packaged frozen goods. Seasonal demand spikes occur during festive and Ramadan periods. Import reliance remains significant, particularly for frozen seafood and specialty items.
- Strong demand for affordable, bulk-pack frozen products.
- Urbanization fueling organized retail growth.
- Increased female workforce participation boosting ready-meal sales.
Retail Uptake Drivers in Qatar’s Frozen Food Market
Sales of frozen food in Qatar are expected to grow at a CAGR of 7.2% from 2025 to 2035. High disposable incomes and an expatriate-majority population support a premium frozen food segment. Demand for frozen meat, seafood, and bakery items is strong in both retail and hospitality channels. The FIFA World Cup legacy continues to boost tourism, indirectly increasing foodservice consumption. Import dependency necessitates advanced cold chain systems to maintain product quality.
Supermarkets and gourmet stores increasingly stock organic and specialty frozen foods. Online grocery platforms have become key players, offering rapid delivery for frozen goods. Government oversight on food imports ensures high safety standards. Innovation in packaging is enhancing shelf appeal and shelf life.
- Strong growth in premium frozen product categories.
- Expanding role of gourmet and specialty stores.
- Tourism legacy boosting hospitality-driven demand.
Consumer Preference Shifts in Kuwait’s Frozen Food Market
Demand for frozen food in Kuwait will grow at a CAGR of 6.5% from 2025 to 2035. Increasing working-age population and changing family structures support higher demand for ready-to-eat and ready-to-cook frozen items. High per capita income drives preference for premium imported frozen foods. The hospitality sector is expanding, fueling demand for bulk frozen ingredients. Retailers are increasingly investing in freezer space to accommodate a broader range of products. Consumer awareness of hygiene and safety in frozen foods is improving. Digital grocery platforms offer same-day delivery of frozen goods, particularly in urban areas.
- Rising adoption of ready-to-eat and ready-to-cook frozen foods.
- Premium imports preferred due to high purchasing power.
- Hospitality sector fueling bulk frozen product consumption.
What are the Drivers, Restraints, and Key Trends of the Middle East and North Africa Frozen Food Market?
In 2024, frozen food sales in the Middle East and North Africa grew by 12% year-on-year, with Gulf Cooperation Council countries accounting for 46% of the total regional market value. Consumption is led by frozen meat, seafood, bakery, and ready-to-cook items in both household and foodservice channels. Modern retail expansion, driven by supermarket and hypermarket growth, is improving accessibility to a wider product range.
The hospitality and tourism sectors, particularly in the Gulf, are fueling bulk demand from hotels, restaurants, and catering services. Premiumization trends are evident in rising sales of organic, gluten-free, and high-protein frozen products. E-commerce grocery platforms are gaining traction in major cities, offering fast delivery and competitive product variety, which enhances consumer convenience and brand trust.
Retail and Hospitality Demand Drive Frozen Food Uptake
Hotels, restaurants, and catering operators across the region are significantly contributing to frozen food demand, particularly for bulk-purchased meats, seafood, and bakery products. In Gulf countries, tourism growth is directly influencing higher consumption volumes in the hospitality sector. Household demand is expanding as working-age populations adopt ready-to-cook and ready-to-eat frozen products to save time. Modern retail penetration has improved distribution efficiency, with large chains introducing wider product assortments, including premium imports. E-commerce is enabling smaller brands to enter the market through online-first strategies, capitalizing on tech-savvy urban consumers. Cold chain advancements are reducing wastage rates by maintaining consistent quality from supplier to end-user, especially in import-heavy markets.
Import Dependency, Infrastructure Gaps, and Price Volatility Constrain Growth
High dependency on imported frozen products exposes the market to global price fluctuations and currency exchange risks, with import costs contributing up to 40% of retail pricing. Customs clearance requirements for frozen goods can delay product availability by 1-3 weeks, affecting peak-season supply. In North Africa, limited cold storage capacity leads to higher spoilage rates, raising distribution losses by up to 18%. Energy costs for frozen storage are 12-15% higher compared to chilled products, impacting operational budgets. Smaller distributors face limited access to premium retail shelf space, dominated by large-scale retail groups. While Gulf states benefit from advanced cold chain systems, parts of North Africa and smaller Middle Eastern economies still face logistical bottlenecks, which restrict product diversity and market penetration.
Competitive Landscape of Middle East and North Africa Frozen Food Market
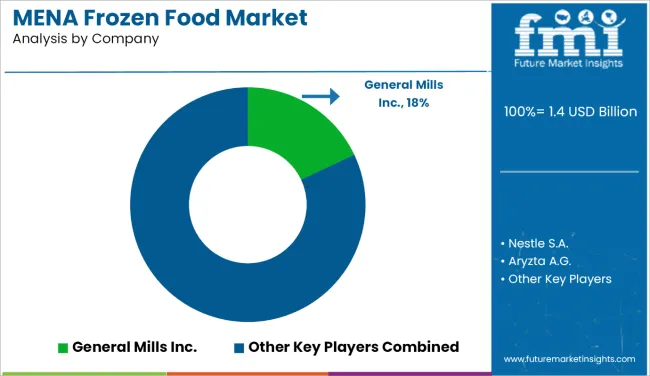
The market is moderately consolidated, led by General Mills Inc. with an 18% market share. The company’s stronghold is built on a diverse frozen product portfolio, robust brand equity, and well-established retail distribution networks across key MENA countries.
Key players in the market include Nestlé S.A., Al Kabeer Group, Sunbulah Group, and Kraft Heinz Company, each offering extensive frozen food categories such as ready-to-eat meals, frozen fruits and vegetables, meat and fish, and snacks. These companies leverage global sourcing capabilities, advanced freezing technologies, and brand localization strategies to appeal to both traditional and modern trade consumers.
Emerging regional players are gaining traction by focusing on Halal-certified offerings, value-based pricing, and country-specific taste profiles. Established players, however, retain an advantage through scale efficiencies, consistent product quality, and premium positioning in urban retail channels.
Scope of the Report - Middle East and North Africa Frozen Food Market
| Item | Value |
|---|---|
| Quantitative Units | USD 1.4 Billion |
| Type | Fruits and Vegetables, Meat and Fish, Dessert, Snacks, Cooked Ready Meals, Others (Frozen dairy, bakery, and specialty items) |
| Category | Ready to Eat, Ready to Cook, Ready to Drink, Others (Partially prepared frozen foods) |
| Distribution Channel | Supermarkets & Hypermarkets, Convenience Stores, Online Channels, Others (Wholesalers, specialty frozen food shops) |
| Freezing Technique | Blast Freezing, Belt Freezing, Individual Quick Freezing (IQF), Others (Cryogenic freezing, plate freezing) |
| Regions Covered | Middle East & North Africa |
| Top Countries Covered | United Arab Emirates, Saudi Arabia, Egypt, Qatar, Kuwait, and Others |
| Key Companies Profiled | Aryzta A.G., Ajinomoto Co. Inc., Cargill Incorporated, General Mills Inc., JBS S.A., Kellogg Company, The Kraft Heinz Company, Nestle S.A., ConAgra Brands, Inc., Associated British Foods Plc. |
| Additional Attributes | Rising demand for convenient and ready-to-eat meal options, growth in cold chain infrastructure, expanding quick-service restaurant (QSR) sector |
Key Segmentation
By Type:
- Frozen Fruits and Vegetables
- Frozen Meat and Fish
- Frozen Desert
- Frozen Snacks
- Frozen Cooked Ready Meals
- Other
By Category:
- Ready-to-eat
- Ready-to-cook
- Ready-to-drink
- Others
By Distribution Channel:
- Supermarkets & Hypermarkets
- Convenience Stores
- Online Channels
- Others
By Freezing Technique:
- Blast Freezing of Foods
- Belt Freezing of Foods
- Individual Quick Freezing (IQF) of Foods
- Others
Frequently Asked Questions
How big is the Middle East and North Africa frozen food market in 2025?
The global Middle East and North Africa frozen food market is estimated to be valued at USD 1.4 billion in 2025.
What will be the size of Middle East and North Africa frozen food market in 2035?
The market size for the Middle East and North Africa frozen food market is projected to reach USD 1.8 billion by 2035.
How much will be the Middle East and North Africa frozen food market growth between 2025 and 2035?
The Middle East and North Africa frozen food market is expected to grow at a 2.4% CAGR between 2025 and 2035.
What are the key product types in the Middle East and North Africa frozen food market?
The key product types in Middle East and North Africa frozen food market are frozen fruits and vegetables, frozen meat and fish, frozen desert, frozen snacks, frozen cooked ready meals and other.
Which category segment to contribute significant share in the Middle East and North Africa frozen food market in 2025?
In terms of category, ready-to-eat segment to command 41.2% share in the Middle East and North Africa frozen food market in 2025.
Preview the report firsthand - request a free sample
Get SampleGet the brochure for pricing and purchase details.
Get PDFTable of Content
- Executive Summary
- Global Market Outlook
- Demand-side Trends
- Supply-side Trends
- Technology Roadmap Analysis
- Analysis and Recommendations
- Market Overview
- Market Coverage / Taxonomy
- Market Definition / Scope / Limitations
- Market Background
- Market Dynamics
- Drivers
- Restraints
- Opportunity
- Trends
- Scenario Forecast
- Demand in Optimistic Scenario
- Demand in Likely Scenario
- Demand in Conservative Scenario
- Opportunity Map Analysis
- Product Life Cycle Analysis
- Supply Chain Analysis
- Investment Feasibility Matrix
- Value Chain Analysis
- PESTLE and Porter’s Analysis
- Regulatory Landscape
- Regional Parent Market Outlook
- Production and Consumption Statistics
- Import and Export Statistics
- Market Dynamics
- MENA Market Analysis 2021 to 2025 and Forecast, 2026 to 2036
- Historical Market Size Value (USD Billion) Analysis, 2021 to 2025
- Current and Future Market Size Value (USD Billion) Projections, 2026 to 2036
- Y-o-Y Growth Trend Analysis
- Absolute $ Opportunity Analysis
- Global Market Pricing Analysis 2021 to 2025 and Forecast 2026 to 2036
- MENA Market Analysis 2021 to 2025 and Forecast 2026 to 2036, By Type
- Introduction / Key Findings
- Historical Market Size Value (USD Billion) Analysis By Type , 2021 to 2025
- Current and Future Market Size Value (USD Billion) Analysis and Forecast By Type , 2026 to 2036
- Frozen Fruits And Vegetables
- Frozen Meat And Fish
- Frozen Desert
- Frozen Snacks
- Frozen Cooked Ready Meals
- Other
- Y-o-Y Growth Trend Analysis By Type , 2021 to 2025
- Absolute $ Opportunity Analysis By Type , 2026 to 2036
- MENA Market Analysis 2021 to 2025 and Forecast 2026 to 2036, By Category
- Introduction / Key Findings
- Historical Market Size Value (USD Billion) Analysis By Category, 2021 to 2025
- Current and Future Market Size Value (USD Billion) Analysis and Forecast By Category, 2026 to 2036
- Ready-To-Eat
- Ready-To-Cook
- Ready-To-Drink
- Others
- Y-o-Y Growth Trend Analysis By Category, 2021 to 2025
- Absolute $ Opportunity Analysis By Category, 2026 to 2036
- MENA Market Analysis 2021 to 2025 and Forecast 2026 to 2036, By Distribution Channel
- Introduction / Key Findings
- Historical Market Size Value (USD Billion) Analysis By Distribution Channel, 2021 to 2025
- Current and Future Market Size Value (USD Billion) Analysis and Forecast By Distribution Channel, 2026 to 2036
- Supermarkets & Hypermarkets
- Convenience Stores
- Online Channels
- Others
- Y-o-Y Growth Trend Analysis By Distribution Channel, 2021 to 2025
- Absolute $ Opportunity Analysis By Distribution Channel, 2026 to 2036
- MENA Market Analysis 2021 to 2025 and Forecast 2026 to 2036, By Freezing Technique
- Introduction / Key Findings
- Historical Market Size Value (USD Billion) Analysis By Freezing Technique, 2021 to 2025
- Current and Future Market Size Value (USD Billion) Analysis and Forecast By Freezing Technique, 2026 to 2036
- Blast Freezing Of Foods
- Belt Freezing Of Foods
- Individual Quick Freezing (IQF) Of Foods
- Others
- Y-o-Y Growth Trend Analysis By Freezing Technique, 2021 to 2025
- Absolute $ Opportunity Analysis By Freezing Technique, 2026 to 2036
- MENA Market Analysis 2021 to 2025 and Forecast 2026 to 2036, By Region
- Introduction
- Historical Market Size Value (USD Billion) Analysis By Country, 2021 to 2025
- Current Market Size Value (USD Billion) Analysis and Forecast By Country, 2026 to 2036
- UAE
- Saudi Arabia
- Egypt
- Qatar
- Kuwait
- Market Attractiveness Analysis By Country
- UAE Frozen Food Market Analysis 2021 to 2025 and Forecast 2026 to 2036
- Historical Market Size Value (USD Billion) Trend Analysis By Market Taxonomy, 2021 to 2025
- Market Size Value (USD Billion) Forecast By Market Taxonomy, 2026 to 2036
- By Type
- By Category
- By Distribution Channel
- By Freezing Technique
- Market Attractiveness Analysis
- Saudi Arabia Frozen Food Market Analysis 2021 to 2025 and Forecast 2026 to 2036
- Historical Market Size Value (USD Billion) Trend Analysis By Market Taxonomy, 2021 to 2025
- Market Size Value (USD Billion) Forecast By Market Taxonomy, 2026 to 2036
- By Type
- By Category
- By Distribution Channel
- By Freezing Technique
- Market Attractiveness Analysis
- Egypt Frozen Food Market Analysis 2021 to 2025 and Forecast 2026 to 2036
- Historical Market Size Value (USD Billion) Trend Analysis By Market Taxonomy, 2021 to 2025
- Market Size Value (USD Billion) Forecast By Market Taxonomy, 2026 to 2036
- By Type
- By Category
- By Distribution Channel
- By Freezing Technique
- Market Attractiveness Analysis
- Qatar Frozen Food Market Analysis 2021 to 2025 and Forecast 2026 to 2036
- Historical Market Size Value (USD Billion) Trend Analysis By Market Taxonomy, 2021 to 2025
- Market Size Value (USD Billion) Forecast By Market Taxonomy, 2026 to 2036
- By Type
- By Category
- By Distribution Channel
- By Freezing Technique
- Market Attractiveness Analysis
- Kuwait Frozen Food Market Analysis 2021 to 2025 and Forecast 2026 to 2036
- Historical Market Size Value (USD Billion) Trend Analysis By Market Taxonomy, 2021 to 2025
- Market Size Value (USD Billion) Forecast By Market Taxonomy, 2026 to 2036
- By Type
- By Category
- By Distribution Channel
- By Freezing Technique
- Market Attractiveness Analysis
- Key Countries Market Analysis
- UAE
- Pricing Analysis
- Market Share Analysis, 2024
- By Type
- By Category
- By Distribution Channel
- By Freezing Technique
- Saudi Arabia
- Pricing Analysis
- Market Share Analysis, 2024
- By Type
- By Category
- By Distribution Channel
- By Freezing Technique
- Egypt
- Pricing Analysis
- Market Share Analysis, 2024
- By Type
- By Category
- By Distribution Channel
- By Freezing Technique
- Qatar
- Pricing Analysis
- Market Share Analysis, 2024
- By Type
- By Category
- By Distribution Channel
- By Freezing Technique
- Kuwait
- Pricing Analysis
- Market Share Analysis, 2024
- By Type
- By Category
- By Distribution Channel
- By Freezing Technique
- UAE
- Market Structure Analysis
- Competition Dashboard
- Competition Benchmarking
- Market Share Analysis of Top Players
- By Regional
- By Type
- By Category
- By Distribution Channel
- By Freezing Technique
- Competition Analysis
- Competition Deep Dive
- Aryzta A.G.
- Overview
- Product Portfolio
- Profitability by Market Segments (Product/Age /Sales Channel/Region)
- Sales Footprint
- Strategy Overview
- Marketing Strategy
- Product Strategy
- Channel Strategy
- Ajinomoto Co. Inc.
- Cargill Incorporated
- General Mills Inc.
- JBS S.A.
- Kellogg Company
- The Kraft Heinz Company
- Nestle S.A.
- ConAgra Brands, Inc.
- Associated British Foods Plc.
- Aryzta A.G.
- Competition Deep Dive
- Assumptions & Acronyms Used
- Research Methodology


