
- Market Size (2026)
- USD 1.3 Bn
- Forecast (2036)
- USD 1.8 Bn
- CAGR (2026 to 2036)
- 3.0%
How big is the Acrolein Market in 2026?
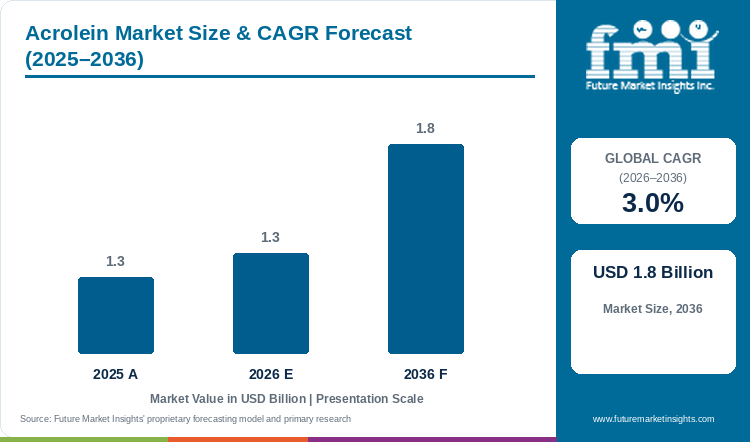
The global acrolein market is estimated at USD 1.34 billion in 2026, compared with USD 1.30 billion in 2025, and is forecast to reach USD 1.80 billion by 2036, expanding at a CAGR of 3.0% from 2026 to 2036.
As per FMI's analysis, investment in methionine production is adding to acrolein demand. Adisseo reported on 29 April 2025 that construction of its 150,000-tonne-a-year powder methionine plant in Quanzhou was on track and that major equipment had been procured. [1] The plant will add to precursor demand once it is commissioned.
Planned maintenance interrupts that demand for several weeks at a time. In June 2025 Evonik scheduled six to seven weeks of work at each of its Singapore and Antwerp methionine and precursor facilities, [2] so deliveries from connected plants follow its shutdown calendar. Buyers of acrolein therefore plan their orders around these calendars as well as around price.
Market Size & Forecast
Table 1: Acrolein Market Size and Forecast (USD billion and CAGR percentage), 2025 to 2036
| Market size and forecast | Value |
|---|---|
| 2025 Value | USD 1.30 billion |
| Estimated market size in 2026 | USD 1.34 billion |
| Projected market size by 2036 | USD 1.80 billion |
| CAGR (2026-2036) | 3.0% |
| Added revenue, 2026 to 2036 | USD 0.46 billion |
Key Market Trends & Insights
- Propylene oxidation is estimated to account for 86.4% of acrolein demand by production route in 2026.
- Methionine is expected to hold 54.8% of acrolein demand by application in 2026.
- Investment in methionine plants, led by Adisseo's Quanzhou project, is adding to acrolein demand. [1]
- Planned shutdowns at connected plants interrupt precursor deliveries for several weeks, as Evonik's 2025 maintenance in Singapore and Antwerp did. [2]
- Evonik's Wesseling upgrade shows integrated production cutting the storage of acrolein between plants. [3]
Regional Highlights
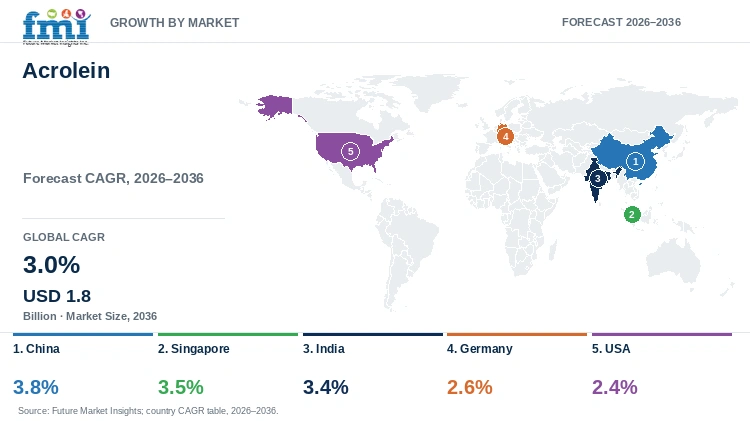
- China is likely to grow at a 3.8% CAGR during the forecast period, followed by Singapore at 3.5%, India at 3.4%, Germany at 2.6% and the USA at 2.4%.
Analyst Perspective
“Methionine expansion will support acrolein demand as new plants enter production. Delivery commitments tied to precursor maintenance and downstream consumption can help producers retain repeat orders, because a low chemical price cannot compensate for an interrupted production campaign.”
- Nikhil Kaitwade, Principal Consultant, FMI
How is the Acrolein Market segmented?
The Acrolein Market is segmented by production route, application, end use and region.
- By Production Route: Propylene Oxidation and Glycerol Dehydration.
- By Application: Methionine, Glutaraldehyde, Biocide, Chemical Precursor, Herbicide, Fixative, Water Treatment Agent and Others.
- By End Use: Paints and Coatings, Polymer, Industrial Manufacturing and Other.
- By Region: North America, Latin America, Western Europe, Eastern Europe, East Asia, South Asia and Pacific, and Middle East and Africa.
Why is Propylene Oxidation the Leading Production Route in the Acrolein Market?
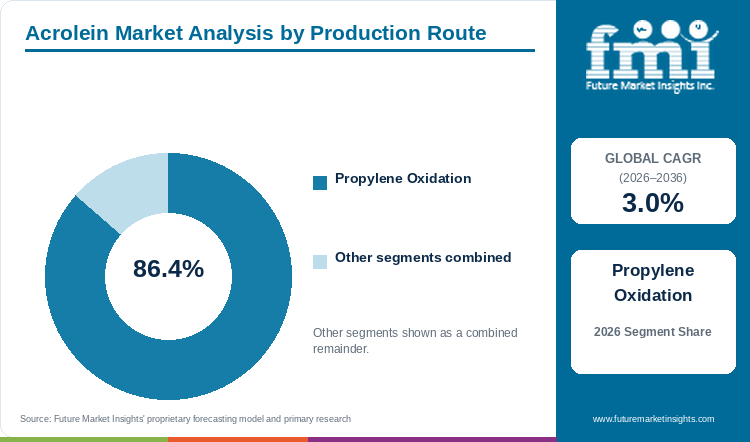
Propylene oxidation accounts for an estimated 86.4% of acrolein demand by production route in 2026, as per FMI's analysis.
Table 2: Production Route Share for the Acrolein Market (percentage share of revenue), 2026
| Segment | Share (2026) |
|---|---|
| Propylene oxidation | 86.4% |
| Other segments combined | 13.6% |
Zhejiang NHU names gas phase oxidation of propylene as the production method for the acrolein it sells. [4] Customers that already know the specification and how the material behaves in their processes have limited incentive to change supplier.
Consistent quality sustains the lead of this route. A converter needs the same composition through a production campaign, and a change of source can affect every stage that follows. Approval therefore depends on quality and delivery over time as well as on the chemistry.
However, the other routes together hold the remaining 13.6%. Glycerol dehydration is part of the segmentation, but a renewable feedstock does not by itself give reliable commercial supply. As per FMI's analysis, a new route has to show steady output and a workable delivery arrangement before customers build it into their production schedules.
Producers best placed to hold this share align propylene supply and oxidation output with downstream consumption, maintain a consistent specification and deliver quantities suited to the receiving plant.
Why is Methionine the Leading Application in the Acrolein Market?
Methionine is estimated to account for 54.8% of acrolein application demand in 2026, as per FMI's analysis.
Table 3: Application Share for the Acrolein Market (percentage share of revenue), 2026
| Segment | Share (2026) |
|---|---|
| Methionine | 54.8% |
| Other segments combined | 45.2% |
Evonik's June 2025 programme for Singapore and Antwerp covered both methionine and its precursors. [2] The announcement shows how closely the intermediate follows the running of finished feed additive plants.
Methionine produces repeat orders because a plant needs precursor supply that matches the rate its own equipment can run. Purchases therefore continue for as long as the plant operates, and new capacity adds to them.
However, extra methionine capacity does not always bring extra merchant orders. A new plant buys acrolein from outside only if it does not make the precursor itself, and an integrated unit can raise its consumption without opening a market to outside suppliers.
Producers best placed agree the boundary between internal use and external supply, coordinate precursor maintenance with methionine production and state which deliveries stay available during a shutdown.
What are the Key Drivers, Restraints and Opportunities in the Acrolein Market?
The acrolein market is expected to grow from USD 1.34 billion in 2026 to USD 1.80 billion by 2036, which adds USD 0.46 billion over the forecast period. Continuing chemical conversion supports demand, while the cost of receiving and handling a reactive liquid limits who can buy it, and better coordination of supply is the main opportunity for producers.
Driver: continuing downstream production. Methionine and glutaraldehyde plants need acrolein that meets the specification of the chemicals they make, and Adisseo makes both powder and liquid methionine. [1] Operating rates and repeat production campaigns are the closest signals of recurring demand, and new plants add to it only once their production and supply arrangements are in place.
Restraint: receiving and handling costs. A plant that buys acrolein only occasionally still needs receiving equipment, operating procedures and people to maintain them. A low chemical price cannot make up for an unsuitable installation, and higher demand for treatment chemicals does not raise acrolein use where another treatment suits the customer's equipment better.
Opportunity: delivery continuity. A specialist converter without its own upstream unit needs to know what will be delivered while a connected plant is shut and whether a second source is already approved. Suppliers that agree delivery windows and continuity arrangements early can retain customers across successive production campaigns.
Suppliers that maintain consistent quality and deliveries across applications are best placed to win a share of the USD 0.46 billion added between 2026 and 2036.
How do Exposure Guidance and Product Specifications Influence Demand?
Exposure guidance and customer specifications decide who can receive acrolein and which supplier can serve them. They act at three points: the receiving plant, the composition of the material and its fit with the application.
Exposure guidance at the receiving plant
NIOSH recommends a time weighted average exposure of 0.1 ppm for acrolein. [5] Exposure control is a condition of industrial use, so a customer that raises its purchases needs suitable equipment and trained handling at the receiving site, and a supplier able to deliver there.
Specifications for chemical conversion
A converter checks how incoming material affects its own reaction and purification stages. Changes in composition can alter impurity removal and lead to reprocessing later in the sequence, which matters most to customers that make several chemicals on shared equipment, as glutaraldehyde producers do. A general purchasing specification cannot replace qualification for the intended process.
Requirements for treatment and laboratory use
Industrial treatment customers need the chemical and its application to fit their water and production equipment, while laboratory customers need the right product identity and certificate documentation. These needs lead to different supplier choices, because field application support serves a different purpose from the documents that come with a laboratory product.
Together, these conditions limit the customers a supplier can serve. A producer with a suitable delivery format and repeat quality can support an approved industrial process, while a service provider must also support the way the chemical is applied.
What Technical and Operational Constraints Affect Acrolein Supply?
The constraints sit at several stages, from precursor production to delivery and use, and more nominal capacity does not resolve each of them.
The first is availability to outside customers. Where a producer both sells acrolein and uses it in its own methionine line, total plant output does not show how much an independent converter can buy. Contracts need to reflect the volume left after internal use and the periods in which it can be dispatched.
The second is maintenance. Catalyst changes and plant improvements at connected units stop precursor output together with the finished product, so a customer that depends on linked production needs continuity arrangements before the work starts. A downstream expansion under construction raises a separate timing question, because it must reach dependable operation before it creates recurring demand.
The third is the receiving installation. Unloading has to fit both the customer's equipment and its production schedule, and extra stock is no substitute for dependable scheduling, since delays at unloading can affect the next production campaign.
The fourth is product consistency. A change in feedstock quality can affect several reaction and purification stages at a specialty chemical plant, so qualification has to show that a source can hold the required composition over time. The same applies when a customer considers material from a different production route.
Producers with dependable operation and clear dispatch commitments have an advantage with industrial converters, while specialist distributors can serve smaller customers that need manageable quantities, suitable packaging and documentation.
Where are the Commercial Opportunities for Acrolein Suppliers?
The opportunities lie in maintenance cover, specialist conversion and treatment services, and each needs an offer built for a particular customer rather than more volume alone.
The first is continuity through maintenance. External customers need early notice of affected deliveries and an approved alternative where required. Suppliers that agree realistic delivery windows, and a response to delayed unloading, can reduce interruptions for converters without their own upstream assets.
The second is supply for smaller conversion campaigns. Glutaraldehyde and plant protection intermediates give suppliers outlets beyond large methionine operations, and a supplier able to hold the required impurity specification while meeting uneven campaign orders has a defined opportunity with these customers.
The third is treatment service. Acrolein competes within the wider biocide and water treatment chemical markets, but customers buy a treatment that works with their installed system, so delivery and technical assistance form part of the offer. Smaller users also give specialist distributors a role, provided they can supply suitable quantities, packaging and documentation.
Acrolein Market by Country (2026 to 2036)
Table 4: Country Growth Outlook for the Acrolein Market (CAGR percentage), 2026 to 2036
| Country | CAGR (2026-2036) |
|---|---|
| China | 3.8% |
| Singapore | 3.5% |
| India | 3.4% |
| Germany | 2.6% |
| USA | 2.4% |
What is supporting acrolein demand in China?
China is likely to grow at a 3.8% CAGR during the forecast period, the highest rate among the countries analysed.
Feed demand and methionine plants built close to the acrolein source support the market. The US Department of Agriculture expects Chinese chicken meat production to rise from 16.5 million tonnes in 2025 to 18.0 million tonnes in 2026, an increase of 9.1%, and to 19.0 million tonnes in 2027. [6] Zhejiang NHU supplies acrolein from Weifang, Shandong, to its own methionine line and to outside plant protection customers, [4] and its 2025 annual report records a 180,000-tonne-a-year liquid methionine project that started production and an upgrade that raised solid methionine capacity to 370,000 tonnes a year. [7] That proximity is an advantage for producers. The disadvantage is borne by independent buyers, because part of the output is retained within the producer's own chain and announced capacity does not show how much reaches them.
More capacity is likely to follow. Adisseo expects its Quanzhou powder methionine plant to start up in the first half of 2027, [8] and Sichuan Hebang has announced a 600,000-tonne-a-year liquid methionine project that is due to begin construction on 31 October 2027, subject to environmental and safety reviews. [9] Suppliers that agree external volumes and dispatch commitments alongside internal use will be best placed as these plants enter operation.
Why does maintenance planning matter in Singapore?
Singapore is likely to grow at a 3.5% CAGR during the forecast period.
Singapore is a production site for methionine and its precursors. Evonik included its Singapore operations in the maintenance programme announced in June 2025, and said that maintenance at a raw material supplier's plant required an early shutdown there in the third quarter of 2025, which it combined with a methionine catalyst exchange. [2] A site that exports to several countries is an advantage for distant buyers, who rely on a single dependable source. It is a disadvantage when every interruption occurs at one site, because distributors have to allow for the plant calendar, transit time and approved stock.
The outlook follows amino acid demand and prices. In the second quarter of 2026 Evonik reported higher volumes and improved selling prices for amino acids in its Animal Nutrition business. [10] Delivery schedules agreed before planned shutdowns begin will maintain supply to customers through the next maintenance cycle.
What are the key sources of acrolein demand in India?
India is likely to grow at a 3.4% CAGR during the forecast period.
Acrolein demand in India comes from chemical conversion into crop protection and specialty products. UPL's 2024-25 annual report lists acrolein among the chemistries of its SUPERFORM business and describes integrated production of their downstream derivatives, [11] and Zhejiang NHU names imidacloprid among the downstream products linked to its acrolein. [4] India shows no acrolein-specific advantage or disadvantage. Demand follows the production campaigns of the converters that use it, so a supplier either meets their specification and timing or is excluded from the order.
The market is likely to grow with these campaigns. Feedstock quality affects impurity removal in later stages, and customers may use the same equipment for other products between campaigns, so suppliers that meet the specification and deliver when a campaign starts have the strongest opportunity.
What supports acrolein purchases in Germany?
Germany is likely to grow at a 2.6% CAGR during the forecast period.
Germany has an established precursor and specialty chemical base. Evonik said on 31 January 2023 that it had invested EUR 25 million (USD 29 million) in its methylmercapto-propionaldehyde plant at Wesseling, with a process that avoids storing intermediates such as acrolein on site, to secure supply to its methionine hub in Antwerp. [3] Integrated production close to the conversion step is the advantage. The disadvantage is the exposure rule: the German occupational exposure limit for acrolein has been lowered to 0.02 ml/m3, to be met by 1 July 2026 at the latest, [12] against the 0.1 ppm recommended by NIOSH, which raises the cost of handling it in a plant not built for it.
Growth is likely to stay moderate. The European Commission's July 2026 action plan for the EU protein system describes amino acids in feed as the most cost-effective way to reduce soya imports and notes that the EU depends on non-EU countries, particularly in East Asia, for almost all the amino acids it needs, [13] which keeps European precursor production relevant.
Where does application support influence demand in the USA?
The USA is likely to grow at a 2.4% CAGR during the forecast period, the lowest rate among the countries analysed.
The USA combines a large feed base with a regulated treatment market. The US Department of Agriculture expects chicken meat production to rise from 21.8 million tonnes in 2025 to 22.6 million tonnes in 2026, an increase of 3.7%. [6] On the treatment side, the Environmental Protection Agency accepted an amended label for Magnacide B Microbiocide on 17 September 2025 that classifies the product as a restricted use pesticide because of its high acute toxicity and limits it to oilfield water injection recovery systems, [14] and Washington State's irrigation weed control permit, effective from October 2023 to October 2028, allows acrolein treatment under set conditions with an application plan and monitoring records. [15] The advantage is a registered, documented route to market. The disadvantage is that each use is limited to specific assets.
Growth is likely to stay the slowest of the five because treatment uses are narrow and conditioned, while feed demand rises with chicken output. Service providers need knowledge of the customer's water and production equipment together with dependable delivery and technical assistance.
Who are the notable companies in the Acrolein Market?
The companies are positioned at different points of the acrolein chain. Zhejiang NHU sells industrial acrolein, Evonik and Adisseo generate precursor demand through their methionine production, Baker Hughes provides treatment services and Merck supplies laboratory customers. The positions are not equivalent in manufacturing capacity.
Zhejiang NHU supplies acrolein in tanker trucks and ISO tanks and also uses it in its own plants. [4] It is relevant to converters seeking merchant supply, provided the delivery allocation and the specification fit their process.
Evonik's maintenance programme shows its place in integrated production, and Adisseo's powder and liquid methionine activities give the downstream context for intermediate requirements. Their operating plans affect the chain, but neither company's disclosures give a volume of acrolein available for outside sale.
Baker Hughes offers MAGNACIDE B acrolein chemical services for industrial bacteria management, and Merck supplies analytical acrolein products through Sigma-Aldrich. An operator buying treatment support needs a different partner from a laboratory buying an analytical product: application assistance sets the first apart, and identity and certificate documentation matter to the second.
Supplier comparison starts with the application and the delivery scale. The companies to watch are those that maintain dependable supply or service within their own role, not those with the largest unrelated downstream sales.
Key Developments in the Acrolein Market
- In June 2025, Evonik announced technical measures at its Singapore and Antwerp methionine and precursor facilities, including catalyst changes and improvements to plant operation, with planned shutdowns of six to seven weeks at each location. [2]
- In April 2025, Adisseo reported that construction of its 150,000-tonne-a-year powder methionine project in Quanzhou remained on schedule, which supports the downstream investment outlook but does not mean commercial production has started. [1]
Key Players in the Acrolein Market
- Zhejiang NHU
- Evonik Industries
- Adisseo
- Baker Hughes
- Merck
Acrolein Market Report Scope
Table 5: Report Scope for the Acrolein Market (coverage fields and definitions), 2026 to 2036
| Coverage Field | Report Scope |
|---|---|
| Market Breakdown | Production Route (Propylene Oxidation, Glycerol Dehydration); Application (Methionine, Glutaraldehyde, Biocide, Chemical Precursor, Herbicide, Fixative, Water Treatment Agent, Others); End Use (Paints and Coatings, Polymer, Industrial Manufacturing, Other) |
| Quantitative Units | Revenue in USD billion and CAGR from 2026 to 2036 |
| Market Definition | Commercial acrolein sold for chemical conversion and industrial applications. It excludes finished methionine and glutaraldehyde revenue and acrolein formed as an unwanted combustion or food processing contaminant. |
| Regions Covered | North America, Latin America, Western Europe, Eastern Europe, East Asia, South Asia and Pacific, Middle East and Africa |
| Countries Covered | China, Singapore, India, Germany and USA |
| Key Companies Covered | Zhejiang NHU, Evonik Industries, Adisseo, Baker Hughes and Merck |
| Forecast Period | 2026 to 2036 (with 2025 historical baseline) |
| Approach | Combined primary interviews, secondary literature analysis, and top-down data triangulation |
Acrolein Market - Research Methodology
The market assessment combines primary interviews with industry participants and secondary research drawn from company disclosures, trade data and industry publications. Market size is built from supply-side and demand-side estimates and validated top-down, and segment shares and competitive positioning are checked through data triangulation before publication.
Acrolein Market by Segments
By Production Route
- Propylene Oxidation
- Glycerol Dehydration
By Application
- Methionine
- Glutaraldehyde
- Biocide
- Chemical Precursor
- Herbicide
- Fixative
- Water Treatment Agent
- Others
By End Use
- Paints and Coatings
- Polymer
- Industrial Manufacturing
- Other
By Region
- North America
- United States
- Canada
- Latin America
- Brazil
- Mexico
- Argentina
- Chile
- Western Europe
- Germany
- France
- United Kingdom
- Italy
- Spain
- Benelux
- Nordics
- Eastern Europe
- Poland
- Czech Republic
- Romania
- Hungary
- East Asia
- China
- Japan
- South Korea
- South Asia and Pacific
- India
- ASEAN
- Australia and New Zealand
- Middle East and Africa
- GCC Countries
- South Africa
- Turkiye
- Israel
Research Sources and Bibliography
- [1] Adisseo. Q1 2025: Strong growth leading to 67.9% increase in net profit. 29 April 2025.
- [2] Evonik Industries. Evonik continues to optimize its global production setup for MetAMINO. 4 June 2025.
- [3] Evonik Industries. Evonik invests EUR 25m in methionine intermediates production plant upgrade in Wesseling/Germany. 31 January 2023.
- [4] Zhejiang NHU. Acrolein (company product page).
- [5] National Institute for Occupational Safety and Health (NIOSH). NIOSH pocket guide to chemical hazards: Acrolein. 30 October 2019.
- [6] USDA Foreign Agricultural Service. Livestock and Poultry: World Markets and Trade. 9 October 2026.
- [7] Zhejiang NHU. 2025 Annual Report (English translation). April 2026.
- [8] Bluestar Adisseo Company. 2026 Half-year Report. 31 August 2026.
- [9] Sichuan Hebang Biotechnology. Announcement on external investment (No. 2026-029). 21 April 2026.
- [10] Evonik Industries. Evonik reports strong second quarter. 4 August 2026.
- [11] UPL Limited. Annual Report 2024-25: Our businesses - SUPERFORM, pp. 36-37. 2025.
- [12] German Social Accident Insurance (DGUV), Institute for Occupational Safety and Health (IFA). GESTIS Substance Database: Acrylaldehyde (acrolein). Accessed 29 October 2026.
- [13] European Commission. Action Plan for resilience, strategic autonomy and sustainability of the EU protein system, COM(2026) 355 final. 7 July 2026.
- [14] US Environmental Protection Agency. Pesticide product label, Magnacide B Microbiocide (registration number 10707-10), amended label acceptance. 17 September 2025.
- [15] Washington State Department of Ecology. Irrigation System Aquatic Weed Control General Permit, effective 2 October 2023. 23 August 2023.
Table of Content
Table of Content
- Key Takeaways
- Market Size and CAGR
- Top Growth Driver
- Fastest Growing Segment
- Leading Region
- Key Companies
- Emerging Opportunities
- Executive Summary
- Global Market Outlook
- Demand-side Trends
- Supply-side Trends
- Technology Roadmap Analysis
- Analysis and Recommendations
- Analyst Perspective (What is happening? Why now? What should investors know?)
- Key Questions Answered
- How large is the market?
- What is the CAGR?
- What are key trends?
- Which region dominates?
- Who are the leaders?
Read More...
- Market Overview
- Market Coverage / Taxonomy
- Market Definition / Scope / Limitations
- Research Methodology
- Chapter Orientation
- Analytical Lens and Working Hypotheses
- Market Structure, Signals, and Trend Drivers
- Benchmarking and Cross-market Comparability
- Market Sizing, Forecasting, and Opportunity Mapping
- Research Design and Evidence Framework
- Desk Research Programme (Secondary Evidence)
- Expert Input and Fieldwork (Primary Evidence)
- Tooling, Models, and Reference Databases
- Data Engineering and Model Build
- Quality Assurance and Audit Trail
- Market Background
- Market Dynamics (Drivers, Restraints, Opportunity, Trends)
- Scenario Forecast (Optimistic, Likely, Conservative)
- Impact Analysis
- AI Impact
- Sustainability Impact
- Regulatory Impact
- Technology Impact
- Consumer / Buyer Analysis
- Purchase Drivers
- Adoption Barriers
- Buyer Journey
- Opportunity Map Analysis
- Product Life Cycle Analysis
- Supply Chain Analysis
- Investment Feasibility Matrix
- Value Chain Analysis
- PESTLE and Porter's Analysis
- Regulatory Landscape
- Regional Parent Market Outlook
- Production and Consumption Statistics
- Import and Export Statistics
- Global Market Analysis and Forecast, 2021 to 2036
- Historical Market Size Value (USD Billion) Analysis, 2021 to 2025
- Current and Future Market Size Value (USD Billion) Projections, 2026 to 2036
- Y-o-Y Growth Trend Analysis
- Absolute $ Opportunity Analysis
- Global Market Pricing Analysis, 2021 to 2036
- Global Market Analysis and Forecast, By Production Route, 2021 to 2036
- Introduction / Key Findings
- Historical Market Size Value (USD Billion) Analysis By Production Route, 2021 to 2025
- Current and Future Market Size Value (USD Billion) Analysis and Forecast By Production Route, 2026 to 2036
- Propylene Oxidation
- Glycerol Dehydration
- Y-o-Y Growth Trend Analysis By Production Route, 2021 to 2025
- Absolute $ Opportunity Analysis By Production Route, 2026 to 2036
- Global Market Analysis and Forecast, By Application, 2021 to 2036
- Introduction / Key Findings
- Historical Market Size Value (USD Billion) Analysis By Application, 2021 to 2025
- Current and Future Market Size Value (USD Billion) Analysis and Forecast By Application, 2026 to 2036
- Methionine
- Glutaraldehyde
- Biocide
- Chemical Precursor
- Herbicide
- Fixative
- Water Treatment Agent
- Others
- Y-o-Y Growth Trend Analysis By Application, 2021 to 2025
- Absolute $ Opportunity Analysis By Application, 2026 to 2036
- Global Market Analysis and Forecast, By End Use, 2021 to 2036
- Introduction / Key Findings
- Historical Market Size Value (USD Billion) Analysis By End Use, 2021 to 2025
- Current and Future Market Size Value (USD Billion) Analysis and Forecast By End Use, 2026 to 2036
- Paints and Coatings
- Polymer
- Industrial Manufacturing
- Other
- Y-o-Y Growth Trend Analysis By End Use, 2021 to 2025
- Absolute $ Opportunity Analysis By End Use, 2026 to 2036
- Global Market Analysis and Forecast, By Region, 2021 to 2036
- Introduction
- Historical Market Size Value (USD Billion) Analysis By Region, 2021 to 2025
- Current Market Size Value (USD Billion) Analysis and Forecast By Region, 2026 to 2036
- North America
- Latin America
- Western Europe
- Eastern Europe
- East Asia
- South Asia and Pacific
- Middle East and Africa
- Market Attractiveness Analysis By Region
- North America Market Analysis and Forecast, By Country, 2021 to 2036
- Historical Market Size Value (USD Billion) Trend Analysis By Market Taxonomy, 2021 to 2025
- Market Size Value (USD Billion) Forecast By Market Taxonomy, 2026 to 2036
- By Country
- United States
- Canada
- By Production Route
- By Application
- By End Use
- By Country
- Market Attractiveness Analysis
- By Country
- By Production Route
- By Application
- By End Use
- Key Takeaways
- Latin America Market Analysis and Forecast, By Country
- Historical Market Size Value (USD Billion) Trend Analysis By Market Taxonomy, 2021 to 2025
- Market Size Value (USD Billion) Forecast By Market Taxonomy, 2026 to 2036
- By Country
- Brazil
- Mexico
- Argentina
- Chile
- By Production Route
- By Application
- By End Use
- By Country
- Market Attractiveness Analysis
- By Country
- By Production Route
- By Application
- By End Use
- Key Takeaways
- Western Europe Market Analysis and Forecast, By Country
- Historical Market Size Value (USD Billion) Trend Analysis By Market Taxonomy, 2021 to 2025
- Market Size Value (USD Billion) Forecast By Market Taxonomy, 2026 to 2036
- By Country
- Germany
- France
- United Kingdom
- Italy
- Spain
- Benelux
- Nordics
- By Production Route
- By Application
- By End Use
- By Country
- Market Attractiveness Analysis
- By Country
- By Production Route
- By Application
- By End Use
- Key Takeaways
- Eastern Europe Market Analysis and Forecast, By Country
- Historical Market Size Value (USD Billion) Trend Analysis By Market Taxonomy, 2021 to 2025
- Market Size Value (USD Billion) Forecast By Market Taxonomy, 2026 to 2036
- By Country
- Poland
- Czech Republic
- Romania
- Hungary
- By Production Route
- By Application
- By End Use
- By Country
- Market Attractiveness Analysis
- By Country
- By Production Route
- By Application
- By End Use
- Key Takeaways
- East Asia Market Analysis and Forecast, By Country
- Historical Market Size Value (USD Billion) Trend Analysis By Market Taxonomy, 2021 to 2025
- Market Size Value (USD Billion) Forecast By Market Taxonomy, 2026 to 2036
- By Country
- China
- Japan
- South Korea
- By Production Route
- By Application
- By End Use
- By Country
- Market Attractiveness Analysis
- By Country
- By Production Route
- By Application
- By End Use
- Key Takeaways
- South Asia and Pacific Market Analysis and Forecast, By Country
- Historical Market Size Value (USD Billion) Trend Analysis By Market Taxonomy, 2021 to 2025
- Market Size Value (USD Billion) Forecast By Market Taxonomy, 2026 to 2036
- By Country
- India
- ASEAN
- Australia and New Zealand
- By Production Route
- By Application
- By End Use
- By Country
- Market Attractiveness Analysis
- By Country
- By Production Route
- By Application
- By End Use
- Key Takeaways
- Middle East and Africa Market Analysis and Forecast, By Country
- Historical Market Size Value (USD Billion) Trend Analysis By Market Taxonomy, 2021 to 2025
- Market Size Value (USD Billion) Forecast By Market Taxonomy, 2026 to 2036
- By Country
- GCC Countries
- South Africa
- Turkiye
- Israel
- By Production Route
- By Application
- By End Use
- By Country
- Market Attractiveness Analysis
- By Country
- By Production Route
- By Application
- By End Use
- Key Takeaways
- Key Countries Market Analysis
- United States
- Pricing Analysis
- Market Share Analysis, 2025
- By Production Route
- By Application
- By End Use
- Canada
- Pricing Analysis
- Market Share Analysis, 2025
- By Production Route
- By Application
- By End Use
- Mexico
- Pricing Analysis
- Market Share Analysis, 2025
- By Production Route
- By Application
- By End Use
- Brazil
- Pricing Analysis
- Market Share Analysis, 2025
- By Production Route
- By Application
- By End Use
- Chile
- Pricing Analysis
- Market Share Analysis, 2025
- By Production Route
- By Application
- By End Use
- Germany
- Pricing Analysis
- Market Share Analysis, 2025
- By Production Route
- By Application
- By End Use
- United Kingdom
- Pricing Analysis
- Market Share Analysis, 2025
- By Production Route
- By Application
- By End Use
- Italy
- Pricing Analysis
- Market Share Analysis, 2025
- By Production Route
- By Application
- By End Use
- Spain
- Pricing Analysis
- Market Share Analysis, 2025
- By Production Route
- By Application
- By End Use
- France
- Pricing Analysis
- Market Share Analysis, 2025
- By Production Route
- By Application
- By End Use
- India
- Pricing Analysis
- Market Share Analysis, 2025
- By Production Route
- By Application
- By End Use
- ASEAN
- Pricing Analysis
- Market Share Analysis, 2025
- By Production Route
- By Application
- By End Use
- Australia and New Zealand
- Pricing Analysis
- Market Share Analysis, 2025
- By Production Route
- By Application
- By End Use
- China
- Pricing Analysis
- Market Share Analysis, 2025
- By Production Route
- By Application
- By End Use
- Japan
- Pricing Analysis
- Market Share Analysis, 2025
- By Production Route
- By Application
- By End Use
- South Korea
- Pricing Analysis
- Market Share Analysis, 2025
- By Production Route
- By Application
- By End Use
- Poland
- Pricing Analysis
- Market Share Analysis, 2025
- By Production Route
- By Application
- By End Use
- Hungary
- Pricing Analysis
- Market Share Analysis, 2025
- By Production Route
- By Application
- By End Use
- South Africa
- Pricing Analysis
- Market Share Analysis, 2025
- By Production Route
- By Application
- By End Use
- Singapore
- Pricing Analysis
- Market Share Analysis, 2025
- By Production Route
- By Application
- By End Use
- United States
- Market Structure Analysis
- Competition Dashboard
- Competition Benchmarking
- Market Share Analysis of Top Players
- By Regional
- By Production Route
- By Application
- By End Use
- Emerging Startups
- Innovation Benchmarking
- Competition Analysis
- Competition Deep Dive
- Zhejiang NHU
- Overview
- Product Portfolio
- Profitability by Market Segments
- Sales Footprint
- Strategy Overview
- Marketing Strategy
- Product Strategy
- Channel Strategy
- Evonik Industries
- Adisseo
- Baker Hughes
- Merck
- Zhejiang NHU
- Case Studies
- Success Stories
- Recent Developments
- Competition Deep Dive
- Assumptions & Acronyms Used
List of Tables
- Table 1: Global Market Value (USD Billion) Forecast by Region, 2021 to 2036
- Table 2: Global Market Value (USD Billion) Forecast by Production Route, 2021 to 2036
- Table 3: Global Market Value (USD Billion) Forecast by Application, 2021 to 2036
- Table 4: Global Market Value (USD Billion) Forecast by End Use, 2021 to 2036
- Table 5: North America Market Value (USD Billion) Forecast by Country, 2021 to 2036
- Table 6: North America Market Value (USD Billion) Forecast by Production Route, 2021 to 2036
- Table 7: North America Market Value (USD Billion) Forecast by Application, 2021 to 2036
- Table 8: North America Market Value (USD Billion) Forecast by End Use, 2021 to 2036
- Table 9: Latin America Market Value (USD Billion) Forecast by Country, 2021 to 2036
- Table 10: Latin America Market Value (USD Billion) Forecast by Production Route, 2021 to 2036
- Table 11: Latin America Market Value (USD Billion) Forecast by Application, 2021 to 2036
- Table 12: Latin America Market Value (USD Billion) Forecast by End Use, 2021 to 2036
- Table 13: Western Europe Market Value (USD Billion) Forecast by Country, 2021 to 2036
- Table 14: Western Europe Market Value (USD Billion) Forecast by Production Route, 2021 to 2036
- Table 15: Western Europe Market Value (USD Billion) Forecast by Application, 2021 to 2036
- Table 16: Western Europe Market Value (USD Billion) Forecast by End Use, 2021 to 2036
- Table 17: Eastern Europe Market Value (USD Billion) Forecast by Country, 2021 to 2036
- Table 18: Eastern Europe Market Value (USD Billion) Forecast by Production Route, 2021 to 2036
- Table 19: Eastern Europe Market Value (USD Billion) Forecast by Application, 2021 to 2036
- Table 20: Eastern Europe Market Value (USD Billion) Forecast by End Use, 2021 to 2036
- Table 21: East Asia Market Value (USD Billion) Forecast by Country, 2021 to 2036
- Table 22: East Asia Market Value (USD Billion) Forecast by Production Route, 2021 to 2036
- Table 23: East Asia Market Value (USD Billion) Forecast by Application, 2021 to 2036
- Table 24: East Asia Market Value (USD Billion) Forecast by End Use, 2021 to 2036
- Table 25: South Asia and Pacific Market Value (USD Billion) Forecast by Country, 2021 to 2036
- Table 26: South Asia and Pacific Market Value (USD Billion) Forecast by Production Route, 2021 to 2036
- Table 27: South Asia and Pacific Market Value (USD Billion) Forecast by Application, 2021 to 2036
- Table 28: South Asia and Pacific Market Value (USD Billion) Forecast by End Use, 2021 to 2036
- Table 29: Middle East and Africa Market Value (USD Billion) Forecast by Country, 2021 to 2036
- Table 30: Middle East and Africa Market Value (USD Billion) Forecast by Production Route, 2021 to 2036
- Table 31: Middle East and Africa Market Value (USD Billion) Forecast by Application, 2021 to 2036
- Table 32: Middle East and Africa Market Value (USD Billion) Forecast by End Use, 2021 to 2036
List of Figures
- Figure 1: Global Market Pricing Analysis
- Figure 2: Global Market Value (USD Billion) Forecast 2021-2036
- Figure 3: Global Market Value Share and BPS Analysis by Production Route, 2026 and 2036
- Figure 4: Global Market Y-o-Y Growth Comparison by Production Route, 2026-2036
- Figure 5: Global Market Attractiveness Analysis by Production Route
- Figure 6: Global Market Value Share and BPS Analysis by Application, 2026 and 2036
- Figure 7: Global Market Y-o-Y Growth Comparison by Application, 2026-2036
- Figure 8: Global Market Attractiveness Analysis by Application
- Figure 9: Global Market Value Share and BPS Analysis by End Use, 2026 and 2036
- Figure 10: Global Market Y-o-Y Growth Comparison by End Use, 2026-2036
- Figure 11: Global Market Attractiveness Analysis by End Use
- Figure 12: Global Market Value (USD Billion) Share and BPS Analysis by Region, 2026 and 2036
- Figure 13: Global Market Y-o-Y Growth Comparison by Region, 2026-2036
- Figure 14: Global Market Attractiveness Analysis by Region
- Figure 15: North America Market Incremental Dollar Opportunity, 2026-2036
- Figure 16: Latin America Market Incremental Dollar Opportunity, 2026-2036
- Figure 17: Western Europe Market Incremental Dollar Opportunity, 2026-2036
- Figure 18: Eastern Europe Market Incremental Dollar Opportunity, 2026-2036
- Figure 19: East Asia Market Incremental Dollar Opportunity, 2026-2036
- Figure 20: South Asia and Pacific Market Incremental Dollar Opportunity, 2026-2036
- Figure 21: Middle East and Africa Market Incremental Dollar Opportunity, 2026-2036
- Figure 22: North America Market Value Share and BPS Analysis by Country, 2026 and 2036
- Figure 23: North America Market Value Share and BPS Analysis by Production Route, 2026 and 2036
- Figure 24: North America Market Y-o-Y Growth Comparison by Production Route, 2026-2036
- Figure 25: North America Market Attractiveness Analysis by Production Route
- Figure 26: North America Market Value Share and BPS Analysis by Application, 2026 and 2036
- Figure 27: North America Market Y-o-Y Growth Comparison by Application, 2026-2036
- Figure 28: North America Market Attractiveness Analysis by Application
- Figure 29: North America Market Value Share and BPS Analysis by End Use, 2026 and 2036
- Figure 30: North America Market Y-o-Y Growth Comparison by End Use, 2026-2036
- Figure 31: North America Market Attractiveness Analysis by End Use
- Figure 32: Latin America Market Value Share and BPS Analysis by Country, 2026 and 2036
- Figure 33: Latin America Market Value Share and BPS Analysis by Production Route, 2026 and 2036
- Figure 34: Latin America Market Y-o-Y Growth Comparison by Production Route, 2026-2036
- Figure 35: Latin America Market Attractiveness Analysis by Production Route
- Figure 36: Latin America Market Value Share and BPS Analysis by Application, 2026 and 2036
- Figure 37: Latin America Market Y-o-Y Growth Comparison by Application, 2026-2036
- Figure 38: Latin America Market Attractiveness Analysis by Application
- Figure 39: Latin America Market Value Share and BPS Analysis by End Use, 2026 and 2036
- Figure 40: Latin America Market Y-o-Y Growth Comparison by End Use, 2026-2036
- Figure 41: Latin America Market Attractiveness Analysis by End Use
- Figure 42: Western Europe Market Value Share and BPS Analysis by Country, 2026 and 2036
- Figure 43: Western Europe Market Value Share and BPS Analysis by Production Route, 2026 and 2036
- Figure 44: Western Europe Market Y-o-Y Growth Comparison by Production Route, 2026-2036
- Figure 45: Western Europe Market Attractiveness Analysis by Production Route
- Figure 46: Western Europe Market Value Share and BPS Analysis by Application, 2026 and 2036
- Figure 47: Western Europe Market Y-o-Y Growth Comparison by Application, 2026-2036
- Figure 48: Western Europe Market Attractiveness Analysis by Application
- Figure 49: Western Europe Market Value Share and BPS Analysis by End Use, 2026 and 2036
- Figure 50: Western Europe Market Y-o-Y Growth Comparison by End Use, 2026-2036
- Figure 51: Western Europe Market Attractiveness Analysis by End Use
- Figure 52: Eastern Europe Market Value Share and BPS Analysis by Country, 2026 and 2036
- Figure 53: Eastern Europe Market Value Share and BPS Analysis by Production Route, 2026 and 2036
- Figure 54: Eastern Europe Market Y-o-Y Growth Comparison by Production Route, 2026-2036
- Figure 55: Eastern Europe Market Attractiveness Analysis by Production Route
- Figure 56: Eastern Europe Market Value Share and BPS Analysis by Application, 2026 and 2036
- Figure 57: Eastern Europe Market Y-o-Y Growth Comparison by Application, 2026-2036
- Figure 58: Eastern Europe Market Attractiveness Analysis by Application
- Figure 59: Eastern Europe Market Value Share and BPS Analysis by End Use, 2026 and 2036
- Figure 60: Eastern Europe Market Y-o-Y Growth Comparison by End Use, 2026-2036
- Figure 61: Eastern Europe Market Attractiveness Analysis by End Use
- Figure 62: East Asia Market Value Share and BPS Analysis by Country, 2026 and 2036
- Figure 63: East Asia Market Value Share and BPS Analysis by Production Route, 2026 and 2036
- Figure 64: East Asia Market Y-o-Y Growth Comparison by Production Route, 2026-2036
- Figure 65: East Asia Market Attractiveness Analysis by Production Route
- Figure 66: East Asia Market Value Share and BPS Analysis by Application, 2026 and 2036
- Figure 67: East Asia Market Y-o-Y Growth Comparison by Application, 2026-2036
- Figure 68: East Asia Market Attractiveness Analysis by Application
- Figure 69: East Asia Market Value Share and BPS Analysis by End Use, 2026 and 2036
- Figure 70: East Asia Market Y-o-Y Growth Comparison by End Use, 2026-2036
- Figure 71: East Asia Market Attractiveness Analysis by End Use
- Figure 72: South Asia and Pacific Market Value Share and BPS Analysis by Country, 2026 and 2036
- Figure 73: South Asia and Pacific Market Value Share and BPS Analysis by Production Route, 2026 and 2036
- Figure 74: South Asia and Pacific Market Y-o-Y Growth Comparison by Production Route, 2026-2036
- Figure 75: South Asia and Pacific Market Attractiveness Analysis by Production Route
- Figure 76: South Asia and Pacific Market Value Share and BPS Analysis by Application, 2026 and 2036
- Figure 77: South Asia and Pacific Market Y-o-Y Growth Comparison by Application, 2026-2036
- Figure 78: South Asia and Pacific Market Attractiveness Analysis by Application
- Figure 79: South Asia and Pacific Market Value Share and BPS Analysis by End Use, 2026 and 2036
- Figure 80: South Asia and Pacific Market Y-o-Y Growth Comparison by End Use, 2026-2036
- Figure 81: South Asia and Pacific Market Attractiveness Analysis by End Use
- Figure 82: Middle East and Africa Market Value Share and BPS Analysis by Country, 2026 and 2036
- Figure 83: Middle East and Africa Market Value Share and BPS Analysis by Production Route, 2026 and 2036
- Figure 84: Middle East and Africa Market Y-o-Y Growth Comparison by Production Route, 2026-2036
- Figure 85: Middle East and Africa Market Attractiveness Analysis by Production Route
- Figure 86: Middle East and Africa Market Value Share and BPS Analysis by Application, 2026 and 2036
- Figure 87: Middle East and Africa Market Y-o-Y Growth Comparison by Application, 2026-2036
- Figure 88: Middle East and Africa Market Attractiveness Analysis by Application
- Figure 89: Middle East and Africa Market Value Share and BPS Analysis by End Use, 2026 and 2036
- Figure 90: Middle East and Africa Market Y-o-Y Growth Comparison by End Use, 2026-2036
- Figure 91: Middle East and Africa Market Attractiveness Analysis by End Use
- Figure 92: Global Market - Tier Structure Analysis
- Figure 93: Global Market - Company Share Analysis
Frequently Asked Questions
What is the size of the Acrolein Market?
The global acrolein market was valued at USD 1.30 billion in 2025 and is estimated at USD 1.34 billion in 2026. It is forecast to reach USD 1.80 billion by 2036, expanding at a CAGR of 3.0% from 2026 to 2036.
Which production route and application lead the Acrolein Market?
Propylene oxidation is estimated to account for 86.4% of demand by production route in 2026, while methionine is estimated to account for 54.8% by application.
Which country is likely to grow fastest in the Acrolein Market?
China is likely to grow at a 3.8% CAGR during the forecast period, followed by Singapore at 3.5%, India at 3.4%, Germany at 2.6% and the USA at 2.4%.
Does the market include acrolein formed during combustion?
No. Acrolein formed as an unwanted combustion or food processing contaminant is excluded. The market covers commercial acrolein sold for chemical conversion and industrial use.
Are finished methionine and glutaraldehyde sales included?
No. They are downstream applications, and their finished product revenue is excluded from the acrolein market.
Why does captive consumption matter?
A producer can use acrolein in its own plant, as Zhejiang NHU does for methionine while also selling to outside customers. [4] Total production therefore does not show how much is available to independent buyers. Competitive Analysis of the Acrolein Market Key Players
Preview the report firsthand - request a free sample
Get SampleGet the brochure for pricing and purchase details.
Get PDF
