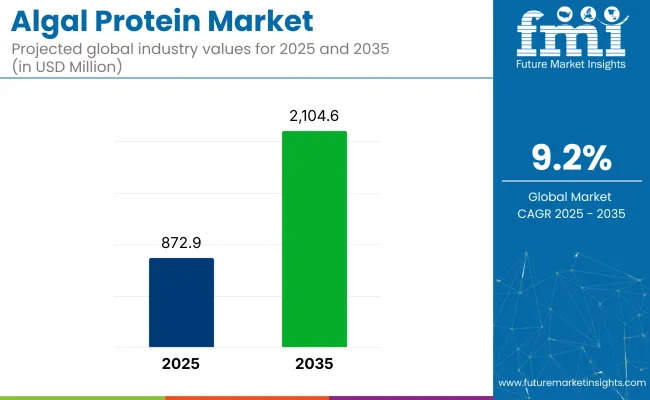
The global algal protein market is projected to be valued at USD 872.9 million in 2025 and is expected to reach USD 2,104.6 million by 2035, expanding at a CAGR of 9.2% over the assessment period from 2025 to 2035.
One of the main factors contributing to the market's growth is the rising consumers' needs for natural and sustainable protein sources. The increasing trend of plant-based diets and the growing consciousness about ecological sustainability have made algal protein a serious substitute for traditional animal-derived proteins.
Industrialists are undertaking numerous efforts to boost their foothold in the market by increasing their production capacities and bringing in investment in new extraction methodologies to improve product quality. Several giant companies have declared the opening of more plants to meet the growing demand for their products.
To illustrate, top manufacturers have started huge algae farming projects and are improving biotechnical processes to increase productivity. Companies like Corbion and Cyanotech are zeroing in on partnerships as well as undertaking research and development to provide top-tier algal protein for food, beverage, and dietary supplement producers.
The surge in the consumers' preference for clean-label products is influencing the market too, as buyers are looking for natural, non-GMO, and sustainably sourced ingredients more and more. The impact of this trend has also been that the companies are rearranging their product presentation, underlining the advantages of algal protein, such as high digestibility and the presence of essential amino acids.
Besides, the direction of food brands adding algal protein to functional foods, plant-based meat alternatives, and nutritional supplements is in the right line that draws more health-oriented consumers.
Attributes | Description |
---|---|
Estimated Global Algal Protein Business Size (2025E) | USD 872.9 million |
Projected Global Algal Protein Business Value (2035F) | USD 2,104.6 million |
Value-based CAGR (2025 to 2035) | 9.2% |
At the same time, investments are ramping up from the biotechnology companies and venture capitalists; thus, the advances in algal protein production are being propelled. Consumers' focus on health, sustainability, and innovation constitutes a positive outlook for the global algal protein industry, which is expected to have a steady rise and offer many opportunities for old and new players.
The comparative analysis of the global algal protein market, which presents the difference in the CAGR for the base year (2024) and the current year (2025) over six months, is shown in the table below. This study brings out the key alternations in the growth paths, thereby assisting stakeholders to have a better grasp of the fluctuations in the revenue realization in the mentioned period.
Particular | Value CAGR |
---|---|
H1 | 8.8% (2024 to 2034) |
H2 | 9.2% (2024 to 2034) |
H1 | 9.0% (2025 to 2035) |
H2 | 9.3% (2025 to 2035) |
The first half (H1) of the year is from January to June, and the second half (H2) is from July to December. In the initial half of the decade between 2025 and 2035, the market is foreseen to rise at a CAGR of 8.8%, while this will be followed by the latter half (H2) with 9.2%.
Over time, there are expectations regarding the increase in the figures for H1 2025 until H2 2035; thus, it is predicted that the CAGR will increase 9.0% in the first half, and the rate will be constant at 9.3% in the second half. The market saw an overall increase in BPS of 20 in H1, while an increase of 10 was recorded in H2.
Growth in the Premium Algal Protein Products
The global algal protein market is experiencing a growing demand for premium products that are targets of consumers getting more and more health-conscious and choosy about their protein sources. This transition to high-quality, nutrient-rich alternatives has resulted in a rise in algal protein prices for premium brands, especially those that are organically certified or are of a higher nutritional profile.
These premium products are addressing an ever-increasing number of customers who are willing to pay for environmental sustainability, better flavor, and functional health effects. Manufacturers fully exploit this trend by producing high-tech protein formulations that are intended for athletes, fitness fans, and consumers who are looking for plant-based protein sources with higher purity.
This line of thought leads us to the observation that currently, the price difference between traditional and premium algal protein is quite wide, which in turn affects the sales and innovation in the premium segment.
Rising Demand for Ready-to-Consume Algal Protein Products
The global shift toward a more ingredient-based lifestyle has also been a great help for indoor consumption products, such as ready-to-eat foods and ready-to-drink beverages that have algal protein as one of their constituents. Consumers, particularly city dwellers, need more protein options that can be consumed quickly without causing health problems. This trend has resulted in manufacturers ' formation of such types of protein bars, shakes, and plant-based meat alternatives with algal protein.
The innovativeness regarding flavors, textures, and the length of time the product can stay on shelves, as well as the health benefits of algae-derived protein, have made such products rise in popularity among athletes, office workers, and kids. Companies are working on improving the taste, texture, and product shelf life to attract a wider audience. These strategies are driving competition in the functional food market and leading businesses to explore new product formats that coincide with the desires of consumers.
Regional Adaptation Strategies for Algal Protein
Cities, as well as other regions, consume the algal protein-based products at various rates, which vary according to the diet, water land regulations, and the level of information for the consumers. Thus, algae protein is seen as a major ingredient in food and Nutrition applications in North America and Europe since these countries have a growth of plant-based diets. In contrast, regions like the Asia-Pacific are seeing increased interest in algae-derived protein due to traditional consumption patterns of seaweed and plant-based proteins.
Companies are adapting their marketing strategies to the local market demands by changing product formulations, local tastes, and dietary habits. Besides, manufacturers are securing partnerships with governments and food regulators to carry out the approvals and certifications for algal protein, which in turn simplifies market entry. The regional adaptation strategies also include localized branding, culturally relevant product positioning, and strategic partnerships with local food producers to boost consumer acceptance.
Sustainable and Ethical Sourcing of Algal Protein
Sustainability has become a significant emphasis in the global algae protein sector as consumers look for eco-friendly and ethically sourced protein alternatives. Due to the increasing concerns about the destruction of the environment and the ecological footprint concerning the consumption of conventional protein, algae proteins are being promoted as a sustainable source. Manufacturers are turning to closed-loop production systems and bioreactors for their environmentally sustainable modes of algae cultivation, hence achieving the same.
The practices of sourcing ethically have trade agreements concerning algae with farmers and transparency in the production process, which are gaining importance among eco-living consumers. Brands are demonstrating their dedication to sustainability through certifications, eco-friendly packaging, and claims of carbon-neutral production. These actions not only reinforce consumer trust but also strengthen their brand loyalty, thus associating algal protein with a responsible and sustainable future in the global protein market.
The global algal protein market is a unique blend of both organized and unlicensed players; however, the local characteristics of the respective regions impact the competition and market penetration. The mixture of established manufacturers and new local players has materialized as the cornerstone of a creative framework that, as the saying goes, innovation, scale of production, and distribution strategies make market shares.
Organized Market Players: The organized players in the algal protein market include the ones who manufacturer in large-scale, biotechnology companies that reproduce algae efficiently and have high production levels. These companies are focused on standardization of the product, regulations compliance, and the global distribution network.
They have built sufficient research and developmental capabilities that promote the production of consistent quality and pure algal protein products. Numerous organized manufacturers have entered into collaborations with many food and beverage enterprises, dietary supplement companies, and nutraceutical companies that take on algal protein in their products.
Unorganized Market Players: The unorganized sector consists of regions with small and medium entrepreneurs, manufacturers, and individual algae producers. These players frequently serve their respective local markets and are constrained by the fact that they do not have the technological means required for their production.
Their main activities revolve around the distribution of raw algae products or their use in many functional foods, animal feed, and personal care products. Although they might not reach as far as the organized companies, a considerable number of regional producers have managed to get lower production costs, are allowed to customize their operations more freely, and maintain a close relationship with local buyers.
With consumers constantly changing their preferences, strategic branding and product differentiation efforts are expected to further stimulate demand. The companies put in place research and development initiatives that focus on taste, texture, and formulation compatibility so that algal protein can easily find its way to mainstream food products.
Algal protein carries strong growth potential throughout the next decade thanks to the fact that it is perceived as a valuable solution in the alternative protein field using sustainability to drive the consumer decision-making process.
The following table shows the estimated growth rates of the top five territories. These are set to exhibit high consumption through 2035.
Countries | Market Volume (2025) |
---|---|
United States | USD 200 million |
China | USD 180 million |
India | USD 150 million |
Germany | USD 120 million |
United Kingdom | USD 100 million |
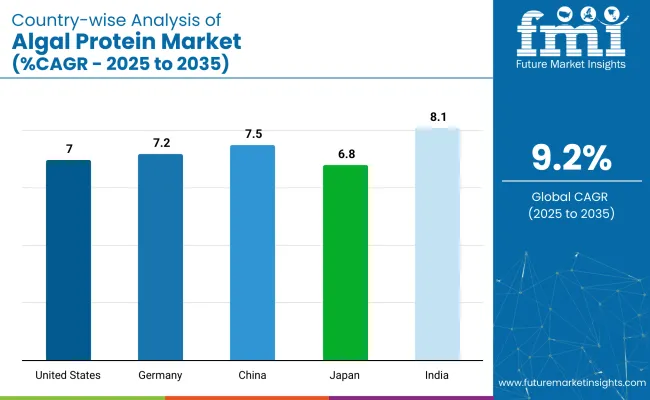
Countries | CAGR (2025 to 2035) |
---|---|
United States | 6.5% |
China | 10.3% |
India | 12.5% |
Germany | 4.3% |
United Kingdom | 7.1% |
With the amount of 200 million USA dollars (2025 E), the biggest airspace contributor to the global algal protein market is the United States. The forecasted compound annual growth rate (CAGR) for the period between 2025 and 2035 will be 6.5%. The realization of such figures is primarily based on the growing consumer awareness of plant protein sources and the desire for sustainable protein substitutes in the USA market.
The USA market also benefits significantly from state-of-the-art research in algae cultivation and processing technologies, which gives birth to algal protein products of the highest quality. Simultaneously, the expanded portfolios of food and beverage companies that work with algal protein producers include the incorporation of algal protein in various food items, supplements, and functional beverages. Furthermore, the market's increment in the USA is consistent with an investment in green food sources that achieve high regulatory characteristics.
With an expected market capacity of USD 180 million in 2025, China's microalgae for protein production is experiencing a boom and is set for a stellar CAGR of 10.3% through 2035. China benefits from the establishment of large-scale algae cultivation systems as well as significant investments in research and technology. The Chinese government is favourable to agriculture caring for the environment, and instead of proteins such as algae among consumer demands, negatives such as meat processing remain.
Furthermore, nutritionists believe that the mixing of algal protein in food is an easy way for people, both traditional and modern, to consume protein, to get protein. Also, the expansion of domestic production capacities as a result of the alliances with the global participants that are strategic are fuelling China's growth in the global algal protein market.
Thanks to the projected market volume of USD 150 million in 2025 and its astonishing CAGR of 12.5% over the period from 2025 to 2035, India is setting the pace in the algal protein business. The vegetarian population is swollen and invariably people are deciding to eat more healthily. With the demand for non-animal proteins hitting the roof, algae protein is being recognized as the healthiest and most environmentally-friendly alternative.
Indian companies producing nutritional supplements are adopting the new trends and launching products containing algae protein, like organic spirulina powders and protein bars, to be in harmony with consumer preferences. Also, government programmes aimed at sustainable agriculture and the support given to start-ups in the biotech space are collateral to the developments in the market in India.
Segment | Value Share (2025) |
---|---|
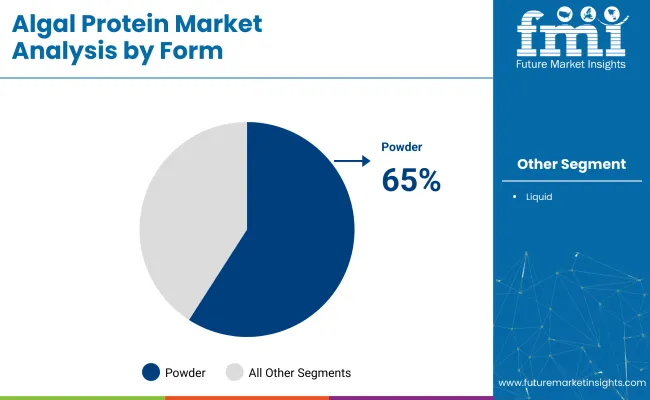
Powder (By Form) | 65% |
Powdered algal protein is the product form with the largest market share of about 65% in 2025, by its high practicality and being easily used in various applications. The powdered form is the most used in dietary supplements, protein shakes, and functional food products. Users favor powder because of its high protein content, longer shelf life, and the ability of different product formulations to have it.
Manufacturers are majorly dealing with the solubility and taste profile improvements of the powered form to address a significant proportion of the market, which includes fitness lovers, sportspeople, and those on plant-based diets. The production of powdered algal protein is more economical than that of the liquid, further proving its dominance in the market. The increasing popularity of plant-based proteins is projected to keep powdered algal protein on the growth path throughout the review period as it is a healthy option.
Segment | Value Share (2025) |
---|---|
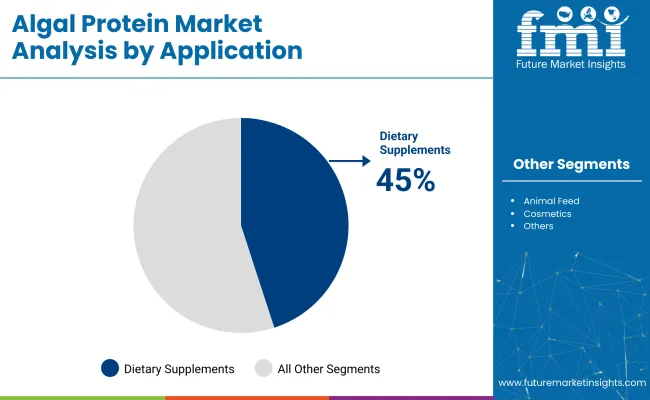
Dietary Supplements (By Application) | 45% |
Dietary supplements hold the bulk of the algal protein application category, where they make up 45% of the market in 2025, with the driving force coming from consumers who are intensively looking for plant-based, nutrient-rich options as replacements for animal protein. The presence of algal protein with essential amino acids and omega-3 fatty acids makes a popular and preferred item in the health and wellness industry.
The continuous increase in awareness of how algae protein helps with muscle recovery, weight management, and overall health has positively impacted its consumption in capsule, tabulated, and powdered forms. The rise in the number of vegans and vegetarians is also contributing to the increasing popularity of this product.
Manufacturers are coming up with products that include algae protein apart from the superfoods they currently offer, thus broadening the segment. Algal protein is also expected to play a significant part in the dietary supplement industry as the global need for plant-based supplements increases.
The global algal protein market is actively growing, as there has been an increase in the consumption of non-invention and plant-based protein sources, mostly bought by consumers. The main players are directing their energies to the increase in production capacity, investments in R&D, and entering into partnerships that would result in stronger brands. The competition within the industry is a combination of long-standing, reputable companies as well as brand new startups, different from each other in that respect.
For Instance:
The market is segmented into powder and liquid forms.
Segmentation includes marine algae and freshwater algae.
The market is divided into spirulina and chlorella types.
Applications encompass dietary supplements, food and beverages, animal feed, cosmetics, and others.
The market is analyzed across North America, Latin America, Western Europe, Eastern Europe, South Asia & Pacific, East Asia, Central Asia, Balkan and Baltic countries, Russia and Belarus, and the Middle East & Africa.
Table 1: Global Market Value (US$ Million) Forecast by Region, 2018 to 2033
Table 2: Global Market Volume (Tons) Forecast by Region, 2018 to 2033
Table 3: Global Market Value (US$ Million) Forecast by Form, 2018 to 2033
Table 4: Global Market Volume (Tons) Forecast by Form, 2018 to 2033
Table 5: Global Market Value (US$ Million) Forecast by Source, 2018 to 2033
Table 6: Global Market Volume (Tons) Forecast by Source, 2018 to 2033
Table 7: Global Market Value (US$ Million) Forecast by Type, 2018 to 2033
Table 8: Global Market Volume (Tons) Forecast by Type, 2018 to 2033
Table 9: Global Market Value (US$ Million) Forecast by Application, 2018 to 2033
Table 10: Global Market Volume (Tons) Forecast by Application, 2018 to 2033
Table 11: North America Market Value (US$ Million) Forecast by Country, 2018 to 2033
Table 12: North America Market Volume (Tons) Forecast by Country, 2018 to 2033
Table 13: North America Market Value (US$ Million) Forecast by Form, 2018 to 2033
Table 14: North America Market Volume (Tons) Forecast by Form, 2018 to 2033
Table 15: North America Market Value (US$ Million) Forecast by Source, 2018 to 2033
Table 16: North America Market Volume (Tons) Forecast by Source, 2018 to 2033
Table 17: North America Market Value (US$ Million) Forecast by Type, 2018 to 2033
Table 18: North America Market Volume (Tons) Forecast by Type, 2018 to 2033
Table 19: North America Market Value (US$ Million) Forecast by Application, 2018 to 2033
Table 20: North America Market Volume (Tons) Forecast by Application, 2018 to 2033
Table 21: Latin America Market Value (US$ Million) Forecast by Country, 2018 to 2033
Table 22: Latin America Market Volume (Tons) Forecast by Country, 2018 to 2033
Table 23: Latin America Market Value (US$ Million) Forecast by Form, 2018 to 2033
Table 24: Latin America Market Volume (Tons) Forecast by Form, 2018 to 2033
Table 25: Latin America Market Value (US$ Million) Forecast by Source, 2018 to 2033
Table 26: Latin America Market Volume (Tons) Forecast by Source, 2018 to 2033
Table 27: Latin America Market Value (US$ Million) Forecast by Type, 2018 to 2033
Table 28: Latin America Market Volume (Tons) Forecast by Type, 2018 to 2033
Table 29: Latin America Market Value (US$ Million) Forecast by Application, 2018 to 2033
Table 30: Latin America Market Volume (Tons) Forecast by Application, 2018 to 2033
Table 31: Western Europe Market Value (US$ Million) Forecast by Country, 2018 to 2033
Table 32: Western Europe Market Volume (Tons) Forecast by Country, 2018 to 2033
Table 33: Western Europe Market Value (US$ Million) Forecast by Form, 2018 to 2033
Table 34: Western Europe Market Volume (Tons) Forecast by Form, 2018 to 2033
Table 35: Western Europe Market Value (US$ Million) Forecast by Source, 2018 to 2033
Table 36: Western Europe Market Volume (Tons) Forecast by Source, 2018 to 2033
Table 37: Western Europe Market Value (US$ Million) Forecast by Type, 2018 to 2033
Table 38: Western Europe Market Volume (Tons) Forecast by Type, 2018 to 2033
Table 39: Western Europe Market Value (US$ Million) Forecast by Application, 2018 to 2033
Table 40: Western Europe Market Volume (Tons) Forecast by Application, 2018 to 2033
Table 41: Eastern Europe Market Value (US$ Million) Forecast by Country, 2018 to 2033
Table 42: Eastern Europe Market Volume (Tons) Forecast by Country, 2018 to 2033
Table 43: Eastern Europe Market Value (US$ Million) Forecast by Form, 2018 to 2033
Table 44: Eastern Europe Market Volume (Tons) Forecast by Form, 2018 to 2033
Table 45: Eastern Europe Market Value (US$ Million) Forecast by Source, 2018 to 2033
Table 46: Eastern Europe Market Volume (Tons) Forecast by Source, 2018 to 2033
Table 47: Eastern Europe Market Value (US$ Million) Forecast by Type, 2018 to 2033
Table 48: Eastern Europe Market Volume (Tons) Forecast by Type, 2018 to 2033
Table 49: Eastern Europe Market Value (US$ Million) Forecast by Application, 2018 to 2033
Table 50: Eastern Europe Market Volume (Tons) Forecast by Application, 2018 to 2033
Table 51: South Asia and Pacific Market Value (US$ Million) Forecast by Country, 2018 to 2033
Table 52: South Asia and Pacific Market Volume (Tons) Forecast by Country, 2018 to 2033
Table 53: South Asia and Pacific Market Value (US$ Million) Forecast by Form, 2018 to 2033
Table 54: South Asia and Pacific Market Volume (Tons) Forecast by Form, 2018 to 2033
Table 55: South Asia and Pacific Market Value (US$ Million) Forecast by Source, 2018 to 2033
Table 56: South Asia and Pacific Market Volume (Tons) Forecast by Source, 2018 to 2033
Table 57: South Asia and Pacific Market Value (US$ Million) Forecast by Type, 2018 to 2033
Table 58: South Asia and Pacific Market Volume (Tons) Forecast by Type, 2018 to 2033
Table 59: South Asia and Pacific Market Value (US$ Million) Forecast by Application, 2018 to 2033
Table 60: South Asia and Pacific Market Volume (Tons) Forecast by Application, 2018 to 2033
Table 61: East Asia Market Value (US$ Million) Forecast by Country, 2018 to 2033
Table 62: East Asia Market Volume (Tons) Forecast by Country, 2018 to 2033
Table 63: East Asia Market Value (US$ Million) Forecast by Form, 2018 to 2033
Table 64: East Asia Market Volume (Tons) Forecast by Form, 2018 to 2033
Table 65: East Asia Market Value (US$ Million) Forecast by Source, 2018 to 2033
Table 66: East Asia Market Volume (Tons) Forecast by Source, 2018 to 2033
Table 67: East Asia Market Value (US$ Million) Forecast by Type, 2018 to 2033
Table 68: East Asia Market Volume (Tons) Forecast by Type, 2018 to 2033
Table 69: East Asia Market Value (US$ Million) Forecast by Application, 2018 to 2033
Table 70: East Asia Market Volume (Tons) Forecast by Application, 2018 to 2033
Table 71: Middle East and Africa Market Value (US$ Million) Forecast by Country, 2018 to 2033
Table 72: Middle East and Africa Market Volume (Tons) Forecast by Country, 2018 to 2033
Table 73: Middle East and Africa Market Value (US$ Million) Forecast by Form, 2018 to 2033
Table 74: Middle East and Africa Market Volume (Tons) Forecast by Form, 2018 to 2033
Table 75: Middle East and Africa Market Value (US$ Million) Forecast by Source, 2018 to 2033
Table 76: Middle East and Africa Market Volume (Tons) Forecast by Source, 2018 to 2033
Table 77: Middle East and Africa Market Value (US$ Million) Forecast by Type, 2018 to 2033
Table 78: Middle East and Africa Market Volume (Tons) Forecast by Type, 2018 to 2033
Table 79: Middle East and Africa Market Value (US$ Million) Forecast by Application, 2018 to 2033
Table 80: Middle East and Africa Market Volume (Tons) Forecast by Application, 2018 to 2033
Figure 1: Global Market Value (US$ Million) by Form, 2023 to 2033
Figure 2: Global Market Value (US$ Million) by Source, 2023 to 2033
Figure 3: Global Market Value (US$ Million) by Type, 2023 to 2033
Figure 4: Global Market Value (US$ Million) by Application, 2023 to 2033
Figure 5: Global Market Value (US$ Million) by Region, 2023 to 2033
Figure 6: Global Market Value (US$ Million) Analysis by Region, 2018 to 2033
Figure 7: Global Market Volume (Tons) Analysis by Region, 2018 to 2033
Figure 8: Global Market Value Share (%) and BPS Analysis by Region, 2023 to 2033
Figure 9: Global Market Y-o-Y Growth (%) Projections by Region, 2023 to 2033
Figure 10: Global Market Value (US$ Million) Analysis by Form, 2018 to 2033
Figure 11: Global Market Volume (Tons) Analysis by Form, 2018 to 2033
Figure 12: Global Market Value Share (%) and BPS Analysis by Form, 2023 to 2033
Figure 13: Global Market Y-o-Y Growth (%) Projections by Form, 2023 to 2033
Figure 14: Global Market Value (US$ Million) Analysis by Source, 2018 to 2033
Figure 15: Global Market Volume (Tons) Analysis by Source, 2018 to 2033
Figure 16: Global Market Value Share (%) and BPS Analysis by Source, 2023 to 2033
Figure 17: Global Market Y-o-Y Growth (%) Projections by Source, 2023 to 2033
Figure 18: Global Market Value (US$ Million) Analysis by Type, 2018 to 2033
Figure 19: Global Market Volume (Tons) Analysis by Type, 2018 to 2033
Figure 20: Global Market Value Share (%) and BPS Analysis by Type, 2023 to 2033
Figure 21: Global Market Y-o-Y Growth (%) Projections by Type, 2023 to 2033
Figure 22: Global Market Value (US$ Million) Analysis by Application, 2018 to 2033
Figure 23: Global Market Volume (Tons) Analysis by Application, 2018 to 2033
Figure 24: Global Market Value Share (%) and BPS Analysis by Application, 2023 to 2033
Figure 25: Global Market Y-o-Y Growth (%) Projections by Application, 2023 to 2033
Figure 26: Global Market Attractiveness by Form, 2023 to 2033
Figure 27: Global Market Attractiveness by Source, 2023 to 2033
Figure 28: Global Market Attractiveness by Type, 2023 to 2033
Figure 29: Global Market Attractiveness by Application, 2023 to 2033
Figure 30: Global Market Attractiveness by Region, 2023 to 2033
Figure 31: North America Market Value (US$ Million) by Form, 2023 to 2033
Figure 32: North America Market Value (US$ Million) by Source, 2023 to 2033
Figure 33: North America Market Value (US$ Million) by Type, 2023 to 2033
Figure 34: North America Market Value (US$ Million) by Application, 2023 to 2033
Figure 35: North America Market Value (US$ Million) by Country, 2023 to 2033
Figure 36: North America Market Value (US$ Million) Analysis by Country, 2018 to 2033
Figure 37: North America Market Volume (Tons) Analysis by Country, 2018 to 2033
Figure 38: North America Market Value Share (%) and BPS Analysis by Country, 2023 to 2033
Figure 39: North America Market Y-o-Y Growth (%) Projections by Country, 2023 to 2033
Figure 40: North America Market Value (US$ Million) Analysis by Form, 2018 to 2033
Figure 41: North America Market Volume (Tons) Analysis by Form, 2018 to 2033
Figure 42: North America Market Value Share (%) and BPS Analysis by Form, 2023 to 2033
Figure 43: North America Market Y-o-Y Growth (%) Projections by Form, 2023 to 2033
Figure 44: North America Market Value (US$ Million) Analysis by Source, 2018 to 2033
Figure 45: North America Market Volume (Tons) Analysis by Source, 2018 to 2033
Figure 46: North America Market Value Share (%) and BPS Analysis by Source, 2023 to 2033
Figure 47: North America Market Y-o-Y Growth (%) Projections by Source, 2023 to 2033
Figure 48: North America Market Value (US$ Million) Analysis by Type, 2018 to 2033
Figure 49: North America Market Volume (Tons) Analysis by Type, 2018 to 2033
Figure 50: North America Market Value Share (%) and BPS Analysis by Type, 2023 to 2033
Figure 51: North America Market Y-o-Y Growth (%) Projections by Type, 2023 to 2033
Figure 52: North America Market Value (US$ Million) Analysis by Application, 2018 to 2033
Figure 53: North America Market Volume (Tons) Analysis by Application, 2018 to 2033
Figure 54: North America Market Value Share (%) and BPS Analysis by Application, 2023 to 2033
Figure 55: North America Market Y-o-Y Growth (%) Projections by Application, 2023 to 2033
Figure 56: North America Market Attractiveness by Form, 2023 to 2033
Figure 57: North America Market Attractiveness by Source, 2023 to 2033
Figure 58: North America Market Attractiveness by Type, 2023 to 2033
Figure 59: North America Market Attractiveness by Application, 2023 to 2033
Figure 60: North America Market Attractiveness by Country, 2023 to 2033
Figure 61: Latin America Market Value (US$ Million) by Form, 2023 to 2033
Figure 62: Latin America Market Value (US$ Million) by Source, 2023 to 2033
Figure 63: Latin America Market Value (US$ Million) by Type, 2023 to 2033
Figure 64: Latin America Market Value (US$ Million) by Application, 2023 to 2033
Figure 65: Latin America Market Value (US$ Million) by Country, 2023 to 2033
Figure 66: Latin America Market Value (US$ Million) Analysis by Country, 2018 to 2033
Figure 67: Latin America Market Volume (Tons) Analysis by Country, 2018 to 2033
Figure 68: Latin America Market Value Share (%) and BPS Analysis by Country, 2023 to 2033
Figure 69: Latin America Market Y-o-Y Growth (%) Projections by Country, 2023 to 2033
Figure 70: Latin America Market Value (US$ Million) Analysis by Form, 2018 to 2033
Figure 71: Latin America Market Volume (Tons) Analysis by Form, 2018 to 2033
Figure 72: Latin America Market Value Share (%) and BPS Analysis by Form, 2023 to 2033
Figure 73: Latin America Market Y-o-Y Growth (%) Projections by Form, 2023 to 2033
Figure 74: Latin America Market Value (US$ Million) Analysis by Source, 2018 to 2033
Figure 75: Latin America Market Volume (Tons) Analysis by Source, 2018 to 2033
Figure 76: Latin America Market Value Share (%) and BPS Analysis by Source, 2023 to 2033
Figure 77: Latin America Market Y-o-Y Growth (%) Projections by Source, 2023 to 2033
Figure 78: Latin America Market Value (US$ Million) Analysis by Type, 2018 to 2033
Figure 79: Latin America Market Volume (Tons) Analysis by Type, 2018 to 2033
Figure 80: Latin America Market Value Share (%) and BPS Analysis by Type, 2023 to 2033
Figure 81: Latin America Market Y-o-Y Growth (%) Projections by Type, 2023 to 2033
Figure 82: Latin America Market Value (US$ Million) Analysis by Application, 2018 to 2033
Figure 83: Latin America Market Volume (Tons) Analysis by Application, 2018 to 2033
Figure 84: Latin America Market Value Share (%) and BPS Analysis by Application, 2023 to 2033
Figure 85: Latin America Market Y-o-Y Growth (%) Projections by Application, 2023 to 2033
Figure 86: Latin America Market Attractiveness by Form, 2023 to 2033
Figure 87: Latin America Market Attractiveness by Source, 2023 to 2033
Figure 88: Latin America Market Attractiveness by Type, 2023 to 2033
Figure 89: Latin America Market Attractiveness by Application, 2023 to 2033
Figure 90: Latin America Market Attractiveness by Country, 2023 to 2033
Figure 91: Western Europe Market Value (US$ Million) by Form, 2023 to 2033
Figure 92: Western Europe Market Value (US$ Million) by Source, 2023 to 2033
Figure 93: Western Europe Market Value (US$ Million) by Type, 2023 to 2033
Figure 94: Western Europe Market Value (US$ Million) by Application, 2023 to 2033
Figure 95: Western Europe Market Value (US$ Million) by Country, 2023 to 2033
Figure 96: Western Europe Market Value (US$ Million) Analysis by Country, 2018 to 2033
Figure 97: Western Europe Market Volume (Tons) Analysis by Country, 2018 to 2033
Figure 98: Western Europe Market Value Share (%) and BPS Analysis by Country, 2023 to 2033
Figure 99: Western Europe Market Y-o-Y Growth (%) Projections by Country, 2023 to 2033
Figure 100: Western Europe Market Value (US$ Million) Analysis by Form, 2018 to 2033
Figure 101: Western Europe Market Volume (Tons) Analysis by Form, 2018 to 2033
Figure 102: Western Europe Market Value Share (%) and BPS Analysis by Form, 2023 to 2033
Figure 103: Western Europe Market Y-o-Y Growth (%) Projections by Form, 2023 to 2033
Figure 104: Western Europe Market Value (US$ Million) Analysis by Source, 2018 to 2033
Figure 105: Western Europe Market Volume (Tons) Analysis by Source, 2018 to 2033
Figure 106: Western Europe Market Value Share (%) and BPS Analysis by Source, 2023 to 2033
Figure 107: Western Europe Market Y-o-Y Growth (%) Projections by Source, 2023 to 2033
Figure 108: Western Europe Market Value (US$ Million) Analysis by Type, 2018 to 2033
Figure 109: Western Europe Market Volume (Tons) Analysis by Type, 2018 to 2033
Figure 110: Western Europe Market Value Share (%) and BPS Analysis by Type, 2023 to 2033
Figure 111: Western Europe Market Y-o-Y Growth (%) Projections by Type, 2023 to 2033
Figure 112: Western Europe Market Value (US$ Million) Analysis by Application, 2018 to 2033
Figure 113: Western Europe Market Volume (Tons) Analysis by Application, 2018 to 2033
Figure 114: Western Europe Market Value Share (%) and BPS Analysis by Application, 2023 to 2033
Figure 115: Western Europe Market Y-o-Y Growth (%) Projections by Application, 2023 to 2033
Figure 116: Western Europe Market Attractiveness by Form, 2023 to 2033
Figure 117: Western Europe Market Attractiveness by Source, 2023 to 2033
Figure 118: Western Europe Market Attractiveness by Type, 2023 to 2033
Figure 119: Western Europe Market Attractiveness by Application, 2023 to 2033
Figure 120: Western Europe Market Attractiveness by Country, 2023 to 2033
Figure 121: Eastern Europe Market Value (US$ Million) by Form, 2023 to 2033
Figure 122: Eastern Europe Market Value (US$ Million) by Source, 2023 to 2033
Figure 123: Eastern Europe Market Value (US$ Million) by Type, 2023 to 2033
Figure 124: Eastern Europe Market Value (US$ Million) by Application, 2023 to 2033
Figure 125: Eastern Europe Market Value (US$ Million) by Country, 2023 to 2033
Figure 126: Eastern Europe Market Value (US$ Million) Analysis by Country, 2018 to 2033
Figure 127: Eastern Europe Market Volume (Tons) Analysis by Country, 2018 to 2033
Figure 128: Eastern Europe Market Value Share (%) and BPS Analysis by Country, 2023 to 2033
Figure 129: Eastern Europe Market Y-o-Y Growth (%) Projections by Country, 2023 to 2033
Figure 130: Eastern Europe Market Value (US$ Million) Analysis by Form, 2018 to 2033
Figure 131: Eastern Europe Market Volume (Tons) Analysis by Form, 2018 to 2033
Figure 132: Eastern Europe Market Value Share (%) and BPS Analysis by Form, 2023 to 2033
Figure 133: Eastern Europe Market Y-o-Y Growth (%) Projections by Form, 2023 to 2033
Figure 134: Eastern Europe Market Value (US$ Million) Analysis by Source, 2018 to 2033
Figure 135: Eastern Europe Market Volume (Tons) Analysis by Source, 2018 to 2033
Figure 136: Eastern Europe Market Value Share (%) and BPS Analysis by Source, 2023 to 2033
Figure 137: Eastern Europe Market Y-o-Y Growth (%) Projections by Source, 2023 to 2033
Figure 138: Eastern Europe Market Value (US$ Million) Analysis by Type, 2018 to 2033
Figure 139: Eastern Europe Market Volume (Tons) Analysis by Type, 2018 to 2033
Figure 140: Eastern Europe Market Value Share (%) and BPS Analysis by Type, 2023 to 2033
Figure 141: Eastern Europe Market Y-o-Y Growth (%) Projections by Type, 2023 to 2033
Figure 142: Eastern Europe Market Value (US$ Million) Analysis by Application, 2018 to 2033
Figure 143: Eastern Europe Market Volume (Tons) Analysis by Application, 2018 to 2033
Figure 144: Eastern Europe Market Value Share (%) and BPS Analysis by Application, 2023 to 2033
Figure 145: Eastern Europe Market Y-o-Y Growth (%) Projections by Application, 2023 to 2033
Figure 146: Eastern Europe Market Attractiveness by Form, 2023 to 2033
Figure 147: Eastern Europe Market Attractiveness by Source, 2023 to 2033
Figure 148: Eastern Europe Market Attractiveness by Type, 2023 to 2033
Figure 149: Eastern Europe Market Attractiveness by Application, 2023 to 2033
Figure 150: Eastern Europe Market Attractiveness by Country, 2023 to 2033
Figure 151: South Asia and Pacific Market Value (US$ Million) by Form, 2023 to 2033
Figure 152: South Asia and Pacific Market Value (US$ Million) by Source, 2023 to 2033
Figure 153: South Asia and Pacific Market Value (US$ Million) by Type, 2023 to 2033
Figure 154: South Asia and Pacific Market Value (US$ Million) by Application, 2023 to 2033
Figure 155: South Asia and Pacific Market Value (US$ Million) by Country, 2023 to 2033
Figure 156: South Asia and Pacific Market Value (US$ Million) Analysis by Country, 2018 to 2033
Figure 157: South Asia and Pacific Market Volume (Tons) Analysis by Country, 2018 to 2033
Figure 158: South Asia and Pacific Market Value Share (%) and BPS Analysis by Country, 2023 to 2033
Figure 159: South Asia and Pacific Market Y-o-Y Growth (%) Projections by Country, 2023 to 2033
Figure 160: South Asia and Pacific Market Value (US$ Million) Analysis by Form, 2018 to 2033
Figure 161: South Asia and Pacific Market Volume (Tons) Analysis by Form, 2018 to 2033
Figure 162: South Asia and Pacific Market Value Share (%) and BPS Analysis by Form, 2023 to 2033
Figure 163: South Asia and Pacific Market Y-o-Y Growth (%) Projections by Form, 2023 to 2033
Figure 164: South Asia and Pacific Market Value (US$ Million) Analysis by Source, 2018 to 2033
Figure 165: South Asia and Pacific Market Volume (Tons) Analysis by Source, 2018 to 2033
Figure 166: South Asia and Pacific Market Value Share (%) and BPS Analysis by Source, 2023 to 2033
Figure 167: South Asia and Pacific Market Y-o-Y Growth (%) Projections by Source, 2023 to 2033
Figure 168: South Asia and Pacific Market Value (US$ Million) Analysis by Type, 2018 to 2033
Figure 169: South Asia and Pacific Market Volume (Tons) Analysis by Type, 2018 to 2033
Figure 170: South Asia and Pacific Market Value Share (%) and BPS Analysis by Type, 2023 to 2033
Figure 171: South Asia and Pacific Market Y-o-Y Growth (%) Projections by Type, 2023 to 2033
Figure 172: South Asia and Pacific Market Value (US$ Million) Analysis by Application, 2018 to 2033
Figure 173: South Asia and Pacific Market Volume (Tons) Analysis by Application, 2018 to 2033
Figure 174: South Asia and Pacific Market Value Share (%) and BPS Analysis by Application, 2023 to 2033
Figure 175: South Asia and Pacific Market Y-o-Y Growth (%) Projections by Application, 2023 to 2033
Figure 176: South Asia and Pacific Market Attractiveness by Form, 2023 to 2033
Figure 177: South Asia and Pacific Market Attractiveness by Source, 2023 to 2033
Figure 178: South Asia and Pacific Market Attractiveness by Type, 2023 to 2033
Figure 179: South Asia and Pacific Market Attractiveness by Application, 2023 to 2033
Figure 180: South Asia and Pacific Market Attractiveness by Country, 2023 to 2033
Figure 181: East Asia Market Value (US$ Million) by Form, 2023 to 2033
Figure 182: East Asia Market Value (US$ Million) by Source, 2023 to 2033
Figure 183: East Asia Market Value (US$ Million) by Type, 2023 to 2033
Figure 184: East Asia Market Value (US$ Million) by Application, 2023 to 2033
Figure 185: East Asia Market Value (US$ Million) by Country, 2023 to 2033
Figure 186: East Asia Market Value (US$ Million) Analysis by Country, 2018 to 2033
Figure 187: East Asia Market Volume (Tons) Analysis by Country, 2018 to 2033
Figure 188: East Asia Market Value Share (%) and BPS Analysis by Country, 2023 to 2033
Figure 189: East Asia Market Y-o-Y Growth (%) Projections by Country, 2023 to 2033
Figure 190: East Asia Market Value (US$ Million) Analysis by Form, 2018 to 2033
Figure 191: East Asia Market Volume (Tons) Analysis by Form, 2018 to 2033
Figure 192: East Asia Market Value Share (%) and BPS Analysis by Form, 2023 to 2033
Figure 193: East Asia Market Y-o-Y Growth (%) Projections by Form, 2023 to 2033
Figure 194: East Asia Market Value (US$ Million) Analysis by Source, 2018 to 2033
Figure 195: East Asia Market Volume (Tons) Analysis by Source, 2018 to 2033
Figure 196: East Asia Market Value Share (%) and BPS Analysis by Source, 2023 to 2033
Figure 197: East Asia Market Y-o-Y Growth (%) Projections by Source, 2023 to 2033
Figure 198: East Asia Market Value (US$ Million) Analysis by Type, 2018 to 2033
Figure 199: East Asia Market Volume (Tons) Analysis by Type, 2018 to 2033
Figure 200: East Asia Market Value Share (%) and BPS Analysis by Type, 2023 to 2033
Figure 201: East Asia Market Y-o-Y Growth (%) Projections by Type, 2023 to 2033
Figure 202: East Asia Market Value (US$ Million) Analysis by Application, 2018 to 2033
Figure 203: East Asia Market Volume (Tons) Analysis by Application, 2018 to 2033
Figure 204: East Asia Market Value Share (%) and BPS Analysis by Application, 2023 to 2033
Figure 205: East Asia Market Y-o-Y Growth (%) Projections by Application, 2023 to 2033
Figure 206: East Asia Market Attractiveness by Form, 2023 to 2033
Figure 207: East Asia Market Attractiveness by Source, 2023 to 2033
Figure 208: East Asia Market Attractiveness by Type, 2023 to 2033
Figure 209: East Asia Market Attractiveness by Application, 2023 to 2033
Figure 210: East Asia Market Attractiveness by Country, 2023 to 2033
Figure 211: Middle East and Africa Market Value (US$ Million) by Form, 2023 to 2033
Figure 212: Middle East and Africa Market Value (US$ Million) by Source, 2023 to 2033
Figure 213: Middle East and Africa Market Value (US$ Million) by Type, 2023 to 2033
Figure 214: Middle East and Africa Market Value (US$ Million) by Application, 2023 to 2033
Figure 215: Middle East and Africa Market Value (US$ Million) by Country, 2023 to 2033
Figure 216: Middle East and Africa Market Value (US$ Million) Analysis by Country, 2018 to 2033
Figure 217: Middle East and Africa Market Volume (Tons) Analysis by Country, 2018 to 2033
Figure 218: Middle East and Africa Market Value Share (%) and BPS Analysis by Country, 2023 to 2033
Figure 219: Middle East and Africa Market Y-o-Y Growth (%) Projections by Country, 2023 to 2033
Figure 220: Middle East and Africa Market Value (US$ Million) Analysis by Form, 2018 to 2033
Figure 221: Middle East and Africa Market Volume (Tons) Analysis by Form, 2018 to 2033
Figure 222: Middle East and Africa Market Value Share (%) and BPS Analysis by Form, 2023 to 2033
Figure 223: Middle East and Africa Market Y-o-Y Growth (%) Projections by Form, 2023 to 2033
Figure 224: Middle East and Africa Market Value (US$ Million) Analysis by Source, 2018 to 2033
Figure 225: Middle East and Africa Market Volume (Tons) Analysis by Source, 2018 to 2033
Figure 226: Middle East and Africa Market Value Share (%) and BPS Analysis by Source, 2023 to 2033
Figure 227: Middle East and Africa Market Y-o-Y Growth (%) Projections by Source, 2023 to 2033
Figure 228: Middle East and Africa Market Value (US$ Million) Analysis by Type, 2018 to 2033
Figure 229: Middle East and Africa Market Volume (Tons) Analysis by Type, 2018 to 2033
Figure 230: Middle East and Africa Market Value Share (%) and BPS Analysis by Type, 2023 to 2033
Figure 231: Middle East and Africa Market Y-o-Y Growth (%) Projections by Type, 2023 to 2033
Figure 232: Middle East and Africa Market Value (US$ Million) Analysis by Application, 2018 to 2033
Figure 233: Middle East and Africa Market Volume (Tons) Analysis by Application, 2018 to 2033
Figure 234: Middle East and Africa Market Value Share (%) and BPS Analysis by Application, 2023 to 2033
Figure 235: Middle East and Africa Market Y-o-Y Growth (%) Projections by Application, 2023 to 2033
Figure 236: Middle East and Africa Market Attractiveness by Form, 2023 to 2033
Figure 237: Middle East and Africa Market Attractiveness by Source, 2023 to 2033
Figure 238: Middle East and Africa Market Attractiveness by Type, 2023 to 2033
Figure 239: Middle East and Africa Market Attractiveness by Application, 2023 to 2033
Figure 240: Middle East and Africa Market Attractiveness by Country, 2023 to 2033
The global algal protein market is expected to grow at a CAGR of 9.2% during the forecast period from 2025 to 2035.
The market is projected to reach a value of USD 2,104.6 million by 2035.
The dietary supplements segment is anticipated to witness the fastest growth, driven by increasing consumer demand for plant-based and sustainable protein sources.
Key drivers include rising health consciousness, a shift towards plant-based diets, environmental sustainability concerns, and advancements in algae cultivation technologies.
Leading companies in the market include Corbion, Cyanotech Corporation, Roquette Frères, DIC Corporation, EID Parry, and TerraVia Holdings.
Explore Similar Insights
Thank you!
You will receive an email from our Business Development Manager. Please be sure to check your SPAM/JUNK folder too.