

- Market Size (2026)
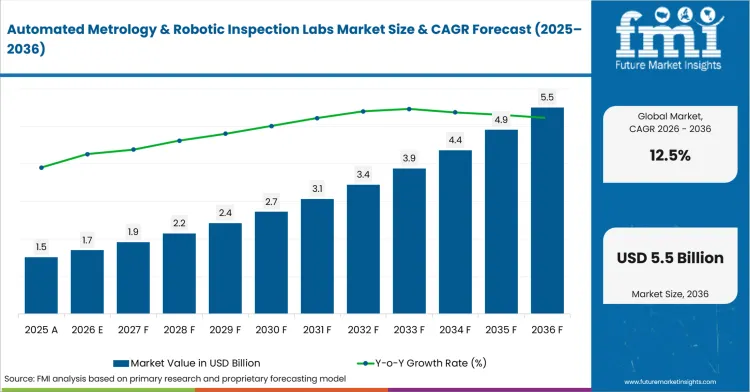
- USD 1.7 Bn
- Forecast (2036)
- USD 5.5 Bn
- CAGR (2026 to 2036)
- 12.5%
How big is Automated Metrology & Robotic Inspection Labs Market size?
USD 1.7 billion in 2026 and USD 5.5 billion by 2036 at a 12.5% CAGR.
Demand for automated metrology and robotic inspection labs stands at USD 1.7 billion in 2026 and rises to USD 5.5 billion by 2036, growing at a 12.5% CAGR. Growth is driven by manufacturers in aerospace, automotive, semiconductor, and precision-machining sectors replacing manual coordinate-measuring routines with robot-mounted metrology systems that can inspect parts inline without pulling production to a stop. As tolerances tighten and part complexity grows, engineering and quality teams need inspection cycles that keep pace with production line speed rather than trailing it, which makes throughput as central to the buying decision as measurement accuracy itself.
Integration cost, the skilled programming effort needed to adapt robotic inspection cells to new part geometries, and the capital outlay relative to traditional CMM equipment work against faster adoption, particularly for smaller manufacturers running mixed, low-volume production. A system that requires heavy reprogramming for every new part family loses much of its throughput advantage before it ever reaches the floor. The stronger opportunities lie in AI-assisted defect detection, inline inspection integrated directly into production cells rather than run offline, and software that lets robotic metrology systems adapt to new parts without a full reprogramming cycle. By component, technology, and end-use industry, integration complexity and accuracy requirements differ enough to warrant separate treatment later. Regionally, established manufacturing hubs with high-precision output, particularly in aerospace and semiconductor production, lead adoption, while emerging manufacturing regions are earlier in the shift from manual to automated inspection.
Key Takeaways of Automated Metrology & Robotic Inspection Labs Market
- Demand for automated metrology and robotic inspection labs is driven by the need for earlier dimensional evidence and repeatable unattended measurement, with robotic loading improving instrument utilization during recurring part verification.
- By component, hardware is expected to lead with 58.0% share in 2026, owing to scanners and CMMs alongside robots and fixtures.
- Direct is the dominant sales channel segment, projected to hold 50.0% share in 2026, reflecting complex application engineering and service requirements.
- Inline dimensional QC is estimated to lead the application category with 32.0% share in 2026, led by earlier process feedback.
- Connected records and calibration planning remain critical to adoption, supporting root-cause review across tools and fixtures while protecting measurement confidence during extended operating hours.
- China, the United States, and the European Union are expected to form the higher-growth country tier, advancing at 15.5%, 13.0%, and 12.0% CAGR respectively through 2036, supported by manufacturing automation, aerospace/automotive inspection programs, and traceability requirements.
- Competition centers on Hexagon Manufacturing Intelligence, ZEISS Industrial Quality Solutions, Renishaw, and Nikon Metrology, with vendors differentiating through CMM and scanning depth, tactile/X-ray inspection capability, and probing/non-contact measurement programs.
Analyst Perspective
"The automated metrology systems market is shifting from standalone inspection equipment toward an integral part of production capacity planning. Manufacturers are evaluating systems on measurement repeatability, inspection throughput, and their ability to accommodate multiple part families with minimal changeover disruption. Market adoption will increasingly depend on calibration support, lifecycle reliability, and the consistency of quality data across long-term manufacturing operations."
- Nikhil Kaitwade, Principal Consultant for Testing Equipment at Future Market Insights
Source: Future Market Insights analysis, 2026.
How is Automated Metrology & Robotic Inspection Labs Market segmented?
The automated metrology & robotic inspection labs market is segmented by technology, application, component, end-use industry, sales channel and region.
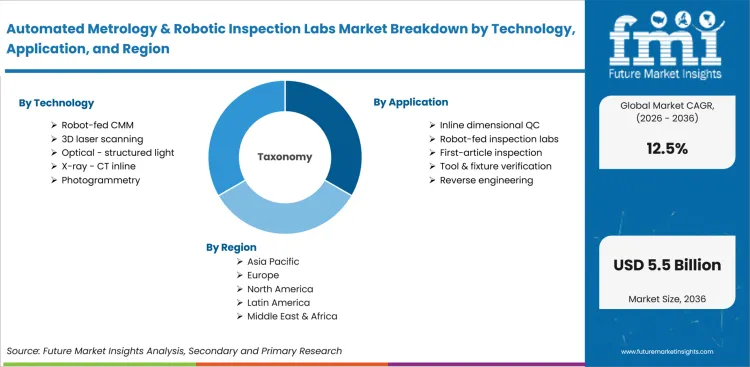
The automated metrology & robotic inspection labs sector is segmented by technology, application, component, end-use industry, sales channel and region. Technology coverage includes robot-fed CMM and robotic optical scanning alongside automated X-ray and CT inspection, laser radar inspection and multi-sensor metrology cells. Application coverage includes inline dimensional QC and robot-fed inspection labs alongside first-article inspection, tool and fixture verification and reverse engineering. Component coverage includes hardware and software alongside services. End-use Industry coverage includes automotive and aerospace alongside machinery, electronics and medical manufacturing. Sales Channel coverage includes direct and system integrators alongside distributors and aftermarket support. Regional coverage includes North America and Latin America. Coverage includes Western Europe and Eastern Europe alongside East Asia, South Asia and Pacific, Middle East and Africa.
How does Robot-fed CMM shape technology selection?
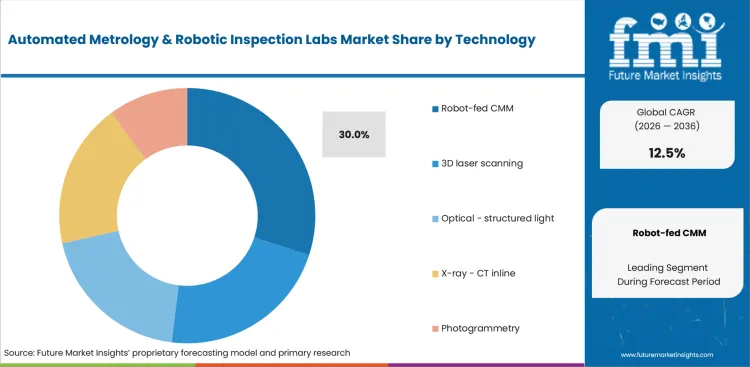
Robot-fed CMM shapes technology selection by pairing established inspection methods with controlled part presentation. Engineering teams assess fixture access and collision protection with program stability during cell design. Hexagon reported in May 2025 that MAESTRO delivers sub-micron tolerances through a newly developed measurement architecture, reflecting automated CMM programs requiring repeatable dimensional evidence.
- By technology, robot-fed CMM is expected to hold 30.0% share in 2026 due to familiar measurement routines and unattended loading across recurring part families.
- Robotic optical scanning and automated X-ray inspection address surface or internal features. Robot-fed CMM retains selection strength led by traceable tactile programs and installed metrology knowledge.
How does Inline dimensional QC shape application demand?
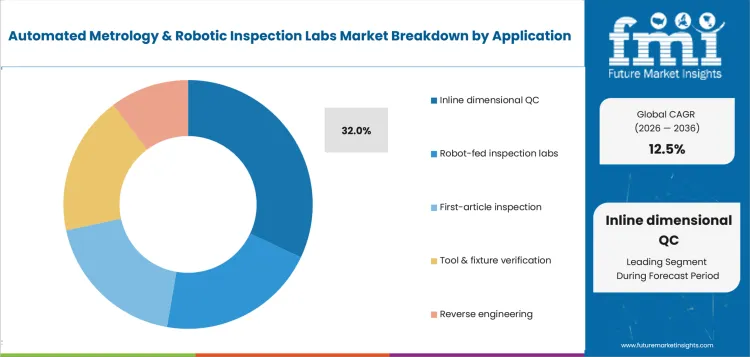
Hexagon reported in May 2025 that PRESTO Quality Stations scan at 8.3 million points per second, strengthening near-line inspection programs needing rapid geometry capture. Inline dimensional QC helps application need as production teams seek evidence before drift affects larger batches. Plant engineers compare response speed and environmental protection alongside traceability during application reviews.
- In 2026, Inline dimensional QC is projected to represent 32.0% share in 2026 since it is guided by earlier feedback across automated production lines and machining cells.
- Robot-fed inspection labs and first-article inspection support-controlled confirmation outside line conditions. Inline dimensional QC keeps attention driven by shorter correction intervals and clearer part identity.
Why does Hardware lead component demand?
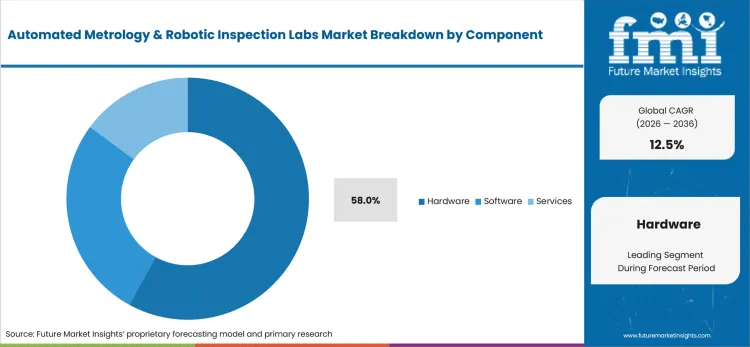
Hardware maintains component prominence led by its role across measurement platforms and robotic systems. Software and services contribute value due to program governance and calibration support across installed cells. Nikon Metrology announced in May 2026 stating NEXIV VMF-K6561 provides full 600 mm panel coverage, illustrating hardware investment required for larger electronic assemblies and precision components.
- Hardware is anticipated to secure 58.0% share in 2026, driven by physical sensing and motion assets needed for automated inspection operations.
- Software manages programs and reporting. Services support commissioning and calibration. Hardware retains share strength based on equipment intensity and guarded-cell requirements.
Why does Automotive lead end-use demand?
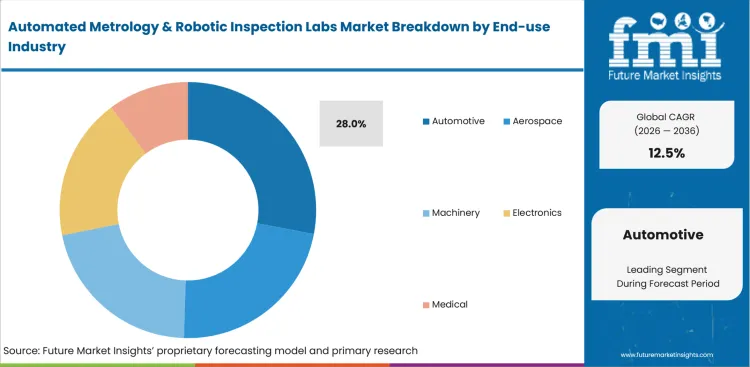
ACEA reported in March 2025 stating global car manufacturing reached 75.5 million units during 2024, sustaining recurring inspection needs across body structures and powertrain components. Automotive leads end-use requirements as high production volumes make early dimensional feedback commercially valuable. Platform changes and larger castings increase attention on flexible measurement cells and controlled changeovers.
- Automotive is likely to garner 28.0% share of end-use in 2026, backed by recurring production checks and high-volume component programs across vehicle plants.
- Aerospace and medical programs require deeper records. Machinery and electronics use varied inspection methods. Automotive remains prominent depending on production scale and repeated part verification.
How does Direct retain sales channel strength?
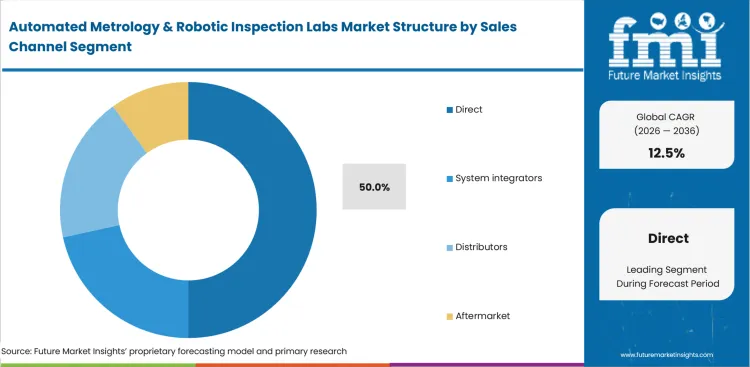
ZEISS Group reported for fiscal 2024/25 listing 46,622 employees in September 2025, supporting application and service access across complex industrial inspection programs. Direct is expected to retain sales channel strength as automated cells require detailed application engineering and continuing calibration support. Manufacturers value clear responsibility for system performance across hardware and software components.
- Based on sales channel, direct is ready to capture 50.0% share in 2026 owing to complex specifications and manufacturer-led commissioning across automated metrology projects.
- System integrators combine robots and fixtures. Distributors support standardized equipment. Direct channels retain strength fueled by specialist engineering and long-term service ownership.
What are drivers, restraints, and opportunities in Automated Metrology & Robotic Inspection Labs Market?
Inspection investment progresses due to shorter quality feedback and repeatable unattended measurement. Integration complexity and specialist shortages may delay commissioning.
- Driver: Manufacturing teams seek dimensional evidence closer to production to reduce scrap and corrective-action delays.
- Restraint: Complex coordinates and fixture design may raise engineering effort across multi-device inspection cells.
- Opportunity: Simulation-based validation may improve reach studies and program preparation during automated cell planning.
Factory automation and rising measurement frequency across recurring production support broader market expansion. International Federation of Robotics reported in September 2025 stating 542,000 industrial robots were installed during 2024, expanding the installed automation base requiring dependable dimensional verification.
United States Bureau of Labor Statistics reported in August 2025 projecting 1,400 annual openings for calibration technologists and technicians between 2024 and 2034, highlighting specialist staffing pressure across automated inspection programs. Limited skills availability and unclear program ownership across metrology and robotics disciplines constrain implementation.
United States Department of Commerce reported in November 2024 announcing up to USD 300 million across advanced packaging research projects, supporting inspection methods for high-density panels and fine-pitch assemblies. Virtual validation and connected inspection planning create further scope within automated measurement workflows.
What country or market CAGRs are profiled in Automated Metrology & Robotic Inspection Labs Market?
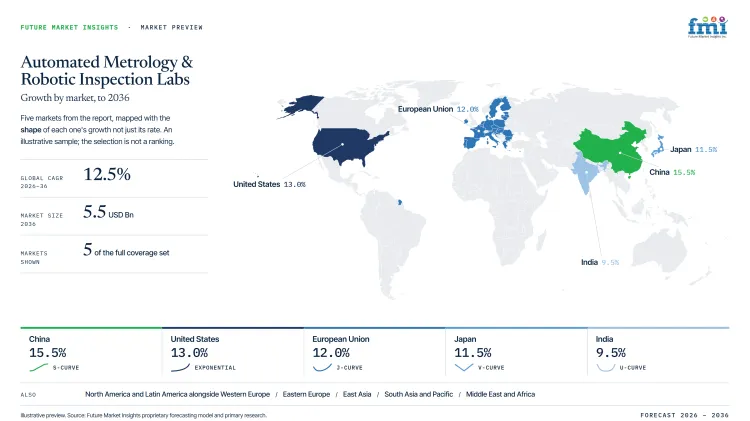
| Country or Market | CAGR |
|---|---|
| China | 15.5% |
| United States | 13.0% |
| European Union | 12.0% |
| Japan | 11.5% |
| India | 9.5% |
Source: Future Market Insights analysis, 2026.
How do country-level CAGRs compare in the Automated Metrology & Robotic Inspection Labs Market?
The comparison spans 6.0 percentage points across the automated metrology & robotic inspection labs market. China records the highest CAGR at 15.5%, followed by the United States at 13.0%. The European Union reaches 12.0%, while Japan and India post 11.5% and 9.5%, respectively. The ranking reflects different rates of investment in automated inspection, precision measurement and laboratory automation technologies.
- China leads with a CAGR of 15.5%. Manufacturers are expanding automated metrology and robotic inspection capabilities to improve dimensional measurement, quality verification and inspection throughput across production and testing facilities.
- The United States follows at 13.0%, 2.5 percentage points below China. Industrial laboratories and manufacturing facilities continue integrating robotic inspection systems with automated measurement equipment to improve inspection consistency, reduce manual intervention and increase testing efficiency.
- The European Union records a CAGR of 12.0%, 1.0 percentage point behind the United States. Investment is directed toward precision metrology and robotic inspection systems that strengthen quality assurance across manufacturing operations. Adoption differs among member states because industrial specialization, automation priorities and capital investment vary across the region.
- Japan posts a CAGR of 11.5%, 0.5 percentage points below the European Union. Manufacturers continue incorporating automated inspection technologies into metrology laboratories to improve measurement accuracy, repeatability and process control.
- India records a CAGR of 9.5%, 2.0 percentage points behind Japan. Industrial facilities are evaluating automated metrology and robotic inspection solutions as production quality requirements become more stringent across manufacturing sectors.
Comparable CAGRs do not indicate identical market conditions. Differences in manufacturing automation, quality assurance practices, industrial investment and laboratory modernization priorities influence deployment decisions and long-term commercial opportunities. The full report provides country-level CAGR analysis across North America, Latin America, Europe, East Asia, South Asia, Oceania and the Middle East and Africa.
Country-wise Analysis
- Industry in China is projected to progress at 15.5% CAGR during the forecast period, driven by automated electronics and vehicle production requiring frequent dimensional checks. Large production networks create recurring measurement workloads suited to robot-fed cells and connected quality systems. National Bureau of Statistics of China reported in January 2026 stating industrial robot output reached 773,074 units during 2025, reinforcing domestic capacity for automated inspection integration.
- International Federation of Robotics reported in June 2026 stating United States industrial robot installations reached 38,000 units during 2025, supporting inspection demand across automated plants. Such installation depth expands the number of facilities requiring dependable dimensional verification during recurring production. Manufacturing depth and established application teams support an estimated 13.0% CAGR from 2026 to 2036 for the sector in United States.
- Adoption in the European Union is predicted to rise at 12.0% CAGR during the study period, backed by precision manufacturing and enterprise automation support. Enterprise use of connected manufacturing tools encourages quality teams to integrate measurement records with production systems. Eurostat reported in December 2025 stating 20.0% of European Union enterprises used artificial intelligence during 2025, indicating wider factory investment in connected production and quality systems.
- Japan Automobile Manufacturers Association reported in September 2025 stating motor vehicle production reached 8.23 million units during 2024, sustaining detailed inspection workloads across vehicle supply networks. High vehicle output creates repeated dimensional checks across components and assembly processes. The market in Japan is set to scale at 11.5% CAGR between 2026 and 2036, aided by Compact cell design and established quality practice.
- India is likely to expand at 9.5% CAGR through 2036 as new industrial capacity raises interest in flexible measurement systems and local service. Expanding vehicle production increases inspection workloads and supports flexible systems suited to varied plant requirements. Society of Indian Automobile Manufacturers reported in April 2025 stating passenger vehicle sales reached 4.3 million units during fiscal 2024-25, reflecting inspection-system review across expanding automotive production programs.
Who are notable companies in Automated Metrology & Robotic Inspection Labs Market?
Hexagon Manufacturing Intelligence and ZEISS Industrial Quality Solutions shape market direction through coordinate measurement and automated inspection systems.
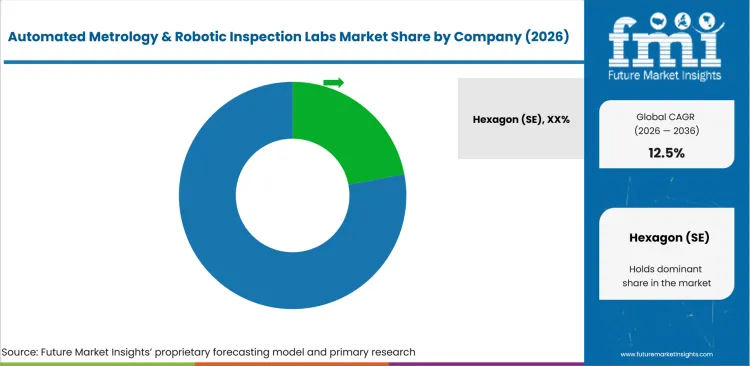
Renishaw and Nikon Metrology add probing and X-ray inspection depth. Mitutoyo Corporation and Creaform support dimensional metrology and portable 3D metrology applications. WENZEL Group and Metrologic Group extend coverage across inspection equipment and measurement software.
Competition in automated metrology & robotic inspection labs reflects how effectively suppliers connect measurement systems with robotic handling and production software. Account teams review application engineering during cell design and commissioning to confirm smooth operation across different part families. Final selection favors vendors providing dependable calibration support and clear service responsibility throughout the equipment lifecycle.
- Hexagon Manufacturing Intelligence competes based on CMM and scanning depth combined with connected quality software. Manufacturing relationships support programs requiring coordinated measurement equipment and reporting systems.
- ZEISS Industrial Quality Solutions competes driven by coordinate measurement and industrial X-ray inspection. Application engineering supports programs covering external dimensions and internal component structures.
- Renishaw strengthens vendor reviews due to probing and process-control applications linked with machining operations. Nikon Metrology adds laser radar and X-ray systems for non-contact and internal inspection requirements.
- Mitutoyo Corporation and Creaform support account evaluation depending on dimensional metrology and portable scanning portfolios. WENZEL Group and Metrologic Group add inspection-system and software capabilities across automated laboratory programs.
Competitive Benchmarking: Automated Metrology & Robotic Inspection Labs Market
| Company | Portfolio Depth | Inspection Match | Service Support | Service Reach |
|---|---|---|---|---|
| Hexagon Manufacturing Intelligence | High | High | High | Sweden and global |
| ZEISS Industrial Quality Solutions | High | High | High | Germany and global |
| Renishaw plc | High | High | High | United Kingdom and global |
| Nikon Industrial Metrology | High | High | High | Japan and global |
| Mitutoyo Corporation | High | High | High | Japan and global |
| Creaform | Medium | High | Medium | Canada and global |
| WENZEL Group | Medium | High | Medium | Germany and global |
| Metrologic DCS | High | High | High | France and global |
| LK Metrology | Medium | High | Medium | United Kingdom and global |
| Automated Precision, Inc. | High | Medium | High | United States and global |
Source: Future Market Insights competitive analysis, 2026.
Key Developments in Automated Metrology & Robotic Inspection Labs Market
- In June 2025, Hexagon announced its Autonomous Metrology Suite with programming reduced from days to hours, helping manufacturers prepare repeatable CMM routines with less specialist effort and shorter setup intervals.
- In July 2025, ZEISS introduced OMNIA GC 220-180 with a 2,200 x 1,800 x 900 mm inspection volume, extending automated X-ray evaluation toward large cast components and high-throughput production checks.
- In April 2026, Nikon Industrial Metrology launched APDIS MV5X with scanning up to six times faster than preceding models and weight below 12 kg, supporting portable or robot-mounted inspection across production areas.
Key Players in Automated Metrology & Robotic Inspection Labs Market
Measurement platform and inspection system leaders
- Hexagon Manufacturing Intelligence
- ZEISS Industrial Quality Solutions
- Nikon Industrial Metrology
- Mitutoyo Corporation
Metrology sensor and scanning specialists
- Renishaw plc
- Creaform
- LK Metrology
- Automated Precision, Inc.
Automated metrology systems and software specialists
- WENZEL Group
Automated Metrology & Robotic Inspection Labs Market - Report Scope
| Coverage field | Report scope |
|---|---|
| Market breakdown | Automated Metrology & Robotic Inspection Labs Market breakdown by technology alongside application, component, end-use industry, sales channel and region |
| Market Definition | Automated metrology and robotic inspection labs include robot-fed CMM, robotic optical scanning, automated X-ray and CT inspection, laser radar inspection and multi-sensor metrology cells used for inline dimensional QC, robot-fed inspection, first-article checks, tool and fixture verification and reverse engineering. |
| Regions Covered | North America and Latin America alongside Western Europe, Eastern Europe, East Asia, South Asia and Pacific, Middle East and Africa |
| Countries Covered | United States and China alongside European Union, Japan, India, Canada, Brazil, Mexico, Germany, United Kingdom, France, Italy, Spain, Poland, Czech Republic, Romania, South Korea, ASEAN, Australia, New Zealand, GCC countries, South Africa and Türkiye |
| Key Companies Profiled | Hexagon Manufacturing Intelligence and ZEISS Industrial Quality Solutions alongside Renishaw plc, Nikon Industrial Metrology, Mitutoyo Corporation, Creaform, WENZEL Group, Metrologic DCS, LK Metrology and Automated Precision, Inc. |
| Forecast Period | 2026 to 2036 |
| Approach | Hybrid bottom-up and top-down methodology using segment share, country CAGR, installed automation depth, inspection workloads, company portfolio coverage and service reach |
Source: Future Market Insights analysis, 2026.
Automated Metrology & Robotic Inspection Labs Market - Research Methodology
| Method | Approach |
|---|---|
| Primary Research | FMI analysts gathered input from manufacturers, service providers, technology developers, distributors, end users, procurement teams, and subject-matter experts. Interviews examined purchasing decisions, product or service evaluation, adoption barriers, approval requirements, pricing considerations, and expectations for technical or commercial support. Respondents were also asked what evidence is required before a trial, pilot, or initial order develops into regular purchasing. |
| Desk Research | Desk research covered government statistics, regulatory publications, trade data, industry associations, technical literature, standards, company filings, product information, and official corporate announcements. Sources were reviewed for relevance, publication date, geographic coverage, and consistency with the defined market scope. Claims relating to performance, applications, approvals, capacity, investment, and commercial activity were retained only when supported by credible public evidence. |
| Market Sizing and Forecasting | The market model combined the baseline value with historical performance, segment structure, pricing and volume indicators, adoption levels, company participation, and country-level demand conditions. Forecast assumptions considered economic activity, investment trends, regulatory developments, technology adoption, purchasing cycles, supply availability, and barriers to wider market use. Segment and regional estimates were reconciled before the final market total was calculated. |
| Data Validation | Estimates were checked against multiple independent indicators, including public data, company activity, trade patterns, industry developments, and findings from primary interviews. Validation also tested whether products, services, applications, and company revenues fell within the defined market boundaries. Adjacent categories, unsupported claims, overlapping revenues, and activities without direct market relevance were excluded to reduce double counting and maintain consistency across segments and countries. |
Source: Future Market Insights analysis, 2026.
Automated Metrology & Robotic Inspection Labs Market by Segments
Automated Metrology & Robotic Inspection Labs Market segmented by Technology:
- Robot-fed CMM
- Robotic optical scanning
- Automated X-ray and CT inspection
- Laser radar inspection
- Multi-sensor metrology cells
Automated Metrology & Robotic Inspection Labs Market segmented by Application:
- Inline dimensional QC
- Robot-fed inspection labs
- First-article inspection
- Tool and fixture verification
- Reverse engineering
Automated Metrology & Robotic Inspection Labs Market segmented by Component:
- Hardware
- Software
- Services
Automated Metrology & Robotic Inspection Labs Market segmented by End-use Industry:
- Automotive
- Aerospace
- Machinery
- Electronics
- Medical
Automated Metrology & Robotic Inspection Labs Market segmented by Sales Channel:
- Direct
- System integrators
- Distributors
- Aftermarket
Automated Metrology & Robotic Inspection Labs Market by Region:
- North America
- United States
- Canada
- Latin America
- Brazil
- Mexico
- Argentina
- Western Europe
- Germany
- United Kingdom
- France
- Italy
- Spain
- Eastern Europe
- Poland
- Czech Republic
- Romania
- East Asia
- China
- Japan
- South Korea
- South Asia and Pacific
- India
- ASEAN
- Australia and New Zealand
- Middle East and Africa
- GCC countries
- South Africa
- Türkiye
Research Sources and Bibliography
- ACEA. (2025, March 13). Economic and market report: Global and EU auto industry, full year 2024.
- USA Bureau of Labor Statistics. (2025, August 28). Calibration technologists and technicians. Occupational Outlook Handbook.
- Eurostat. (2025, December 11). 20% of EU enterprises use AI technologies.
- Hexagon. (2025, May 6). Hexagon launches MAESTRO, the next-generation coordinate measuring machine.
- Hexagon. (2025, May 8). Hexagon brings automated quality inspection to smaller manufacturing operations and large-scale applications with new PRESTO Quality Stations.
- Hexagon. (2025, June 16). Hexagon unveils Autonomous Metrology Suite to deliver manufacturing quality at speed.
- International Federation of Robotics. (2025, September 25). World Robotics 2025 report: Industrial robots.
- International Federation of Robotics. (2026, June 18). USA robot industry returns to double-digit growth.
- International Organization of Motor Vehicle Manufacturers. (2026, April 23). Auto industry growth shifted east in 2025 amid global repositioning.
- Japan Automobile Manufacturers Association. (2025, September 26). The motor industry of Japan 2025.
- National Bureau of Statistics of China. (2026, January 20). Industrial production operation in December 2025.
- National Institute of Standards and Technology. (2025, August 18). NIST awards over USD 1.8 million to small businesses advancing AI, semiconductors, additive manufacturing and more.
- Nikon Corporation. (2026, April 20). Nikon’s APDIS MV5X Laser Radar sets a new standard for compact, high-speed precision measurement.
- Nikon Corporation. (2026, May 13). Nikon NEXIV VMF-K6561 achieves full 600 mm panel coverage.
- Society of Indian Automobile Manufacturers. (2025, April 15). Auto industry sales performance of March 2025, Q4 January-March 2025, and April 2024-March 2025.
- United States Department of Commerce. (2024, November 21). CHIPS for America announces up to USD 300 million in funding to boost USA semiconductor packaging.
- ZEISS Group. (2025). Annual report 2024/25: Key figures.
- ZEISS Industrial Quality Solutions. (2025, July 3). ZEISS presents OMNIA GC 220-180: Large-scale automated X-ray inspection.
This bibliography is provided for reader reference and is not exhaustive. The full report contains the complete reference list and detailed citations.
This Report Answers
- What segments shape automated metrology & robotic inspection labs across technology and application alongside component, end-use industry and sales channel?
- How do robot-fed CMM systems influence automated inspection planning?
- How does inline dimensional QC support earlier production correction?
- Why does hardware represent the leading component share?
- How do country CAGRs differ across profiled manufacturing economies?
- What companies compete through measurement breadth and automation support?
- How are forecasts validated through a hybrid bottom-up and top-down approach?
- What factors affect integration schedules across robot and sensor systems?
- What limits return on investment for manufacturers adding automated inspection cells?
- What vendor capabilities improve long-term measurement confidence?
Frequently Asked Questions
What supports automated metrology & robotic inspection labs market?
Automated metrology & robotic inspection labs are likely to receive support from factories needing earlier dimensional evidence and greater instrument use. Account reviews are expected to favor repeatable loading and clear service ownership.
Who are key players in automated metrology & robotic inspection labs market?
Key companies are anticipated to include Hexagon Manufacturing Intelligence, ZEISS Industrial Quality Solutions, Renishaw, and Nikon Industrial Metrology. Competition is likely to focus on measurement breadth and application support.
What restraint affects automated metrology & robotic inspection labs market?
A major restraint arises from coordinate alignment and fixture engineering across cells combining robots and precision sensors. Project schedules may extend if programming ownership or calibration responsibility remains unclear.
Why do executives track automated metrology & robotic inspection labs market?
Executives are expected to track automated inspection as dimensional feedback influences scrap and production-release timing. Capital planning also connects measurement equipment with software governance and long-term service capacity.
What business problem does automated metrology address?
Automated metrology addresses inspection queues that separate production from dimensional confirmation across recurring parts and multiple shifts. Manufacturers need repeatable evidence supporting correction and customer review without continuous manual loading.
What do account teams evaluate before selecting vendors?
Account teams are likely to evaluate uncertainty and cycle time alongside fixturing responsibility and software compatibility. Calibration access and robot safety evidence are expected to guide final vendor review.
What limits return on investment for purchasing teams?
Return on investment weakens if part flow or measurement programs are not prepared for automation. Low instrument use and expanded integration work reduce expected operating gains.
How do vendors build long-term account confidence?
Vendors build confidence through repeatable measurement evidence and responsive calibration support across the installed system. Clear upgrade ownership and program governance are expected to influence repeat-order trust.
Preview the report firsthand - request a free sample
Get SampleGet the brochure for pricing and purchase details.
Get PDFTable of Content
- Key Takeaways
- Market Size and CAGR
- Top Growth Driver
- Fastest Growing Segment
- Leading Region
- Key Companies
- Emerging Opportunities
- Executive Summary
- Global Market Outlook
- Demand-side Trends
- Supply-side Trends
- Technology Roadmap Analysis
- Analysis and Recommendations
- Analyst Perspective (What is happening? Why now? What should investors know?)
- Key Questions Answered
- How large is the market?
- What is the CAGR?
- What are key trends?
- Which region dominates?
- Who are the leaders?
- Market Overview
- Market Coverage / Taxonomy
- Market Definition / Scope / Limitations
- Research Methodology
- Chapter Orientation
- Analytical Lens and Working Hypotheses
- Market Structure, Signals, and Trend Drivers
- Benchmarking and Cross-market Comparability
- Market Sizing, Forecasting, and Opportunity Mapping
- Research Design and Evidence Framework
- Desk Research Programme (Secondary Evidence)
- Expert Input and Fieldwork (Primary Evidence)
- Tooling, Models, and Reference Databases
- Data Engineering and Model Build
- Quality Assurance and Audit Trail
- Market Background
- Market Dynamics (Drivers, Restraints, Opportunity, Trends)
- Scenario Forecast (Optimistic, Likely, Conservative)
- Impact Analysis
- AI Impact
- Sustainability Impact
- Regulatory Impact
- Technology Impact
- Consumer / Buyer Analysis
- Purchase Drivers
- Adoption Barriers
- Buyer Journey
- Opportunity Map Analysis
- Product Life Cycle Analysis
- Supply Chain Analysis
- Investment Feasibility Matrix
- Value Chain Analysis
- PESTLE and Porter's Analysis
- Regulatory Landscape
- Regional Parent Market Outlook
- Production and Consumption Statistics
- Import and Export Statistics
- Global Market Analysis and Forecast, 2021 to 2036
- Historical Market Size Value (USD Bn) Analysis, 2021 to 2025
- Current and Future Market Size Value (USD Bn) Projections, 2026 to 2036
- Y-o-Y Growth Trend Analysis
- Absolute $ Opportunity Analysis
- Global Market Pricing Analysis, 2021 to 2036
- Global Market Analysis and Forecast, By Technology, 2021 to 2036
- Introduction / Key Findings
- Historical Market Size Value (USD Bn) Analysis By Technology, 2021 to 2025
- Current and Future Market Size Value (USD Bn) Analysis and Forecast By Technology, 2026 to 2036
- Robot-fed CMM
- 3D laser scanning
- Optical - structured light
- X-ray - CT inline
- Photogrammetry
- Robot-fed CMM
- Y-o-Y Growth Trend Analysis By Technology, 2021 to 2025
- Absolute $ Opportunity Analysis By Technology, 2026 to 2036
- Global Market Analysis and Forecast, By Application, 2021 to 2036
- Introduction / Key Findings
- Historical Market Size Value (USD Bn) Analysis By Application, 2021 to 2025
- Current and Future Market Size Value (USD Bn) Analysis and Forecast By Application, 2026 to 2036
- Inline dimensional QC
- Robot-fed inspection labs
- First-article inspection
- Tool & fixture verification
- Reverse engineering
- Inline dimensional QC
- Y-o-Y Growth Trend Analysis By Application, 2021 to 2025
- Absolute $ Opportunity Analysis By Application, 2026 to 2036
- Global Market Analysis and Forecast, By Component, 2021 to 2036
- Introduction / Key Findings
- Historical Market Size Value (USD Bn) Analysis By Component, 2021 to 2025
- Current and Future Market Size Value (USD Bn) Analysis and Forecast By Component, 2026 to 2036
- Hardware
- Software
- Services
- Hardware
- Y-o-Y Growth Trend Analysis By Component, 2021 to 2025
- Absolute $ Opportunity Analysis By Component, 2026 to 2036
- Global Market Analysis and Forecast, By End-use Industry, 2021 to 2036
- Introduction / Key Findings
- Historical Market Size Value (USD Bn) Analysis By End-use Industry, 2021 to 2025
- Current and Future Market Size Value (USD Bn) Analysis and Forecast By End-use Industry, 2026 to 2036
- Automotive
- Aerospace
- Machinery
- Electronics
- Medical
- Automotive
- Y-o-Y Growth Trend Analysis By End-use Industry, 2021 to 2025
- Absolute $ Opportunity Analysis By End-use Industry, 2026 to 2036
- Global Market Analysis and Forecast, By Sales Channel, 2021 to 2036
- Introduction / Key Findings
- Historical Market Size Value (USD Bn) Analysis By Sales Channel, 2021 to 2025
- Current and Future Market Size Value (USD Bn) Analysis and Forecast By Sales Channel, 2026 to 2036
- Direct
- System integrators
- Distributors
- Aftermarket
- Direct
- Y-o-Y Growth Trend Analysis By Sales Channel, 2021 to 2025
- Absolute $ Opportunity Analysis By Sales Channel, 2026 to 2036
- Global Market Analysis and Forecast, By Region, 2021 to 2036
- Introduction
- Historical Market Size Value (USD Bn) Analysis By Region, 2021 to 2025
- Current Market Size Value (USD Bn) Analysis and Forecast By Region, 2026 to 2036
- North America
- Latin America
- Western Europe
- Eastern Europe
- East Asia
- South Asia and Pacific
- Middle East & Africa
- Market Attractiveness Analysis By Region
- North America Market Analysis and Forecast, By Country, 2021 to 2036
- Historical Market Size Value (USD Bn) Trend Analysis By Market Taxonomy, 2021 to 2025
- Market Size Value (USD Bn) Forecast By Market Taxonomy, 2026 to 2036
- By Country
- USA
- Canada
- By Technology
- By Application
- By Component
- By End-use Industry
- By Sales Channel
- By Country
- Market Attractiveness Analysis
- By Country
- By Technology
- By Application
- By Component
- By End-use Industry
- By Sales Channel
- Key Takeaways
- Latin America Market Analysis and Forecast, By Country
- Historical Market Size Value (USD Bn) Trend Analysis By Market Taxonomy, 2021 to 2025
- Market Size Value (USD Bn) Forecast By Market Taxonomy, 2026 to 2036
- By Country
- Brazil
- Mexico
- Chile
- Rest of Latin America
- By Technology
- By Application
- By Component
- By End-use Industry
- By Sales Channel
- By Country
- Market Attractiveness Analysis
- By Country
- By Technology
- By Application
- By Component
- By End-use Industry
- By Sales Channel
- Key Takeaways
- Western Europe Market Analysis and Forecast, By Country
- Historical Market Size Value (USD Bn) Trend Analysis By Market Taxonomy, 2021 to 2025
- Market Size Value (USD Bn) Forecast By Market Taxonomy, 2026 to 2036
- By Country
- Germany
- UK
- Italy
- Spain
- France
- Nordic
- BENELUX
- Rest of Western Europe
- By Technology
- By Application
- By Component
- By End-use Industry
- By Sales Channel
- By Country
- Market Attractiveness Analysis
- By Country
- By Technology
- By Application
- By Component
- By End-use Industry
- By Sales Channel
- Key Takeaways
- Eastern Europe Market Analysis and Forecast, By Country
- Historical Market Size Value (USD Bn) Trend Analysis By Market Taxonomy, 2021 to 2025
- Market Size Value (USD Bn) Forecast By Market Taxonomy, 2026 to 2036
- By Country
- Russia
- Poland
- Hungary
- Balkan & Baltic
- Rest of Eastern Europe
- By Technology
- By Application
- By Component
- By End-use Industry
- By Sales Channel
- By Country
- Market Attractiveness Analysis
- By Country
- By Technology
- By Application
- By Component
- By End-use Industry
- By Sales Channel
- Key Takeaways
- East Asia Market Analysis and Forecast, By Country
- Historical Market Size Value (USD Bn) Trend Analysis By Market Taxonomy, 2021 to 2025
- Market Size Value (USD Bn) Forecast By Market Taxonomy, 2026 to 2036
- By Country
- China
- Japan
- South Korea
- By Technology
- By Application
- By Component
- By End-use Industry
- By Sales Channel
- By Country
- Market Attractiveness Analysis
- By Country
- By Technology
- By Application
- By Component
- By End-use Industry
- By Sales Channel
- Key Takeaways
- South Asia and Pacific Market Analysis and Forecast, By Country
- Historical Market Size Value (USD Bn) Trend Analysis By Market Taxonomy, 2021 to 2025
- Market Size Value (USD Bn) Forecast By Market Taxonomy, 2026 to 2036
- By Country
- India
- ASEAN
- Australia & New Zealand
- Rest of South Asia and Pacific
- By Technology
- By Application
- By Component
- By End-use Industry
- By Sales Channel
- By Country
- Market Attractiveness Analysis
- By Country
- By Technology
- By Application
- By Component
- By End-use Industry
- By Sales Channel
- Key Takeaways
- Middle East & Africa Market Analysis and Forecast, By Country
- Historical Market Size Value (USD Bn) Trend Analysis By Market Taxonomy, 2021 to 2025
- Market Size Value (USD Bn) Forecast By Market Taxonomy, 2026 to 2036
- By Country
- Kingdom of Saudi Arabia
- Other GCC Countries
- Türkiye
- South Africa
- Other African Union
- Rest of Middle East & Africa
- By Technology
- By Application
- By Component
- By End-use Industry
- By Sales Channel
- By Country
- Market Attractiveness Analysis
- By Country
- By Technology
- By Application
- By Component
- By End-use Industry
- By Sales Channel
- Key Takeaways
- Key Countries Market Analysis
- USA
- Pricing Analysis
- Market Share Analysis, 2025
- By Technology
- By Application
- By Component
- By End-use Industry
- By Sales Channel
- Canada
- Pricing Analysis
- Market Share Analysis, 2025
- By Technology
- By Application
- By Component
- By End-use Industry
- By Sales Channel
- Mexico
- Pricing Analysis
- Market Share Analysis, 2025
- By Technology
- By Application
- By Component
- By End-use Industry
- By Sales Channel
- Brazil
- Pricing Analysis
- Market Share Analysis, 2025
- By Technology
- By Application
- By Component
- By End-use Industry
- By Sales Channel
- Chile
- Pricing Analysis
- Market Share Analysis, 2025
- By Technology
- By Application
- By Component
- By End-use Industry
- By Sales Channel
- Germany
- Pricing Analysis
- Market Share Analysis, 2025
- By Technology
- By Application
- By Component
- By End-use Industry
- By Sales Channel
- UK
- Pricing Analysis
- Market Share Analysis, 2025
- By Technology
- By Application
- By Component
- By End-use Industry
- By Sales Channel
- Italy
- Pricing Analysis
- Market Share Analysis, 2025
- By Technology
- By Application
- By Component
- By End-use Industry
- By Sales Channel
- Spain
- Pricing Analysis
- Market Share Analysis, 2025
- By Technology
- By Application
- By Component
- By End-use Industry
- By Sales Channel
- France
- Pricing Analysis
- Market Share Analysis, 2025
- By Technology
- By Application
- By Component
- By End-use Industry
- By Sales Channel
- India
- Pricing Analysis
- Market Share Analysis, 2025
- By Technology
- By Application
- By Component
- By End-use Industry
- By Sales Channel
- ASEAN
- Pricing Analysis
- Market Share Analysis, 2025
- By Technology
- By Application
- By Component
- By End-use Industry
- By Sales Channel
- Australia & New Zealand
- Pricing Analysis
- Market Share Analysis, 2025
- By Technology
- By Application
- By Component
- By End-use Industry
- By Sales Channel
- China
- Pricing Analysis
- Market Share Analysis, 2025
- By Technology
- By Application
- By Component
- By End-use Industry
- By Sales Channel
- Japan
- Pricing Analysis
- Market Share Analysis, 2025
- By Technology
- By Application
- By Component
- By End-use Industry
- By Sales Channel
- South Korea
- Pricing Analysis
- Market Share Analysis, 2025
- By Technology
- By Application
- By Component
- By End-use Industry
- By Sales Channel
- Russia
- Pricing Analysis
- Market Share Analysis, 2025
- By Technology
- By Application
- By Component
- By End-use Industry
- By Sales Channel
- Poland
- Pricing Analysis
- Market Share Analysis, 2025
- By Technology
- By Application
- By Component
- By End-use Industry
- By Sales Channel
- Hungary
- Pricing Analysis
- Market Share Analysis, 2025
- By Technology
- By Application
- By Component
- By End-use Industry
- By Sales Channel
- Kingdom of Saudi Arabia
- Pricing Analysis
- Market Share Analysis, 2025
- By Technology
- By Application
- By Component
- By End-use Industry
- By Sales Channel
- Türkiye
- Pricing Analysis
- Market Share Analysis, 2025
- By Technology
- By Application
- By Component
- By End-use Industry
- By Sales Channel
- South Africa
- Pricing Analysis
- Market Share Analysis, 2025
- By Technology
- By Application
- By Component
- By End-use Industry
- By Sales Channel
- USA
- Market Structure Analysis
- Competition Dashboard
- Competition Benchmarking
- Market Share Analysis of Top Players
- By Regional
- By Technology
- By Application
- By Component
- By End-use Industry
- By Sales Channel
- Emerging Startups
- Innovation Benchmarking
- Competition Analysis
- Competition Deep Dive
- Hexagon (SE)
- Overview
- Product Portfolio
- Profitability by Market Segments
- Sales Footprint
- Strategy Overview
- Marketing Strategy
- Product Strategy
- Channel Strategy
- Zeiss (DE)
- Renishaw (UK)
- Nikon Metrology (JP)
- Hexagon (SE)
- Case Studies
- Success Stories
- Recent Developments
- Competition Deep Dive
- Assumptions & Acronyms Used


