The Barricade Tape Market is estimated to be valued at USD 1.2 billion in 2025 and is projected to reach USD 1.9 billion by 2035, registering a compound annual growth rate (CAGR) of 4.4% over the forecast period.
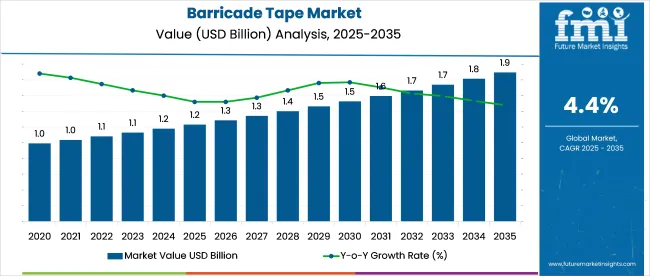
| Metric | Value |
|---|---|
| Barricade Tape Market Estimated Value in (2025 E) | USD 1.2 billion |
| Barricade Tape Market Forecast Value in (2035 F) | USD 1.9 billion |
| Forecast CAGR (2025 to 2035) | 4.4% |
The barricade tape market is experiencing consistent demand owing to increasing emphasis on workplace safety, accident prevention, and effective hazard communication across multiple sectors. Growing regulatory frameworks around occupational safety and the need for clearly visible demarcation solutions are reinforcing adoption.
Industrial and construction activities are leading the deployment, with tapes being used extensively for marking restricted areas, guiding traffic flow, and enhancing site safety compliance. Advances in material technology, including durable plastics with weather resistance and enhanced visibility features, are expanding the lifespan and usability of these products.
The outlook remains positive as companies continue to prioritize safety, compliance, and incident reduction, thereby driving steady consumption of barricade tape across diverse end use industries.
The market is segmented by Thickness, Material Type, and End Use and region. By Thickness, the market is divided into Up to 2 mm, 2 to 4 mm, 4 to 6 mm, 6 to 8 mm, and Above 8 mm. In terms of Material Type, the market is classified into Plastic, Paper, Aluminum Foil, and Cotton Fabric. Based on End Use, the market is segmented into Industrial and Non-Industrial. Regionally, the market is classified into North America, Latin America, Western Europe, Eastern Europe, Balkan & Baltic Countries, Russia & Belarus, Central Asia, East Asia, South Asia & Pacific, and the Middle East & Africa.
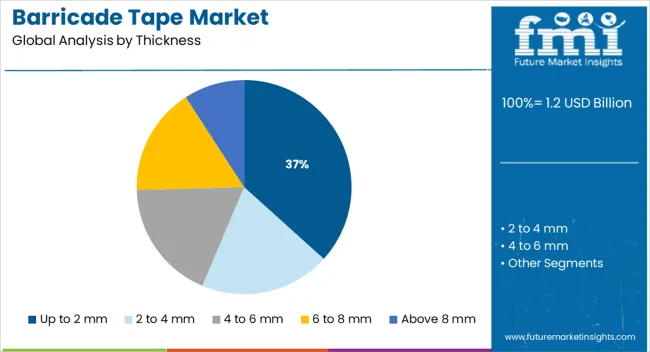
The up to 2 mm thickness segment is anticipated to hold 36.70% of overall market revenue by 2025, positioning it as the leading thickness category. Its dominance is attributed to the balance it offers between durability and flexibility, making it suitable for both temporary and semi permanent applications.
Lightweight handling, ease of installation, and cost effectiveness have further supported its adoption across construction sites, public spaces, and industrial facilities.
The demand for this thickness range continues to grow as it provides optimal visibility and tear resistance without adding unnecessary material costs, solidifying its role as the preferred thickness option.
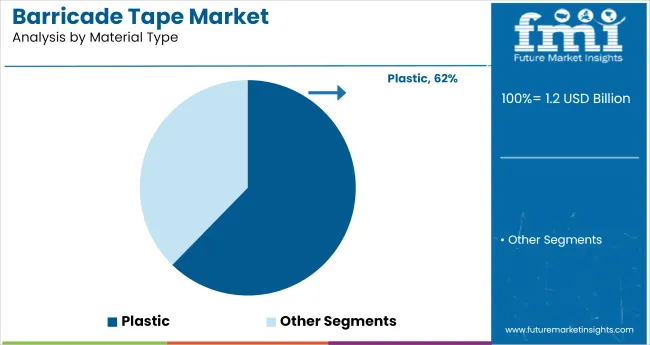
The plastic material type segment is projected to account for 54.20% of market revenue by 2025 within the material type category, making it the most prominent segment. Plastic barricade tapes are widely preferred due to their affordability, weather resistance, and ability to withstand harsh outdoor conditions.
They also offer high print clarity for warnings and instructions, which is essential for safety communication. Their versatility in industrial, construction, and commercial environments further reinforces their adoption.
Continuous advancements in recyclable and eco friendly plastic formulations are expected to strengthen the position of this segment, aligning with sustainability commitments while maintaining high utility.
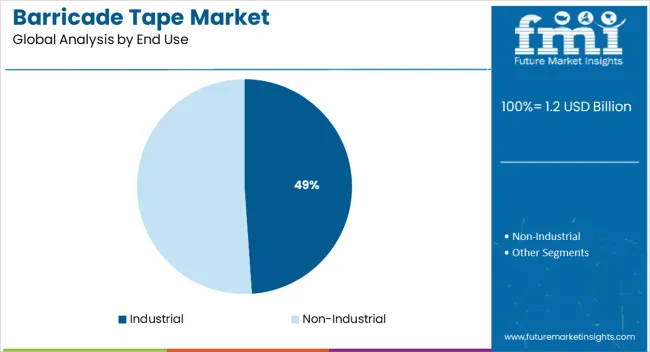
The industrial end use segment is expected to capture 48.90% of total market revenue by 2025, establishing it as the leading application area. This is driven by stringent safety regulations and the necessity of clear hazard identification in manufacturing plants, warehouses, and processing facilities.
The high risk of accidents in industrial environments has necessitated the widespread use of barricade tape for visual hazard warnings and operational demarcation. Employers have increasingly relied on durable and visible tapes to minimize workplace injuries and maintain compliance with occupational safety standards.
This strong reliance on barricade tape in industrial operations has positioned the segment as the dominant end use category in the market.
Global demand for barricade tape registered exponential growth driven by the increasing usage of barricade tape across various manufacturing facilities.
As per the analysis, the market is anticipated to exhibit growth at 4.4% CAGR between 2025 and 2035, as compared to the 2.3% CAGR recorded from 2020 to 2025.
According to the report, key players are planning to create cost-effective barricade tape for consumers that offers great strength against environmental factors such as dust, ultraviolet (UV) rays, and others.
To gain a competitive edge, a few of the market players are including about 70% wood fiber to manufacture biodegradable barricade tape and attract consumers, as these tapes are sustainable and have fewer carbon footprints.
| Year | 2020 to 2025 |
|---|---|
| CAGR | 2.3% |
| Value | USD 1 million (2020) |
| Value | USD 1.2 billion (2024) |
| Value | USD 1.20 billion (2025) |
| Year | 2025 to 2035 |
|---|---|
| CAGR | 4.4% |
| Value | USD 1.2 billion (2025) |
| Value | USD 1.90 billion (2035) |
| Value | USD 1.9 billion (2035) |
Manufacturers are also planning to upgrade production facilities to manufacture quality barricade tapes that either meet or exceed the standards of the American Public Works Association and have a long shelf life, even in extreme environmental conditions. Besides this, they are emphasizing making barricade tapes reusable to offer a great cost advantage to consumers.
To gain a competitive edge, market players are focusing on making barricade tapes durable and strong to withstand all types of weather conditions.
They are also making available improved quality barricade tapes at a low cost. Spurred by these factors, the barricade tape market is expected to register strong growth over the forecast period.
Given the industry's expansion, it is reasonable to suggest that the market is likely to have plenty of opportunities over the forecast period.
Short Term (2025 to 2029): Short-term opportunities in the market include an increase in demand for barricade tape in construction activities and a rise in infrastructure projects.
Medium Term (2029 to 2035): Medium-term opportunities include the growth of the industrial sector and the expansion of new facilities in barricade tape.
Long Term (2035 to 2035): In the long term, the growth of the global population and the increasing awareness of safety and security measures are expected to drive the demand for barricade tape.
Additionally, the use of innovative materials in the production of barricade tape is projected to offer long-term growth opportunities.
These factors are anticipated to support a 1.5X increase in the barricade tape market between 2025 and 2035. The market is projected to be worth USD 1.9 billion by the end of 2035, according to FMI analysts.
| Market Statistics | Details |
|---|---|
| Jan to Jun (H1), 2024 (A) | 2.2% |
| Jul to Dec (H2), 2025 (A) | 2.0% |
| Jan to Jun (H1), 2025 Projected (P) | 2.0% |
| Jan to Jun (H1), 2025 Outlook (O) | 2.6% |
| Jul to Dec (H2), 2025 Outlook (O) | 2.6% |
| Jul to Dec (H2), 2025 Projected (P) | 2.2% |
| Jan to Jun (H1), 2025 Projected (P) | 2.4% |
| BPS Change: H1,2025 (O) - H1,2025 (P) | 40 |
| BPS Change: H1,2025 (O) - H1,2024 (A) | 60 |
| BPS Change: H2, 2025 (O) - H2, 2025 (P) | 40 |
| BPS Change: H2, 2025 (O) - H2, 2025 (A) | 60 |
The Occupational Safety and Health Administration (OSHA) has made it compulsory for all employers to provide proper barricading of hazardous areas at the workplace.
Stringent government regulations implemented to ensure workplace safety are expected to drive the demand for various types of barricading tools and products. Hence, the barricading tape is gaining popularity as a safety tool within automotive, pharmaceutical, building & construction, and other manufacturing industries.
The increasing rate of accidents in industries such as mining, construction, and chemicals has compelled key players to adopt barricade tape as a safety solution even in underdeveloped and emerging markets.
Demand for barricade tape is surging, because they are used to mark dangers at the workplace by stretching or sticking it to reduce the risk of accidents and fatalities. This trend is helping the market to gain pace in India, China, and South Korea, as the focus on workplace safety has surged in these countries.
Increasing demand for manufactured goods has resulted in a fast-paced expansion of various manufacturing and infrastructural facilities for manufacturing as well as storage of goods.
Manufacturers, converters, transport & logistical partners have witnessed the need for expansion to cope with fast-paced growth in demand for all types of goods and solutions.
The proliferation of stringent safety regulations across infrastructural and industrial workspaces is expected to drive the demand for essential materials used for marking floors, restricted areas, and other parts of an operational or storage facility.
Demand for barricade tapes is also likely to surge, as industries focus on adhering to stringent safety and workplace marking regulations, implemented by various security authorities, to ensure there is no risk to the people.
Considering this, the notable rise in building & construction activities across the globe and favorable government regulations are expected to fuel the demand for security & barricading areas at workplaces and ongoing construction sites.
Key players have come up with sustainable options for barricade tape, due to increased environmental awareness regarding the harmful effects of plastic on the eco-system.
Continuous research & development done by leading players market have aided the development of paper-based warning tape, such as “water-activated adhesives” that can be easily activated by moistening the tape with water.
Producers are trying to differentiate these tapes from other products by marketing them as cost-saving tape, as they do not require additional adhesives. They are also promoting them as sustainable barricade tape, preeminently suited both for barricading and sealing. This is expected to create growth opportunities for the market.
Overall, due to the rising demand for sustainable products within key end-use industries, demand for paper-based barricade tape is expected to rise.
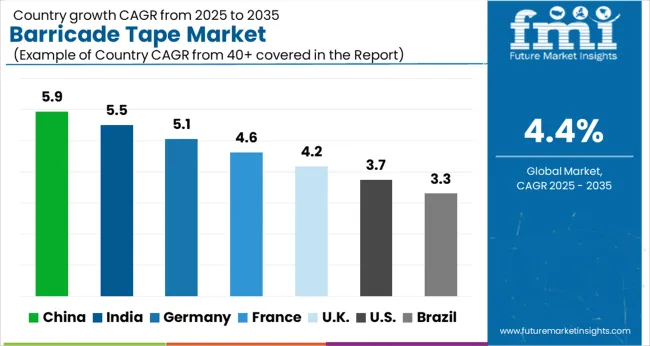
| Countries | Market Value (2025) |
|---|---|
| United States | USD 230.7 million |
| Germany | USD 56.0 million |
| China | USD 48.0 million |
| India | USD 46.3 million |
| United Kingdom | USD 36.8 million |
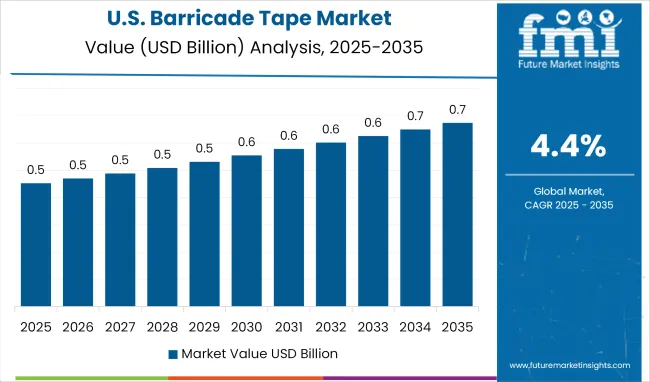
As per FMI, the United States is currently the leading market across North America, accounting for a 20.8% share of the global market in 2025. The United States barricade tape market has experienced steady growth lately, driven by increased demand from various industries including construction, manufacturing, and transportation.
Strict laws associated with the use of barricades at workplaces to avoid potential hazards, coupled with labor laws minimizing the risks of accidents for workers, are anticipated to propel the demand for barricade tape.
Moreover, the market is estimated to expand at a significant CAGR by the year 2035 due to increased non-industrial usage of barricade tape in traffic signs and restricted areas.
Also, demand for durable barricade tape is expected to increase due to its ability to withstand external atmospheric repercussions, which is expected to boost the market across the United States.
In recent years, the construction industry has been one of the leading drivers of market growth. With the increasing number of large-scale construction projects taking place in this country, the demand for barricade tape has increased.
The construction industry prefers using barricade tape because it is useful for securing construction sites and protecting workers and bystanders.
Another factor driving the market in the United States is the increasing focus on workplace safety.
Employers are required under the Occupational Safety and Health (OSH) Act, which is overseen by the Occupational Safety and Health Administration, to maintain a safe and healthy workplace that is devoid of significant potential dangers. This is occasionally referred to as the OSH Act's General Duty Clause.
General industry, construction, marine, and agricultural are the four subcategories under which OSHA regulations fall. The set covers maximum employees and work locations in the general industry.
These requirements are made to safeguard workers from a range of threats. Therefore, many companies are investing in safety measures and tools, such as barricade tape, to help prevent accidents and injuries. This has increased the demand for barricade tape in the United States.
Germany accounted for over 5.1% share of the global market in 2025, spearheading growth across Europe. The Germany barricade tape market is a booming one, with significant demand for the product in various industries and applications.
The construction industry in Germany is thriving, with investments in both commercial and residential building projects. The increasing number of sites and the growing concern for workplace safety are increasing the demand for barricade tape in this industry.
In terms of building stock, Germany has a leading construction market in Europe. The thriving construction sector in Germany benefits from reasonable economic growth and a favorable environment for investments. Given that it contributed nearly 5.9% of Germany's GDP in 2024, the construction sector plays a significant role in the country's economy.
Another significant market in Germany is the event management industry. Events such as concerts, festivals, and sports events often require the use of barricade tape to direct crowds and control access to certain areas. With Germany being home to several key international events, this is a growing barricade tape market.
The Occupational Safety Act by the Federal Ministry of Labor and Social Affairs has made it mandatory for all employers to assess potential hazards. Compliance with this act can impact the health or lives of the workers by providing proper demarcation and warning indications through hard or soft barricades against the potential hazard.
Driven by this, Germany is expected to be one of the leading markets for barricade tape across the European region. As Germany is home to the world’s prime automotive industry and other manufacturing industries, demand for barricade tape is expected to surge to ensure the safety of the workers.
In China, the barricade tape industry has grown prominently of late owing to the country’s rapid economic development and growing concern for safety. One factor contributing to the growth of the China barricade tape market is the country’s construction boom.
China has been undergoing rapid urbanization and infrastructure development, leading to a huge demand for construction materials.
The Ministry of Housing and Urban-Rural Development predicts that China's construction industry is likely to continue to develop at the same rate as the overall economy, contributing 6% of the country's GDP.
China announced intentions to grow its construction sector in January 2025 as a part of the 14th Five-Year Plan (2024 to 2025), putting one of the cornerstones of the economy on a green, smart, and safe route.
The government has set a goal that prefabricated structures, which can be manufactured in factories in part or in full before being sent to construction sites, may make up more than 30% of all new buildings built in the nation.
During the next 15 years, China's state-owned railway corporation wants to double the size of its high-speed rail network. The industry of infrastructure building is likely to develop as a result. These factors are expected to increase the demand for barricade tape in China.
With significant infrastructural growth witnessed over the past few years, along with the expansion of key industries such as general industrial, agriculture, and mining, China is expected to be one of the leading consumers of barricade tape in East Asia.
The availability of cheap raw materials, skilled labor, and access to up-to-date production machinery in a cost-effective range makes it a lucrative market for key barricade tape manufacturers.
Subsequently, key players are eyeing to achieve economies of scale by producing at low cost and serving global markets to maintain their supremacy over existing competitors in the market. Hence, China is anticipated to emerge as a key producer as well as consumer of barricade tape over the upcoming decade.
The barricade market in China is expected to continue its growth trajectory by exhibiting a 6.87% CAGR during the forecast period, and is anticipated to surpass USD 1.9 million by 2035.
India barricade tape market has seen significant growth lately, and the market is projected to develop at 7.64% CAGR during the forecast period, reaching USD 89.8 million by 2035.
The market is primarily growing owing to the increasing demand for safety and security in various industries, including construction, oil and gas, and transportation.
With the government’s emphasis on infrastructure development and the rise of real estate projects, the demand for barricade tape has increased in India. More than 610 projects totaling USD 1 million are going to be completed between 2020 and 2035 as a part of the Sagarmala Program.
These initiatives may concentrate on upgrading and creating additional ports, enhancing port connectivity, fostering manufacturing connected to ports, and strengthening coastal communities.
The transportation sector is also a significant user of barricade tape in India. The PM Gati Shakti Master Plan for Expressways is likely to be constructed by 2025, enabling speedier travel. In January 2025, the government gave its approval for the construction of 21 Greenfield airports around the nation.
The Airports Authority of India (AAI) expects to invest USD 338 million during the following four to five years in building new airports, expanding existing facilities, and modernizing several airports. This is expected to increase the demand for barricade tape across the country in the upcoming years.
The Ministry of Steel, Government of India has made it compulsory for all employers to indicate protective barricades as a warning to prevent unauthorized entrance at hazardous places.
The Government has also made a compulsion that barricade devices must be visible from a safe distance to ensure the safety of workers and employees. In addition to this, awareness regarding employee safety at the workplace and prevention of industrial accidents is expected to make India the leading market across South Asia.
India has one of the leading industrial operations for all end-use industries. Also, the government is providing a much-needed boost to industrial expansion by offering easy financing options, allowing FDI (Foreign Direct Investment). This is expected to create ample growth opportunities for barricade tape market players across India.
The barricade tape sector in the United Kingdom is a highly competitive and notably growing sector in terms of CAGR rate. With the increase in construction activities, safety regulations, the growing awareness about workplace safety, and the demand for barricade tapes, has increased significantly at present time.
The market in the United Kingdom is expected to surpass USD 53.8 million by 2035, exhibiting a CAGR of 4.31%.
Such regulations make it mandatory for employers and project partners to comply with workplace safety guidelines issued by a government agency across the United Kingdom, which are expected to improve the demand.
Also, increased awareness regarding limiting access to restricted areas to prevent hazardous effects on the health of the employees is anticipated to make the United Kingdom an important barricade tape market across Europe.
According to the Health and Safety Executive (HSE) Agency of the United Kingdom, construction activities during construction, commissioning, and operations to ensure proper barricading (either rigid or flexible whichever is applicable) were approved by HSE for ensuring the safety of employees and also the people in the vicinity, visitors and general public.
The country has a strong construction industry and several projects underway. In the field of construction, the United Kingdom enjoys a significant competitive advantage.
Domestic enterprises are setting the standard for sustainable building techniques owing to their world-class skills in engineering, design, and architecture.
The government is doing everything it can to support the growth of domestic firms and give them the aspirations, self-assurance, and drive they need to compete on a global stage to support economic recovery.
This entails overhauling the planning process, securing money for key infrastructural projects, and bolstering the property bubble with crucial schemes like the Help-to-Buy Equity Loan Scheme and the Funding for Lending Scheme.
The barricade tape industry in the United Kingdom is projected to expand significantly during the forecast period. With the massively growing construction industry, the country also witnesses increasing demand for workplace safety.
According to the Health and Safety at Work Act of 1974 (HSWA), which applies to all workplaces, an employer is required to take all reasonable steps to ensure a safe and healthy work environment.
Numerous statutes, rules, codes of conduct, and instructions are added to the HSWA. The Construction (Design and Management) Regulations 2020 outline the steps engaged in construction work must undertake to safeguard both their safety and the safety of everyone the activity might impact.
| Segment | Thickness |
|---|---|
| Attributes | 6 to 8 mm |
| Details (Market Share in 2025) | 40.2% |
| Segment | Material Type |
|---|---|
| Attributes | Plastic |
| Details (Market Share in 2025) | 62.3% |
Barricade tape with a thickness ranging between 6 to 8 mm accounts for maximum sales in 2025, making it the preferred thickness type segment among all others.
Barricade tape with a thickness between 6 to 8 mm is highly sought after because it offers the right balance of durability and flexibility. This thickness is strong enough to withstand normal wear and tear, yet is still flexible enough to be easily deployed and manipulated on different surfaces. Additionally, this thickness is suitable for both indoor and outdoor use, making it a versatile option for a wide range of applications.
The tape with a thickness of 6 to 8 mm is strong in comparison with barricade tape having a thickness of less than 6 mm. Moreover, tape having a thickness of more than 8 mm is too expensive for the end-user industries.
Furthermore, barricade tape between 6 to 8 mm is the economical and durable choice for large-scale as well as medium-sized industries for fulfilling their barricading needs.
Plastic is cost-effective and easy to procure in comparison with other raw materials, such as cotton, paper, and aluminum foil, used to manufacture barricade tape. Plastic is also a suitable material choice for outdoor usage, since it is durable and can tolerate exposure to dangers. Plastic barricade tapes are also lightweight, making them easy to handle and install.
Plastic tapes are easy to wrap around barriers and poles, since they can be made in different thicknesses and are flexible. Additionally, plastic barricade tapes can be printed with various messages and designs.
This makes barricade tape a versatile choice for numerous applications. Hence, sales of barricade tape made from plastic are anticipated to increase 1.5 times over the forthcoming decade.
Key players are manufacturing barricade tape made up of recyclable plastics, as sustainable barricading products offer a higher profit margin to all the manufacturers. As they are eco-friendly, leading players are increasing production to woo customers.
As per the study, more than half of barricade tape sales are anticipated to be contributed by the industrial sector through 2035. Barricade tapes are used as a key safety solution for building & construction, automotive, aerospace, mining, and agricultural, and other manufacturing industries.
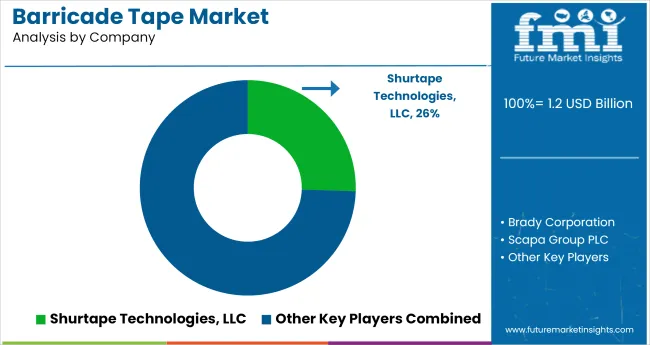
Key players operating in the barricade tape market are focusing on untapped markets to capitalize on lucrative growth opportunities offered by developing and underdeveloped regions. Additionally, these players are coming up with sustainable barricade tapes that are environment friendly, to attract concerned consumer bases.
Intertape Polymer Group Inc.
Intertape Polymer Group Inc. is a premier supplier of packaging and protective solutions with its main office in Sarasota, Florida, serving a myriad of end-use industries and regions.
The company creates, produces, and markets a wide range of products, including woven and non-woven goods, packaging machinery, flex and compress films, pressure-sensitive and water-activated barrier, and other tapes, as well as paper and film-based tapes.
In June 2024, Intertape Polymer Group Inc. announced the acquisition of Nuevopak Global Limited for USD 40 million to strengthen its packaging machines portfolio.
Tesa SE
Tesa SE, based in Germany, manufactures adhesive products. When it was first established in 2001, the business was a part of Beiersdorf, and it continues to be one of its subsidiaries today. The brand name is now widely used to refer to sticky tape in Germany.
The business not only sells adhesive tapes to consumers, but also provides adhesives to other sectors.
Tesa's customers include Apple and Samsung, who use its adhesives to construct smartphones and tablet computers, as well as the automotive sector, where it offers adhesives for a variety of purposes including windows, sensors, and displays.
In June 2025, Tesa introduced a range of flame-resistant adhesive tapes. The newly developed tape tesa®flameXtinct, which is already effectively utilized in the construction sector, is now widely used in the public transport sector.
These new adhesive tapes are fully halogen-free and self-extinguish in the case of a fire within a brief period.
In January 2020, Tesa SE announced the expansion of its production facility in Suzhou, China, by investing more than USD 35 million, which includes the creation of a clean-room production unit and expanded production capabilities for special adhesive tape.
3M Company
Multinational company 3M, originally known as the Minnesota Mining and Manufacturing Company based in America, is active in the manufacturing, consumer products, worker safety, and United States healthcare industries.
The business manufactures more than 60,000 items under various brands, such as laminates, abrasives, adhesives, passive fire protection, window films, paint protection films, personal protective equipment, electrical and electronic connecting, dental and orthodontic products, insulating materials, and so forth.
In August 2024, a new benchmark for safeguarding, recognizing, and locating all kinds of subsurface utilities was established through cooperation between Damage Prevention Solution and 3M.
Radiofrequency (RF) route markers included in the 3M™ Electronic Marking System (EMS) Barricade Tape 7900 Series remove several obstacles to accurate positioning.
This product's XT version employs patented Signaltape® technology and has a high-strength core to reduce the danger by warning excavators before running into an underground facility, even when crews do not take preventative precautions.
In September 2024, 3M officially confirmed that all mainline 3M DBI-SALA branded harnesses were equipped with 3M Fall Protection Suspension Trauma Safety Straps. This was made possible with the assistance of the construction and development company Skanska USA.
The global barricade tape market is estimated to be valued at USD 1.2 billion in 2025.
The market size for the barricade tape market is projected to reach USD 1.9 billion by 2035.
The barricade tape market is expected to grow at a 4.4% CAGR between 2025 and 2035.
The key product types in barricade tape market are up to 2 mm, 2 to 4 mm, 4 to 6 mm, 6 to 8 mm and above 8 mm.
In terms of material type, plastic segment to command 54.2% share in the barricade tape market in 2025.


Full Research Suite comprises of:
Market outlook & trends analysis
Interviews & case studies
Strategic recommendations
Vendor profiles & capabilities analysis
5-year forecasts
8 regions and 60+ country-level data splits
Market segment data splits
12 months of continuous data updates
DELIVERED AS:
PDF EXCEL ONLINE
Market Share Distribution Among Barricade Tape Manufacturers
High Security Wedge Barricades Market Size and Share Forecast Outlook 2025 to 2035
Tape Unwinder Market Size and Share Forecast Outlook 2025 to 2035
Tape Dispenser Market Size and Share Forecast Outlook 2025 to 2035
Tape Dispenser Industry Analysis in Japan Size and Share Forecast Outlook 2025 to 2035
Tape Dispenser Industry Analysis in Western Europe Size and Share Forecast Outlook 2025 to 2035
Tape Measure Market Size and Share Forecast Outlook 2025 to 2035
Tape Backing Materials Market Analysis by Material Type, Application, and Region through 2025 to 2035
Tape Stretching Line Market Analysis – Growth & Trends 2025 to 2035
Tapes Market Insights – Growth & Demand 2025 to 2035
Tape Banding Machine Market Overview - Demand & Growth Forecast 2025 to 2035
Competitive Overview of Tape Dispenser Companies
Competitive Overview of Tape Backing Materials Companies
Tape & Label Adhesives Market
Tape Applicator Machines Market
UV Tapes Market Growth - Trends & Forecast 2025 to 2035
PVC Tapes Market Size and Share Forecast Outlook 2025 to 2035
Leading Providers & Market Share in PVC Tapes Industry
ESD Tapes and Labels Market from 2025 to 2035
USA Tapes Market Analysis – Growth & Forecast 2024-2034

Thank you!
You will receive an email from our Business Development Manager. Please be sure to check your SPAM/JUNK folder too.
Chat With
MaRIA