
- Market Size (2026)
- USD 26.0 Bn
- Forecast (2036)
- USD 44.4 Bn
- CAGR (2026 to 2036)
- 5.5%
How big is the Bed Linen Market in 2026?
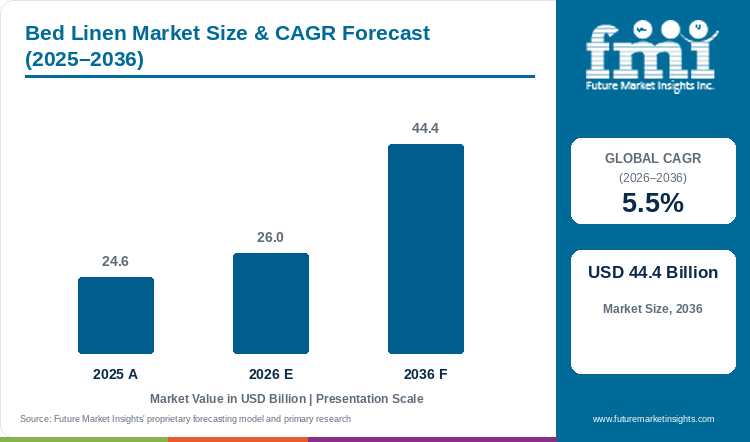
Sales of sheets, sheet sets and pillowcases are expected to raise the Bed Linen Market to USD 44.4 billion by 2036. FMI estimates the market at USD 26.0 billion in 2026 and forecasts a 5.5% CAGR from 2026 to 2036. The market was valued at USD 24.6 billion in 2025. Cotton holds 41.5% by material in 2026. Solid designs account for 34.2% by pattern, and Queen sizes account for 38.6% by size.
Household replacement and hotel buying drive repeat demand. Hotels replace sheets on a fixed laundry cycle, so guest volumes feed straight into orders. The ASEAN Secretariat reported about 144 million international visitor arrivals in the region in 2025 [1]. In Japan, the Japan Tourism Agency recorded a 9.4% rise in foreign guest nights in 2025 [2].
Fibre cost is the main restraint. The World Bank Cotlook A index averaged USD 1.7 per kg in 2025 and reached USD 2.1 per kg in September 2026 [4]. Mills that sell on fixed retail programmes absorb that rise until contracts reset. Indo Count Industries offers a qualified example of supplier scale [17]. It reported record quarterly revenue of INR 12.2 billion to June 2026 from 153 million metres of bed linen capacity. One exporter's growth does not prove a global rise in sheet volumes.
Key Market Trends & Insights
- Cotton buyers face a tighter season. The US Department of Agriculture forecasts 2026/27 world cotton production down 3.4% to 118.0 million bales, while world mill use rises 1.9% [5]. Stocks fall as a result, which strengthens the price case for blended and synthetic sheets.
- Trade agreements are changing where buyers source finished sheets. India and the European Union concluded free trade negotiations on 27 January 2026, with zero duty on all textile and clothing lines once the agreement enters into force [14]. European importers can plan supplier shifts ahead of that date.
- Indian exporters are building their own brands next to private-label programmes. Branded products made up about 18.0% of Welspun Living's sales in the June 2026 quarter [16]. Indo Count sells under owned names such as Fieldcrest and Wamsutta and under licences that include Beautyrest and Tommy Hilfiger [17]. Brand ownership gives these suppliers more control over price.
Regional Highlights
- North American importers are working through a changing tariff schedule. The US Supreme Court ruled on 20 February 2026 that the International Emergency Economic Powers Act does not authorise tariffs [9]. India's Ministry of Commerce later reported a separate additional 10.0% Section 301 duty on Indian goods outside exempt categories such as generic pharmaceuticals and Section 232 products [10]. Retailers must reprice imported sheet programmes each time duty rates change.
- Europe remains a central meeting point for bed linen buyers and suppliers. Heimtextil 2026 in Frankfurt drew about 3,000 exhibitors from 148 nations and more than 48,000 trade buyers [27]. Most visitors came from outside Germany, so the fair works as a regional sourcing hub.
Bed Linen Market Size and Forecast
Table 1: Bed Linen Market Size and Forecast
| Market size and forecast | Value |
|---|---|
| Market size in 2025 | USD 24.6 billion |
| Estimated market size in 2026 | USD 26.0 billion |
| Projected market size by 2036 | USD 44.4 billion |
| CAGR from 2026 to 2036 | 5.5% |
Source: Future Market Insights analysis of the bed linen market, 2026.
Analyst Perspective
“Households replace sheets when they wear out or when they redecorate, and they compare fabric feel and thread count against price. Hotels buy on durability through repeated laundering, so a supplier must prove wash performance before it wins a contract. Cotton price swings are the main qualification risk, because a mill that cannot hold its quoted price loses the next retail programme.”
- Rahul Pandita, Principal Analyst at Future Market Insights
How is the Bed Linen Market segmented?
- By material: Cotton, Poly Cotton, Polyester, Microfibre, Linen, Sateen, Satin, Flannel, and Denim.
- By pattern: Solid, Floral, Abstract, Geometric, Striped, Checkered, Modern, Paisley, Character, Ornament, and Polka Dot.
- By size: Single, Double, Queen, and King. Bedding sold alongside sheets includes products covered in the pillow market.
- By region: North America, Latin America, Western Europe, Eastern Europe, East Asia, South Asia and Pacific, and Middle East and Africa.
Why does Cotton lead by Material in the Bed Linen Market in 2026?
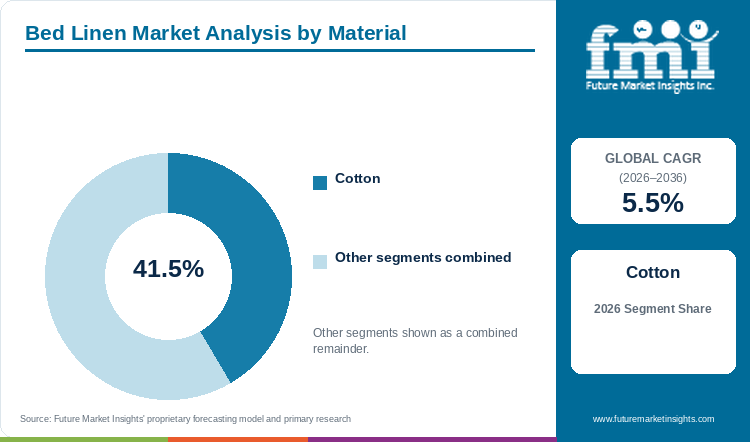
Cotton holds 41.5% of the Bed Linen Market by material in 2026.
Buyers choose cotton for breathability and for how it softens after washing. Large Indian mills are built around cotton weaving and finishing. Welspun Living runs 108 million metres of bed linen capacity, and Indo Count runs 153 million metres [16][17]. These plants supply cotton sheet programmes to retailers in North America and Europe.
Raw material cost is the weak point of the segment. The US Department of Agriculture expects the US upland farm price to average 77 cents per pound in 2026/27, against 62.2 cents a season earlier [5]. India exempted raw cotton imports from customs duty from 1 June to 31 October 2026 to protect mill supply [7]. A cotton sheet costs more to make when fibre prices rise, and that can move price-sensitive buyers towards blends.
Poly Cotton, Polyester, Microfibre, Linen, Sateen, Satin, Flannel and Denim together hold the remaining 58.5% by material. Polyester inputs have also repriced in 2026, according to the International Cotton Advisory Committee [8]. Cotton's lead therefore rests on buyer preference more than on cost.
Table 2: Material, 2026 Share
| Leading Share | 2026 market share |
|---|---|
| Cotton | 41.5% |
| All Other Segments Combined Share | 58.5% |
Source: Future Market Insights analysis of the bed linen market, 2026.
Why do Solid designs lead by Pattern in the Bed Linen Market in 2026?
Solid designs account for 34.2% of the Bed Linen Market by pattern in 2026.
Solid colours sell across every channel because they match most bedroom styles. Hotels buy plain white or single-colour sheets in bulk so that sets can be mixed after laundering. Retailers also carry solid colours as core lines that stay in range for several seasons. Core lines need less markdown than seasonal prints.
Production economics support the lead. A mill can dye long runs of one shade and cut them into many sizes. Printed designs need extra set-up for each pattern and colourway. Mills with high capacity use plain runs to keep their looms full. Welspun Living reported 60.0% utilisation of its bed linen capacity in the June 2026 quarter [16]. Long solid-colour orders help mills raise that rate.
Floral, Abstract, Geometric, Striped, Checkered, Modern, Paisley, Character, Ornament and Polka Dot designs together represent the remaining 65.8%. Printed and character sheets often sell as gifts or as seasonal home décor updates. Many shoppers also buy personalised bedding, which links this segment with the personalized home decor market.
Table 3: Pattern, 2026 Share
| Leading Share | 2026 market share |
|---|---|
| Solid | 34.2% |
| All Other Segments Combined Share | 65.8% |
Source: Future Market Insights analysis of the bed linen market, 2026.
Why does Queen lead by Size in the Bed Linen Market in 2026?
Queen sizes represent 38.6% of the Bed Linen Market by size in 2026.
Size demand follows the beds people buy. Queen beds are widely used in US homes and hotel rooms. North American retailers therefore give queen sets the widest range. US furniture and home furnishings stores sold about USD 10.7 billion of goods in September 2026, up 4.9% on a year earlier [22]. New bed and mattress sales lead directly to new sheet purchases in the matching size.
Hotels also standardise room sizes to simplify laundering. A hotel that fits one bed size across most rooms can hold less linen stock. Japan's business hotels ran at 75.3% occupancy in 2025 [2]. High occupancy raises the number of laundry cycles and shortens the replacement period for each sheet.
Single, Double and King sizes together account for the remaining 61.4%. King sizes sell at higher prices per set but in smaller volumes. Single sizes remain common in student housing, hospitals and some Asian homes.
Table 4: Size, 2026 Share
| Leading Share | 2026 market share |
|---|---|
| Queen | 38.6% |
| All Other Segments Combined Share | 61.4% |
Source: Future Market Insights analysis of the bed linen market, 2026.
What are the key drivers restraints and opportunities?
Bed linen demand comes from two buyers with different habits. Households buy on comfort and price, while hotels and institutions buy on durability and laundry cost.
Driver
Travel growth raises hotel linen orders. Vietnam received nearly 21.2 million international visitors in 2025, up 20.4% [3]. Japan received about 42.7 million visitors in 2025, up 15.8% [29]. Each additional room night adds to laundry cycles. Hotels then replace worn sheets sooner, and new hotels need full opening stock.
Restraint
Cotton and synthetic fibre prices are moving up in 2026. The USDA's weekly spot average was 74.1 cents per pound at the end of October 2026, against 61.1 cents a year earlier [6]. Mills that sold on fixed prices must absorb the difference until contracts reset. Retailers then face a choice between higher shelf prices and thinner margins.
Opportunity
Branded and licensed sheet sets offer a better margin than private label. Indo Count sells under owned brands and under licensed names such as Beautyrest [17]. Brands let suppliers set retail prices and run their own promotions. Buyers of branded sheets often add matching products such as the items covered in the mattress topper market. A supplier with brands can therefore sell more than one item per order.
How do trade rules affect bed linen purchasing?
Import duties decide which country can supply a sheet programme at the target price. In February 2026, the US Supreme Court ruled that emergency economic powers do not authorise tariffs [9]. India's Ministry of Commerce reported in July 2026 that the United States had imposed an additional 10.0% Section 301 duty covering about 55.0% of Indian exports, with generic pharmaceuticals, smartphones and Section 232 products exempt [10]. India and the United States were still working to finalise an interim trade deal in September 2026 [11].
Other markets are lowering duties. The UK-India trade agreement entered into force on 15 July 2026 [12]. It gives Indian goods zero-duty access on 1,143 textile tariff lines, and India's Ministry of Textiles names bedding products among the beneficiaries [13]. Buyers in duty-free markets can reprice Indian programmes. US buyers must still compare landed cost across several origins each time rates change.
What limits reliable bed linen supply and quality?
Fibre supply and mill capacity set the limit on reliable sheet supply. The USDA expects 2026/27 world ending stocks of 70.7 million bales, 5.0 million below the previous season [5]. Lower stocks raise the risk of price spikes during the year. Mills that cannot lock in fibre at the right time face higher costs on orders already priced.
Quality failures carry a direct cost. Sheets must keep their size and colour through many washes. A sheet that shrinks or pills after a few cycles damages a retailer's brand and a hotel's guest reviews. Buyers therefore test fabric samples before they approve a supplier. Capacity is not the main constraint for large Indian mills, since Welspun ran its bed linen lines at 60.0% utilisation in the June 2026 quarter [16].
Where can suppliers win additional business?
Suppliers can win business by making goods close to their largest buyers. Welspun Living began making pillows in Nevada in June 2026 [16]. Indo Count opened a North Carolina plant for pillows and quilts in January 2026 [17]. Local plants shorten lead times and reduce tariff exposure on finished goods. Retailers can also add bedroom care products sold next to sheets, such as those in the pillow and linen sprays market. Each extra product raises the value of a single retail account.
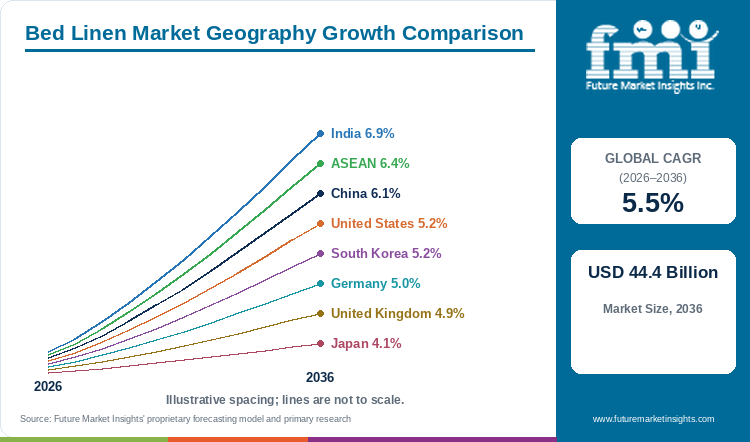
Bed Linen Market by Country (2026 to 2036)
Table 5: Bed Linen Market Country Growth Forecast
| Country | CAGR, 2026 to 2036 |
|---|---|
| India | 6.9% |
| ASEAN | 6.4% |
| China | 6.1% |
| United States | 5.2% |
| South Korea | 5.2% |
| Germany | 5.0% |
| United Kingdom | 4.9% |
| Japan | 4.1% |
Source: Future Market Insights analysis of the bed linen market, 2026.
India
India is a leading exporter of cotton sheets and a growing domestic market for branded bedding. The Ministry of Textiles reported textile and apparel exports of INR 3,16,334.9 crore in 2025-26, up 2.1% [15]. Exports of cotton yarn, fabrics, made-ups and handloom products reached INR 1,02,399.7 crore. Those plants also give Indian brands a cost advantage at home. Welspun Living's home textile revenue rose 26.2% in the quarter to June 2026 [16].
Urban households trading up from unbranded sheets give India the fastest rate in the profiled group, a 6.9% CAGR over 2026 to 2036. Himatsingka Seide sells in India under its Himeya, LIV and Atmosphere brands [19]. Trident earns 53.0% of its revenue from bed and bath linen [18]. These firms can shift some export capacity to the home market when overseas orders slow.
Government support keeps mill costs in check. The Rebate of State and Central Taxes and Levies scheme for made-ups was extended to 30 September 2026 [7]. India also exempted raw cotton imports from customs duty between 1 June and 31 October 2026 [7]. Both measures help mills hold prices for domestic buyers. Weak export demand could push mills to cut prices at home, which would lift volumes faster than revenue. Wide retail distribution will matter most for brands chasing rising urban incomes.
ASEAN
Tourism is the main source of new bed linen demand across ASEAN. The ASEAN Secretariat reported about 144 million international visitor arrivals in 2025 [1]. Hotels, serviced apartments and resorts all buy sheets in bulk. They also replace stock more often in hot, humid climates.
Vietnam shows how quickly hotel demand can grow. The country received nearly 21.2 million international visitors in 2025, an increase of 20.4% on 2024 [3]. New hotels in Hanoi, Ho Chi Minh City and coastal resorts need full opening stock of sheets and pillowcases. Existing hotels then add replacement orders on each laundry cycle. Hotel buying favours durable cotton and poly cotton blends in white and solid colours.
Tourism and urban housing together support a 6.4% CAGR for ASEAN between 2026 and 2036. The figure covers a group of markets with very different income levels and channels. Hotel and institutional demand dominates in tourist centres. Household demand grows with urban apartment building in cities such as Jakarta, Bangkok and Manila. Many sheets sold in the region are imported, so exchange rates and freight costs shape shelf prices. Suppliers that hold stock in regional warehouses can serve hotels faster than suppliers shipping each order from overseas. A slowdown in travel would delay hotel refurbishment cycles and cut replacement orders. Hotel groups with properties in several ASEAN countries can also centralise buying. That gives large suppliers an advantage over small local mills.
China
Chinese shoppers are spending more on textiles than on large home furnishings. The National Bureau of Statistics reported that retail sales of clothes, shoes, hats and textiles rose 4.6% to CNY 1,082.4 billion in January to September 2026 [20]. Furniture sales fell 4.7% over the same period, and household appliance sales fell 4.9% [20]. Bed linen fits this pattern, because it is a low-cost way to refresh a bedroom without buying new furniture.
Domestic brands are winning from that shift. Luolai Lifestyle grew first-half 2026 revenue by 5.5% to CNY 2,301.9 million [21]. Its attributable net profit rose 34.4%, which shows better pricing and cost control. Branded sets with higher thread counts and printed designs sell at a premium over unbranded sheets.
Replacement buying across a large base of urban homes supports a 6.1% CAGR for China over 2026 to 2036. Total retail sales grew only 1.1% in January to September 2026 [20]. Bed linen is therefore growing faster than general consumption. Online channels allow brands to test new colours and sizes quickly. Luolai reported profit growth well ahead of its revenue growth in the first half of 2026 [21]. A weak housing market slows the number of new homes that need full bedding sets. Clear quality grades help replacement sets stand out from cheaper unbranded sheets. Lower-priced sheets from many small producers will keep pressure on mid-market prices.
United States
Tariffs have been the biggest cost variable for US sheet buyers in 2026. Williams-Sonoma, owner of Pottery Barn, said tariff costs cut its merchandise margin by 230 basis points in the quarter to July 2026 [23]. It also booked a USD 167.8 million reduction to cost of goods sold from refunds of emergency tariffs. Those tariffs were struck down by the US Supreme Court in February 2026 [9].
Demand at the shelf is still rising. Furniture and home furnishings stores sold about USD 10.7 billion of goods in September 2026, up 4.9% on a year earlier [22]. Pottery Barn's comparable brand revenue rose 5.1% in the second quarter [23]. Shoppers continue to buy sheet sets when they buy new beds and bedroom furniture.
Shelf demand outweighs tariff noise in the US outlook of a 5.2% CAGR for 2026 to 2036. Queen sets remain the largest size line in this market. Suppliers are also moving some production closer to US buyers. Welspun Living began pillow production in Nevada in June 2026 [16]. Indo Count opened a plant in North Carolina in January 2026 [17]. These plants make pillows and quilts, so most sheet programmes still rely on imported fabric and finished goods. Further duty changes can shift sourcing between countries within a single season. Buyers who qualify more than one origin can protect their programmes against these changes.
South Korea
Inbound tourism is lifting hotel linen demand in South Korea. The Ministry of Culture, Sports and Tourism reported 15.05 million foreign visitors from January to August 2026, up 21.6% on a year earlier [24]. Seoul and Busan hotels need more rooms in service and more frequent laundry cycles. That raises orders for durable white sheets and pillowcases. Guesthouses and serviced apartments add further demand, although they buy in smaller lots.
Household purchases are moving online. The Ministry of Data and Statistics reported online shopping sales of KRW 24.2 trillion in August 2026, up 7.3% on a year earlier [25]. Online stores make it easy to compare fabric types, thread counts and prices. Brands that sell direct can show product details and customer reviews that a small shop cannot.
Hotel demand from tourism and steady household replacement give South Korea a 5.2% CAGR over 2026 to 2036. Hotel growth favours white and solid-colour sets that are easy to launder in bulk. Households buying online can compare materials such as cotton, sateen and microfibre side by side. Online price competition is squeezing margins for mid-priced brands. Reliable delivery and a clear quality story win both hotel and household orders. Hotel buyers also expect quick replacement of worn stock during peak travel months. Local warehousing helps suppliers meet those short delivery windows.
Germany
German shoppers are cutting back on discretionary household goods. Destatis reported that real retail sales fell 2.3% in September 2026 compared with a year earlier [26]. Non-food sales fell 2.8% in real terms but rose 1.7% in nominal terms. Shoppers are paying more per item and buying fewer items. Bed linen sellers face the same pattern.
Germany remains Europe's main sourcing venue for home textiles. Heimtextil 2026 in Frankfurt brought together about 3,000 exhibitors from 148 nations and more than 48,000 trade buyers [27]. German retailers use the fair to review new colours, fabrics and suppliers for the year ahead.
Price and product mix account for more of Germany's 5.0% CAGR for 2026 to 2036 than volume does. Trade policy may lower import costs. India and the European Union concluded negotiations on a free trade agreement in January 2026 that would remove duty on all textile lines once it enters into force [14]. Lower duties would let German retailers offer better cotton sheets at the same shelf price. Weak spending may also last longer than expected. Retailers would then keep cutting prices to clear stock, which slows revenue growth for suppliers. Hotels in Berlin, Munich and Frankfurt still provide steady replacement orders. Suppliers that serve both retail and hotel buyers can balance these two sources of demand.
United Kingdom
The United Kingdom has become one of the first markets to offer duty-free access to Indian bed linen. The UK-India trade agreement entered into force on 15 July 2026 [12]. India's Ministry of Textiles reports that the UK imports about USD 28.8 billion of textiles and clothing each year [13]. India supplies about USD 1.8 billion of that total, a 6.1% share.
Retail demand is soft but steady. The Office for National Statistics reported that retail sales volumes fell 0.4% in September 2026 but were 0.8% higher than a year earlier [28]. Household goods stores also fell on the month. Shoppers are buying carefully, so value and durability matter more than seasonal fashion.
Lower landed costs on Indian sheets support a 4.9% CAGR for the United Kingdom between 2026 and 2036. Retailers can use the savings to improve fabric quality or to hold shelf prices. Hotels also gain from cheaper imports of plain white sheets. Other exporting countries still compete for the same contracts, so any shift to Indian suppliers will be gradual. Weak household spending could still limit the benefit of lower costs. Suppliers that offer certified cotton and reliable delivery should gain share as retailers renew their contracts. Most retail programmes are renewed each season, so the duty change can show up in orders within a year.
Japan
Japan's bed linen growth is coming mainly from hotels. The Japan Tourism Agency recorded 179.9 million foreign guest nights in 2025, up 9.4% [2]. Business hotels ran at 75.3% occupancy and city hotels at 74.1%. High occupancy means more laundry cycles per sheet and more frequent replacement. Total guest nights rose only 0.3% to 661.1 million, so foreign visitors supplied most of the growth [2].
Household retail is weaker. METI reported that sales of fabrics, apparel and accessories fell 6.1% in August 2026 compared with a year earlier [30]. Household goods sales at supermarkets fell 4.9%. Nitori, a leading Japanese home furnishings retailer, reported revenue of JPY 912.2 billion for the year to March 2026, down 1.8% [31]. Its operating profit still rose 6.7%, which points to better margins on a smaller sales base.
An ageing and shrinking population holds Japan to the slowest rate in the profiled group, a 4.1% CAGR over 2026 to 2036. Visitor numbers reached about 42.7 million in 2025 [29]. Hotels and linen rental firms therefore account for a larger share of new orders than in other markets. Hotel laundry standards and short-notice delivery decide which suppliers keep these accounts. A fall in visitor numbers would reduce hotel demand quickly. Household brands can still grow by selling premium cotton and seasonal sets for summer and winter.
Who are the notable companies in the Bed Linen Market?
Welspun Living, Indo Count Industries, Trident and Williams-Sonoma show the main commercial positions in bed linen. The first three are Indian manufacturers that supply retailers around the world. Williams-Sonoma is a US retailer that sells bed linen through Pottery Barn and its other brands [23].
Indian mills compete on scale and cost. Indo Count runs 153 million metres of bed linen capacity across Kolhapur and Bhilad [17]. Welspun Living runs 108 million metres and has added US pillow production [16]. Trident earns more than half of its revenue from bed and bath linen [18]. These firms sell private-label programmes to large retailers. They also build owned and licensed brands to raise their margins.
Retailers and domestic brands compete on design and channel reach. Ingka Group, which runs IKEA stores in many markets, reported revenue of EUR 41.5 billion and a commercial focus on sleep products in its 2025 financial year [32]. Luolai Lifestyle is a major branded bedding company in China [21]. Nitori serves Japanese households through its own stores [31]. Buyers should compare fabric quality, size range and delivery reliability when they choose a supplier.
Key Developments in the Bed Linen Market
- In January 2026, Indo Count Industries began commercial production at its new North Carolina plant for pillows and quilts [17].
- On 15 June 2026, Welspun Living started pillow production in Nevada and set a target of USD 60.0 million in pillow revenue for its 2026-27 financial year [16].
Key Players in the Bed Linen Market
- Welspun Living Limited
- Indo Count Industries Limited
- Trident Limited
- Himatsingka Seide Limited
- Williams-Sonoma, Inc.
- Ingka Group (IKEA)
- Luolai Lifestyle Technology Co., Ltd.
- Nitori Holdings Co., Ltd.
Bed Linen Market Report Scope
Table 6: Bed Linen Market Report Scope
| Coverage field | Report scope |
|---|---|
| Market definition | Flat sheets, fitted sheets, pillowcases and sheet sets sold to households, hotels and institutions. Duvets, comforters and duvet covers are excluded. |
| Material | Cotton; Poly Cotton; Polyester; Microfibre; Linen; Sateen; Satin; Flannel; Denim |
| Pattern | Solid; Floral; Abstract; Geometric; Striped; Checkered; Modern; Paisley; Character; Ornament; Polka Dot |
| Size | Single; Double; Queen; King |
| Buyer groups | Households; hotels and hospitality; institutions |
| Regions covered | North America, Latin America, Western Europe, Eastern Europe, East Asia, South Asia and Pacific, Middle East and Africa |
| Profiled markets | India, ASEAN, China, United States, South Korea, Germany, United Kingdom, Japan |
| Companies covered | Welspun Living Limited; Indo Count Industries Limited; Trident Limited; Himatsingka Seide Limited; Williams-Sonoma, Inc.; Ingka Group (IKEA); Luolai Lifestyle Technology Co., Ltd.; Nitori Holdings Co., Ltd. |
| Quantitative Units | USD billion |
Source: Future Market Insights analysis of the bed linen market, 2026.
Bed Linen Market Research Methodology
The bed linen assessment draws on national trade and retail statistics, tourism data, commodity prices and company disclosures [15][22][1][4]. FMI measures annual sales value of sheets, sheet sets and pillowcases to households, hotels and institutions. Segment values are classified by material, pattern and size. Country forecasts reflect local retail demand, hotel activity and import costs over the same 2026 to 2036 period. Fibre prices, mill capacity and retail sales are reviewed as separate measures.
Bed Linen Market by Segments
Bed Linen Market segmented by Material:
- Cotton
- Poly Cotton
- Polyester
- Microfibre
- Linen
- Sateen
- Satin
- Flannel
- Denim
Bed Linen Market segmented by Pattern:
- Solid
- Floral
- Abstract
- Geometric
- Striped
- Checkered
- Modern
- Paisley
- Character
- Ornament
- Polka Dot
Bed Linen Market segmented by Size:
- Single
- Double
- Queen
- King
Bed Linen Market by Region
- North America
- United States
- Canada
- Latin America
- Brazil
- Mexico
- Argentina
- Chile
- Western Europe
- Germany
- France
- United Kingdom
- Italy
- Spain
- Benelux
- Nordics
- Eastern Europe
- Poland
- Czech Republic
- Romania
- Hungary
- East Asia
- China
- Japan
- South Korea
- South Asia and Pacific
- India
- ASEAN
- Australia and New Zealand
- Middle East and Africa
- GCC Countries
- South Africa
- Türkiye
- Israel
Research Sources and Bibliography
- [1] ASEAN Secretariat. (2026, January 29). Joint Media Statement of the 29th Meeting of ASEAN Tourism Ministers. https://asean.org/wp-content/uploads/2026/02/Adopted-JMS-29th-M-ATM.pdf
- [2] Japan Tourism Agency, Ministry of Land, Infrastructure, Transport and Tourism. (2026, July 6). Overnight Travel Statistics Survey, 2025 final values. https://www.mlit.go.jp/kankocho/news02_00090.html
- [3] General Statistics Office of Viet Nam. (2026, January 5). Press release on the socio-economic situation in the fourth quarter and 2025. https://www.nso.gov.vn/en/data-and-statistics/2026/01/press-release-social-economic-situation-in-the-fourth-quarter-and-2025/
- [4] World Bank. (2026, October 2). Commodity Price Data (The Pink Sheet), October 2026.
- [5] U.S. Department of Agriculture, Economic Research Service. (2026, October 14). Cotton and Wool Outlook: October 2026 (CWS-26j). https://www.ers.usda.gov/media/29738/cws-26j.pdf?v=96539
- [6] U.S. Department of Agriculture, Agricultural Marketing Service. (2026, October 30). Weekly Cotton Market Review, Vol. 108 No. 13. https://www.ams.usda.gov/mnreports/cnwwcmr.pdf
- [7] Press Information Bureau, Ministry of Textiles, Government of India. (2026, July 24). Trade preparedness and export competitiveness of textile sector. https://www.pib.gov.in/PressReleasePage.aspx?PRID=2288808®=48&lang=2
- [8] International Cotton Advisory Committee. (2026, September). Cotton: Review of the World Situation. https://icac.org/wp-content/uploads/2026/09/Cotton-Review-Sep-2026_v1.pdf
- [9] Supreme Court of the United States. (2026, February 20). Learning Resources, Inc. v. Trump, No. 24-1287. https://www.supremecourt.gov/opinions/25pdf/24-1287_4gcj.pdf
- [10] Press Information Bureau, Ministry of Commerce and Industry, Government of India. (2026, July 25). Final US Section 301 Measures on Forced Labour: India Placed in Lower Tariff Tier at 10%. https://www.pib.gov.in/PressReleasePage.aspx?PRID=2289348®=3&lang=1
- [11] Press Information Bureau, Ministry of Commerce and Industry, Government of India. (2026, September 28). Release on the Commerce Minister's G20 visit and India-US trade talks. https://www.pib.gov.in/PressReleseDetailm.aspx?PRID=2316127®=3&lang=1
- [12] UK Government. (2026, July 15). UK-India Trade Deal.
- [13] Press Information Bureau, Ministry of Textiles, Government of India. (2026, July 15). India-UK CETA Comes into Effect. https://static.pib.gov.in/WriteReadData/specificdocs/documents/2026/jul/doc2026715921801.pdf
- [14] Press Information Bureau, Ministry of Textiles, Government of India. (2026, January 27). India-EU Free Trade Agreement: A Transformational Trade Deal for India's Textile & Apparel Sector. https://www.pib.gov.in/PressReleasePage.aspx?PRID=2219250®=3&lang=1
- [15] Press Information Bureau, Ministry of Textiles, Government of India. (2026, April 22). Textile and apparel exports for 2025-26. https://www.pib.gov.in/PressReleasePage.aspx?PRID=2254367®=3&lang=1
- [16] Welspun Living Limited. (2026, August 13). Q1 FY27 Investor Presentation. National Stock Exchange of India. https://nsearchives.nseindia.com/corporate/WELSPUNIND_13082026162553_Reg30_Presentation13082026_signed.pdf
- [17] Indo Count Industries Limited. (2026, August 12). Q1 FY27 Investor Presentation. National Stock Exchange of India. https://nsearchives.nseindia.com/corporate/ICIL_12082026154251_InvestorPresentation.pdf
- [18] Trident Limited. (2026, July 25). Q1 FY27 Investor Presentation. National Stock Exchange of India. https://nsearchives.nseindia.com/corporate/TRIDENT_25072026141805_Investor_PPT_Q1FY2026-Final.pdf
- [19] Himatsingka Seide Limited. (2026, May 29). Q4 FY26 Press Release. National Stock Exchange of India. https://nsearchives.nseindia.com/corporate/HIMATSEIDE_29052026132816_HSL_-_Q4FY26-_Press_Release.pdf
- [20] National Bureau of Statistics of China. (2026, October 20). Total Retail Sales of Consumer Goods from January to September 2026. https://www.stats.gov.cn/english/PressRelease/202610/t20261020_1965662.html
- [21] Luolai Lifestyle Technology Co., Ltd. (2026, August 22). 2026 Half-Year Report Summary. CNINFO. https://static.cninfo.com.cn/finalpage/2026-08-22/1225490382.PDF
- [22] U.S. Census Bureau. (2026, October 15). Advance Monthly Sales for Retail and Food Services, September 2026.
- [23] Williams-Sonoma, Inc. (2026, August 26). Form 8-K, Exhibit 99.1: Second quarter 2026 results. U.S. Securities and Exchange Commission. https://www.sec.gov/Archives/edgar/data/0000719955/000071995526000203/exhibit991fy2026q2earnings.htm
- [24] Korea.net, Ministry of Culture, Sports and Tourism. (2026, September 28). Foreign visitor arrivals, January to August 2026. https://www.korea.net/NewsFocus/Society/view?articleId=300193
- [25] Ministry of Data and Statistics, Republic of Korea. (2026, October 1). Online Shopping in August 2026. https://mods.go.kr/board.es?act=view&bid=11722&list_no=447303&mainXml=Y&mid=a20101000000
- [26] Statistisches Bundesamt (Destatis). (2026, November 2). Press release No. 383: Retail turnover, September 2026. https://www.destatis.de/DE/Presse/Pressemitteilungen/2026/11/PD26_383_45212.html
- [27] Messe Frankfurt. (2026, January 16). Heimtextil 2026 final report. https://www.messefrankfurt.com/frankfurt/en/press/press-releases/2026/heimtextil-2026-final-report.html
- [28] Office for National Statistics. (2026, October 23). Retail sales, Great Britain: September 2026.
- [29] Japan National Tourism Organization. (2026, January 21). Visitor arrivals to Japan, December 2025 and full year 2025. https://www.jnto.go.jp/news/_files/20260121_1615.pdf
- [30] Ministry of Economy, Trade and Industry, Japan. (2026, September 30). Current Survey of Commerce, August 2026. https://www.meti.go.jp/statistics/tyo/syoudou/result/pdf/202608S.pdf
- [31] Nitori Holdings Co., Ltd. (2026, May). Consolidated Financial Summary for the fiscal year ended March 2026. https://www.nitorihd.co.jp/ir/items/IFRS_202603_4Q_Consolidated%20Financial%20Summary_20260513.pdf
- [32] Ingka Group. (2025, November 4). Ingka Group Annual Report Summary FY25. https://assets.site.ingka.com/ingka-com/reports/ingka-group-annual-report-summary-fy25.pdf
Table of Content
Table of Content
- Key Takeaways
- Market Size and CAGR
- Top Growth Driver
- Fastest Growing Segment
- Leading Region
- Key Companies
- Emerging Opportunities
- Executive Summary
- Global Market Outlook
- Demand-side Trends
- Supply-side Trends
- Technology Roadmap Analysis
- Analysis and Recommendations
- Analyst Perspective (What is happening? Why now? What should investors know?)
- Key Questions Answered
- How large is the market?
- What is the CAGR?
- What are key trends?
- Which region dominates?
- Who are the leaders?
Read More...
- Market Overview
- Market Coverage / Taxonomy
- Market Definition / Scope / Limitations
- Research Methodology
- Chapter Orientation
- Analytical Lens and Working Hypotheses
- Market Structure, Signals, and Trend Drivers
- Benchmarking and Cross-market Comparability
- Market Sizing, Forecasting, and Opportunity Mapping
- Research Design and Evidence Framework
- Desk Research Programme (Secondary Evidence)
- Expert Input and Fieldwork (Primary Evidence)
- Tooling, Models, and Reference Databases
- Data Engineering and Model Build
- Quality Assurance and Audit Trail
- Market Background
- Market Dynamics (Drivers, Restraints, Opportunity, Trends)
- Scenario Forecast (Optimistic, Likely, Conservative)
- Impact Analysis
- AI Impact
- Sustainability Impact
- Regulatory Impact
- Technology Impact
- Consumer / Buyer Analysis
- Purchase Drivers
- Adoption Barriers
- Buyer Journey
- Opportunity Map Analysis
- Product Life Cycle Analysis
- Supply Chain Analysis
- Investment Feasibility Matrix
- Value Chain Analysis
- PESTLE and Porter's Analysis
- Regulatory Landscape
- Regional Parent Market Outlook
- Production and Consumption Statistics
- Import and Export Statistics
- Global Market Analysis and Forecast, 2021 to 2036
- Historical Market Size Value (USD Billion) Analysis, 2021 to 2025
- Current and Future Market Size Value (USD Billion) Projections, 2026 to 2036
- Y-o-Y Growth Trend Analysis
- Absolute $ Opportunity Analysis
- Global Market Pricing Analysis, 2021 to 2036
- Global Market Analysis and Forecast, By Material, 2021 to 2036
- Introduction / Key Findings
- Historical Market Size Value (USD Billion) Analysis By Material, 2021 to 2025
- Current and Future Market Size Value (USD Billion) Analysis and Forecast By Material, 2026 to 2036
- Cotton
- Poly Cotton
- Polyester
- Microfibre
- Linen
- Sateen
- Satin
- Flannel
- Denim
- Y-o-Y Growth Trend Analysis By Material, 2021 to 2025
- Absolute $ Opportunity Analysis By Material, 2026 to 2036
- Global Market Analysis and Forecast, By Pattern, 2021 to 2036
- Introduction / Key Findings
- Historical Market Size Value (USD Billion) Analysis By Pattern, 2021 to 2025
- Current and Future Market Size Value (USD Billion) Analysis and Forecast By Pattern, 2026 to 2036
- Solid
- Floral
- Abstract
- Geometric
- Striped
- Checkered
- Modern
- Paisley
- Character
- Ornament
- Polka Dot
- Y-o-Y Growth Trend Analysis By Pattern, 2021 to 2025
- Absolute $ Opportunity Analysis By Pattern, 2026 to 2036
- Global Market Analysis and Forecast, By Size, 2021 to 2036
- Introduction / Key Findings
- Historical Market Size Value (USD Billion) Analysis By Size, 2021 to 2025
- Current and Future Market Size Value (USD Billion) Analysis and Forecast By Size, 2026 to 2036
- Single
- Double
- Queen
- King
- Y-o-Y Growth Trend Analysis By Size, 2021 to 2025
- Absolute $ Opportunity Analysis By Size, 2026 to 2036
- Global Market Analysis and Forecast, By Region, 2021 to 2036
- Introduction
- Historical Market Size Value (USD Billion) Analysis By Region, 2021 to 2025
- Current Market Size Value (USD Billion) Analysis and Forecast By Region, 2026 to 2036
- North America
- Latin America
- Western Europe
- Eastern Europe
- East Asia
- South Asia and Pacific
- Middle East and Africa
- Market Attractiveness Analysis By Region
- North America Market Analysis and Forecast, By Country, 2021 to 2036
- Historical Market Size Value (USD Billion) Trend Analysis By Market Taxonomy, 2021 to 2025
- Market Size Value (USD Billion) Forecast By Market Taxonomy, 2026 to 2036
- By Country
- United States
- Canada
- By Material
- By Pattern
- By Size
- By Country
- Market Attractiveness Analysis
- By Country
- By Material
- By Pattern
- By Size
- Key Takeaways
- Latin America Market Analysis and Forecast, By Country
- Historical Market Size Value (USD Billion) Trend Analysis By Market Taxonomy, 2021 to 2025
- Market Size Value (USD Billion) Forecast By Market Taxonomy, 2026 to 2036
- By Country
- Brazil
- Mexico
- Argentina
- Chile
- By Material
- By Pattern
- By Size
- By Country
- Market Attractiveness Analysis
- By Country
- By Material
- By Pattern
- By Size
- Key Takeaways
- Western Europe Market Analysis and Forecast, By Country
- Historical Market Size Value (USD Billion) Trend Analysis By Market Taxonomy, 2021 to 2025
- Market Size Value (USD Billion) Forecast By Market Taxonomy, 2026 to 2036
- By Country
- Germany
- France
- United Kingdom
- Italy
- Spain
- Benelux
- Nordics
- By Material
- By Pattern
- By Size
- By Country
- Market Attractiveness Analysis
- By Country
- By Material
- By Pattern
- By Size
- Key Takeaways
- Eastern Europe Market Analysis and Forecast, By Country
- Historical Market Size Value (USD Billion) Trend Analysis By Market Taxonomy, 2021 to 2025
- Market Size Value (USD Billion) Forecast By Market Taxonomy, 2026 to 2036
- By Country
- Poland
- Czech Republic
- Romania
- Hungary
- By Material
- By Pattern
- By Size
- By Country
- Market Attractiveness Analysis
- By Country
- By Material
- By Pattern
- By Size
- Key Takeaways
- East Asia Market Analysis and Forecast, By Country
- Historical Market Size Value (USD Billion) Trend Analysis By Market Taxonomy, 2021 to 2025
- Market Size Value (USD Billion) Forecast By Market Taxonomy, 2026 to 2036
- By Country
- China
- Japan
- South Korea
- By Material
- By Pattern
- By Size
- By Country
- Market Attractiveness Analysis
- By Country
- By Material
- By Pattern
- By Size
- Key Takeaways
- South Asia and Pacific Market Analysis and Forecast, By Country
- Historical Market Size Value (USD Billion) Trend Analysis By Market Taxonomy, 2021 to 2025
- Market Size Value (USD Billion) Forecast By Market Taxonomy, 2026 to 2036
- By Country
- India
- ASEAN
- Australia and New Zealand
- By Material
- By Pattern
- By Size
- By Country
- Market Attractiveness Analysis
- By Country
- By Material
- By Pattern
- By Size
- Key Takeaways
- Middle East and Africa Market Analysis and Forecast, By Country
- Historical Market Size Value (USD Billion) Trend Analysis By Market Taxonomy, 2021 to 2025
- Market Size Value (USD Billion) Forecast By Market Taxonomy, 2026 to 2036
- By Country
- GCC Countries
- South Africa
- Türkiye
- Israel
- By Material
- By Pattern
- By Size
- By Country
- Market Attractiveness Analysis
- By Country
- By Material
- By Pattern
- By Size
- Key Takeaways
- Key Countries Market Analysis
- United States
- Pricing Analysis
- Market Share Analysis, 2025
- By Material
- By Pattern
- By Size
- Canada
- Pricing Analysis
- Market Share Analysis, 2025
- By Material
- By Pattern
- By Size
- Mexico
- Pricing Analysis
- Market Share Analysis, 2025
- By Material
- By Pattern
- By Size
- Brazil
- Pricing Analysis
- Market Share Analysis, 2025
- By Material
- By Pattern
- By Size
- Chile
- Pricing Analysis
- Market Share Analysis, 2025
- By Material
- By Pattern
- By Size
- Germany
- Pricing Analysis
- Market Share Analysis, 2025
- By Material
- By Pattern
- By Size
- United Kingdom
- Pricing Analysis
- Market Share Analysis, 2025
- By Material
- By Pattern
- By Size
- Italy
- Pricing Analysis
- Market Share Analysis, 2025
- By Material
- By Pattern
- By Size
- Spain
- Pricing Analysis
- Market Share Analysis, 2025
- By Material
- By Pattern
- By Size
- France
- Pricing Analysis
- Market Share Analysis, 2025
- By Material
- By Pattern
- By Size
- India
- Pricing Analysis
- Market Share Analysis, 2025
- By Material
- By Pattern
- By Size
- ASEAN
- Pricing Analysis
- Market Share Analysis, 2025
- By Material
- By Pattern
- By Size
- Australia and New Zealand
- Pricing Analysis
- Market Share Analysis, 2025
- By Material
- By Pattern
- By Size
- China
- Pricing Analysis
- Market Share Analysis, 2025
- By Material
- By Pattern
- By Size
- Japan
- Pricing Analysis
- Market Share Analysis, 2025
- By Material
- By Pattern
- By Size
- South Korea
- Pricing Analysis
- Market Share Analysis, 2025
- By Material
- By Pattern
- By Size
- Poland
- Pricing Analysis
- Market Share Analysis, 2025
- By Material
- By Pattern
- By Size
- Hungary
- Pricing Analysis
- Market Share Analysis, 2025
- By Material
- By Pattern
- By Size
- Türkiye
- Pricing Analysis
- Market Share Analysis, 2025
- By Material
- By Pattern
- By Size
- South Africa
- Pricing Analysis
- Market Share Analysis, 2025
- By Material
- By Pattern
- By Size
- United States
- Market Structure Analysis
- Competition Dashboard
- Competition Benchmarking
- Market Share Analysis of Top Players
- By Regional
- By Material
- By Pattern
- By Size
- Emerging Startups
- Innovation Benchmarking
- Competition Analysis
- Competition Deep Dive
- Welspun Living Limited
- Overview
- Product Portfolio
- Profitability by Market Segments
- Sales Footprint
- Strategy Overview
- Marketing Strategy
- Product Strategy
- Channel Strategy
- Indo Count Industries Limited
- Trident Limited
- Williams-Sonoma, Inc.
- Luolai Lifestyle Technology Co., Ltd.
- Himatsingka Seide Limited
- Ingka Group (IKEA)
- Nitori Holdings Co., Ltd.
- Welspun Living Limited
- Case Studies
- Success Stories
- Recent Developments
- Competition Deep Dive
- Assumptions & Acronyms Used
List of Tables
- Table 1: Global Market Value (USD Billion) Forecast by Region, 2021 to 2036
- Table 2: Global Market Value (USD Billion) Forecast by Material, 2021 to 2036
- Table 3: Global Market Value (USD Billion) Forecast by Pattern, 2021 to 2036
- Table 4: Global Market Value (USD Billion) Forecast by Size, 2021 to 2036
- Table 5: North America Market Value (USD Billion) Forecast by Country, 2021 to 2036
- Table 6: North America Market Value (USD Billion) Forecast by Material, 2021 to 2036
- Table 7: North America Market Value (USD Billion) Forecast by Pattern, 2021 to 2036
- Table 8: North America Market Value (USD Billion) Forecast by Size, 2021 to 2036
- Table 9: Latin America Market Value (USD Billion) Forecast by Country, 2021 to 2036
- Table 10: Latin America Market Value (USD Billion) Forecast by Material, 2021 to 2036
- Table 11: Latin America Market Value (USD Billion) Forecast by Pattern, 2021 to 2036
- Table 12: Latin America Market Value (USD Billion) Forecast by Size, 2021 to 2036
- Table 13: Western Europe Market Value (USD Billion) Forecast by Country, 2021 to 2036
- Table 14: Western Europe Market Value (USD Billion) Forecast by Material, 2021 to 2036
- Table 15: Western Europe Market Value (USD Billion) Forecast by Pattern, 2021 to 2036
- Table 16: Western Europe Market Value (USD Billion) Forecast by Size, 2021 to 2036
- Table 17: Eastern Europe Market Value (USD Billion) Forecast by Country, 2021 to 2036
- Table 18: Eastern Europe Market Value (USD Billion) Forecast by Material, 2021 to 2036
- Table 19: Eastern Europe Market Value (USD Billion) Forecast by Pattern, 2021 to 2036
- Table 20: Eastern Europe Market Value (USD Billion) Forecast by Size, 2021 to 2036
- Table 21: East Asia Market Value (USD Billion) Forecast by Country, 2021 to 2036
- Table 22: East Asia Market Value (USD Billion) Forecast by Material, 2021 to 2036
- Table 23: East Asia Market Value (USD Billion) Forecast by Pattern, 2021 to 2036
- Table 24: East Asia Market Value (USD Billion) Forecast by Size, 2021 to 2036
- Table 25: South Asia and Pacific Market Value (USD Billion) Forecast by Country, 2021 to 2036
- Table 26: South Asia and Pacific Market Value (USD Billion) Forecast by Material, 2021 to 2036
- Table 27: South Asia and Pacific Market Value (USD Billion) Forecast by Pattern, 2021 to 2036
- Table 28: South Asia and Pacific Market Value (USD Billion) Forecast by Size, 2021 to 2036
- Table 29: Middle East and Africa Market Value (USD Billion) Forecast by Country, 2021 to 2036
- Table 30: Middle East and Africa Market Value (USD Billion) Forecast by Material, 2021 to 2036
- Table 31: Middle East and Africa Market Value (USD Billion) Forecast by Pattern, 2021 to 2036
- Table 32: Middle East and Africa Market Value (USD Billion) Forecast by Size, 2021 to 2036
List of Figures
- Figure 1: Global Market Pricing Analysis
- Figure 2: Global Market Value (USD Billion) Forecast 2021-2036
- Figure 3: Global Market Value Share and BPS Analysis by Material, 2026 and 2036
- Figure 4: Global Market Y-o-Y Growth Comparison by Material, 2026-2036
- Figure 5: Global Market Attractiveness Analysis by Material
- Figure 6: Global Market Value Share and BPS Analysis by Pattern, 2026 and 2036
- Figure 7: Global Market Y-o-Y Growth Comparison by Pattern, 2026-2036
- Figure 8: Global Market Attractiveness Analysis by Pattern
- Figure 9: Global Market Value Share and BPS Analysis by Size, 2026 and 2036
- Figure 10: Global Market Y-o-Y Growth Comparison by Size, 2026-2036
- Figure 11: Global Market Attractiveness Analysis by Size
- Figure 12: Global Market Value (USD Billion) Share and BPS Analysis by Region, 2026 and 2036
- Figure 13: Global Market Y-o-Y Growth Comparison by Region, 2026-2036
- Figure 14: Global Market Attractiveness Analysis by Region
- Figure 15: North America Market Incremental Dollar Opportunity, 2026-2036
- Figure 16: Latin America Market Incremental Dollar Opportunity, 2026-2036
- Figure 17: Western Europe Market Incremental Dollar Opportunity, 2026-2036
- Figure 18: Eastern Europe Market Incremental Dollar Opportunity, 2026-2036
- Figure 19: East Asia Market Incremental Dollar Opportunity, 2026-2036
- Figure 20: South Asia and Pacific Market Incremental Dollar Opportunity, 2026-2036
- Figure 21: Middle East and Africa Market Incremental Dollar Opportunity, 2026-2036
- Figure 22: North America Market Value Share and BPS Analysis by Country, 2026 and 2036
- Figure 23: North America Market Value Share and BPS Analysis by Material, 2026 and 2036
- Figure 24: North America Market Y-o-Y Growth Comparison by Material, 2026-2036
- Figure 25: North America Market Attractiveness Analysis by Material
- Figure 26: North America Market Value Share and BPS Analysis by Pattern, 2026 and 2036
- Figure 27: North America Market Y-o-Y Growth Comparison by Pattern, 2026-2036
- Figure 28: North America Market Attractiveness Analysis by Pattern
- Figure 29: North America Market Value Share and BPS Analysis by Size, 2026 and 2036
- Figure 30: North America Market Y-o-Y Growth Comparison by Size, 2026-2036
- Figure 31: North America Market Attractiveness Analysis by Size
- Figure 32: Latin America Market Value Share and BPS Analysis by Country, 2026 and 2036
- Figure 33: Latin America Market Value Share and BPS Analysis by Material, 2026 and 2036
- Figure 34: Latin America Market Y-o-Y Growth Comparison by Material, 2026-2036
- Figure 35: Latin America Market Attractiveness Analysis by Material
- Figure 36: Latin America Market Value Share and BPS Analysis by Pattern, 2026 and 2036
- Figure 37: Latin America Market Y-o-Y Growth Comparison by Pattern, 2026-2036
- Figure 38: Latin America Market Attractiveness Analysis by Pattern
- Figure 39: Latin America Market Value Share and BPS Analysis by Size, 2026 and 2036
- Figure 40: Latin America Market Y-o-Y Growth Comparison by Size, 2026-2036
- Figure 41: Latin America Market Attractiveness Analysis by Size
- Figure 42: Western Europe Market Value Share and BPS Analysis by Country, 2026 and 2036
- Figure 43: Western Europe Market Value Share and BPS Analysis by Material, 2026 and 2036
- Figure 44: Western Europe Market Y-o-Y Growth Comparison by Material, 2026-2036
- Figure 45: Western Europe Market Attractiveness Analysis by Material
- Figure 46: Western Europe Market Value Share and BPS Analysis by Pattern, 2026 and 2036
- Figure 47: Western Europe Market Y-o-Y Growth Comparison by Pattern, 2026-2036
- Figure 48: Western Europe Market Attractiveness Analysis by Pattern
- Figure 49: Western Europe Market Value Share and BPS Analysis by Size, 2026 and 2036
- Figure 50: Western Europe Market Y-o-Y Growth Comparison by Size, 2026-2036
- Figure 51: Western Europe Market Attractiveness Analysis by Size
- Figure 52: Eastern Europe Market Value Share and BPS Analysis by Country, 2026 and 2036
- Figure 53: Eastern Europe Market Value Share and BPS Analysis by Material, 2026 and 2036
- Figure 54: Eastern Europe Market Y-o-Y Growth Comparison by Material, 2026-2036
- Figure 55: Eastern Europe Market Attractiveness Analysis by Material
- Figure 56: Eastern Europe Market Value Share and BPS Analysis by Pattern, 2026 and 2036
- Figure 57: Eastern Europe Market Y-o-Y Growth Comparison by Pattern, 2026-2036
- Figure 58: Eastern Europe Market Attractiveness Analysis by Pattern
- Figure 59: Eastern Europe Market Value Share and BPS Analysis by Size, 2026 and 2036
- Figure 60: Eastern Europe Market Y-o-Y Growth Comparison by Size, 2026-2036
- Figure 61: Eastern Europe Market Attractiveness Analysis by Size
- Figure 62: East Asia Market Value Share and BPS Analysis by Country, 2026 and 2036
- Figure 63: East Asia Market Value Share and BPS Analysis by Material, 2026 and 2036
- Figure 64: East Asia Market Y-o-Y Growth Comparison by Material, 2026-2036
- Figure 65: East Asia Market Attractiveness Analysis by Material
- Figure 66: East Asia Market Value Share and BPS Analysis by Pattern, 2026 and 2036
- Figure 67: East Asia Market Y-o-Y Growth Comparison by Pattern, 2026-2036
- Figure 68: East Asia Market Attractiveness Analysis by Pattern
- Figure 69: East Asia Market Value Share and BPS Analysis by Size, 2026 and 2036
- Figure 70: East Asia Market Y-o-Y Growth Comparison by Size, 2026-2036
- Figure 71: East Asia Market Attractiveness Analysis by Size
- Figure 72: South Asia and Pacific Market Value Share and BPS Analysis by Country, 2026 and 2036
- Figure 73: South Asia and Pacific Market Value Share and BPS Analysis by Material, 2026 and 2036
- Figure 74: South Asia and Pacific Market Y-o-Y Growth Comparison by Material, 2026-2036
- Figure 75: South Asia and Pacific Market Attractiveness Analysis by Material
- Figure 76: South Asia and Pacific Market Value Share and BPS Analysis by Pattern, 2026 and 2036
- Figure 77: South Asia and Pacific Market Y-o-Y Growth Comparison by Pattern, 2026-2036
- Figure 78: South Asia and Pacific Market Attractiveness Analysis by Pattern
- Figure 79: South Asia and Pacific Market Value Share and BPS Analysis by Size, 2026 and 2036
- Figure 80: South Asia and Pacific Market Y-o-Y Growth Comparison by Size, 2026-2036
- Figure 81: South Asia and Pacific Market Attractiveness Analysis by Size
- Figure 82: Middle East and Africa Market Value Share and BPS Analysis by Country, 2026 and 2036
- Figure 83: Middle East and Africa Market Value Share and BPS Analysis by Material, 2026 and 2036
- Figure 84: Middle East and Africa Market Y-o-Y Growth Comparison by Material, 2026-2036
- Figure 85: Middle East and Africa Market Attractiveness Analysis by Material
- Figure 86: Middle East and Africa Market Value Share and BPS Analysis by Pattern, 2026 and 2036
- Figure 87: Middle East and Africa Market Y-o-Y Growth Comparison by Pattern, 2026-2036
- Figure 88: Middle East and Africa Market Attractiveness Analysis by Pattern
- Figure 89: Middle East and Africa Market Value Share and BPS Analysis by Size, 2026 and 2036
- Figure 90: Middle East and Africa Market Y-o-Y Growth Comparison by Size, 2026-2036
- Figure 91: Middle East and Africa Market Attractiveness Analysis by Size
- Figure 92: Global Market - Tier Structure Analysis
- Figure 93: Global Market - Company Share Analysis
Frequently Asked Questions
How big is the bed linen market in 2026?
FMI estimates the market at USD 26.0 billion in 2026, up from USD 24.6 billion in 2025. It is forecast to reach USD 44.4 billion by 2036 at a 5.5% CAGR.
Which material leads the bed linen market in 2026?
Cotton leads by material with 41.5% in 2026. All other materials together hold 58.5%.
Which pattern and size lead in 2026?
Solid designs hold 34.2% by pattern and Queen sizes hold 38.6% by size in FMI's 2026 assessment.
Which market is forecast to grow fastest through 2036?
India has the highest forecast CAGR at 6.9% during 2026 to 2036, followed by ASEAN at 6.4%. These are FMI forecasts and are not rates reported by the cited public bodies.
How do trade agreements affect bed linen sourcing?
Lower duties change the landed cost of imported sheets. The UK-India agreement that entered into force on 15 July 2026 gives zero-duty access on 1,143 Indian textile tariff lines [13].
Preview the report firsthand - request a free sample
Get SampleGet the brochure for pricing and purchase details.
Get PDF
