Biorational Pesticide Market Size and Share Forecast Outlook 2025 to 2035
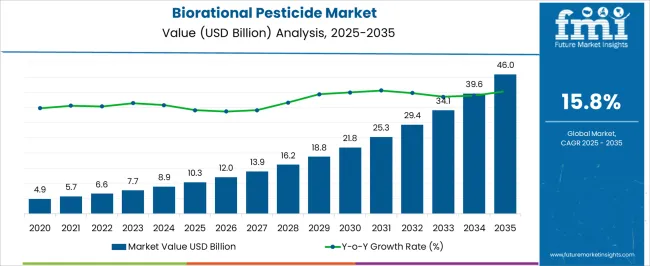
The Biorational Pesticide Market is estimated to be valued at USD 10.3 billion in 2025 and is projected to reach USD 46.0 billion by 2035, registering a compound annual growth rate (CAGR) of 15.8% over the forecast period.
Quick Stats for Biorational Pesticide Market
- Biorational Pesticide Market Industry Value (2025): USD 10.3 billion
- Biorational Pesticide Market Forecast Value (2035): USD 46.0 billion
- Biorational Pesticide Market Forecast CAGR: 15.8%
- Leading Segment in Biorational Pesticide Market in 2025: Microbial (73.4%)
- Key Growth Region in Biorational Pesticide Market: North America, Asia-Pacific, Europe
- Top Key Players in Biorational Pesticide Market: Bayer AG, Monsanto Bioag, Valent Biosciences LLC., Sumitomo Chemical, Isagro SAP, Koppert
| Metric |
Value |
| Biorational Pesticide Market Estimated Value in (2025 E) |
USD 10.3 billion |
| Biorational Pesticide Market Forecast Value in (2035 F) |
USD 46.0 billion |
| Forecast CAGR (2025 to 2035) |
15.8% |
Rationale for Segmental Growth in the Biorational Pesticide Market
The biorational pesticide market is expanding strongly, driven by the increasing need for sustainable agricultural practices, regulatory restrictions on synthetic chemicals, and rising demand for residue-free crop protection solutions. Farmers are increasingly adopting biological and naturally derived pesticides to enhance yield while maintaining environmental safety.
Market growth is further supported by strong government initiatives promoting integrated pest management and organic farming. Advancements in biotechnology and formulation techniques have improved product efficacy, ensuring wider applicability across different crops and climatic conditions.
The current scenario reflects a shift toward environmentally responsible farming inputs, supported by global consumer demand for chemical-free produce. Looking ahead, the biorational pesticide market is projected to experience sustained growth as food safety, sustainability, and ecological considerations remain central to agricultural policies.
Segmental Analysis
Insights into the Microbial Segment
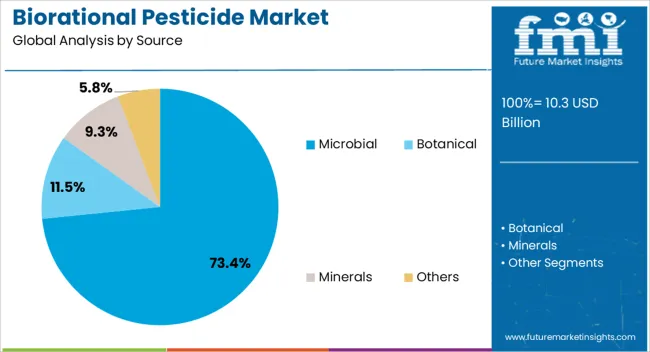
The microbial segment dominates the source category, holding approximately 73.4% share. Its leadership is attributed to its high effectiveness against a broad range of pests while maintaining ecological balance.
Microbial pesticides, derived from bacteria, fungi, and viruses, are increasingly used due to their target-specific action and minimal impact on non-target organisms. Advancements in fermentation technology and cost-efficient production methods have enhanced availability and adoption.
With rising preference for eco-friendly pest management solutions, the microbial segment is expected to maintain its significant dominance.
Insights into the Foliar Spray Segment
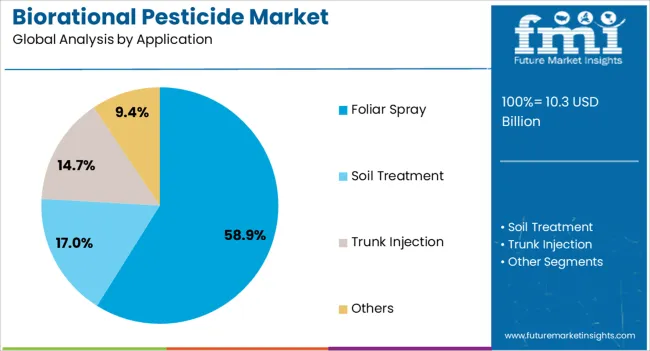
The foliar spray segment leads the application category, representing approximately 58.9% share of the biorational pesticide market. This segment’s prominence is due to the ease of application, rapid pest control effectiveness, and suitability for a wide range of crops.
Foliar sprays ensure direct contact with pests and allow for faster absorption, making them highly effective in protecting crops during critical growth stages. Farmers favor this method due to its cost efficiency and adaptability to conventional spraying equipment.
With growing adoption in both small-scale and commercial farms, the foliar spray segment is projected to retain its leadership.
Insights into the Biorational Insecticides Segment
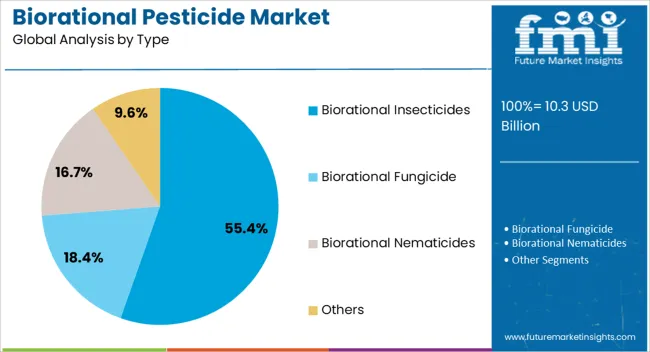
The biorational insecticides segment dominates the type category, holding approximately 55.4% share. This leadership is reinforced by their effectiveness in managing pest infestations that cause significant yield losses.
Derived from natural and biological sources, biorational insecticides provide environmentally friendly solutions with reduced resistance risks compared to synthetic options. Their broad application across fruits, vegetables, cereals, and pulses supports widespread adoption.
Increased R&D efforts to enhance efficacy and shelf stability are further strengthening their market share. With regulatory encouragement and rising global demand for sustainable crop protection, this segment is expected to continue leading.
Key Growth Drivers Shaping the Biorational Pesticide Market
Biorational Pesticide Adoption Soars as Demand for Residue-free Organic Crops Skyrockets! The primary drivers of the biorational pesticides market are the rising demand for residue-free organic crops and the increased use of conventional technologies, both of which are environmentally sustainable.
- The market is favorably impacted by consumer preferences for organic food, advancements in agricultural technology and techniques, and the need for high-quality food.
- The negative effects of chemical pesticides on soil, the environment, and water bodies have triggered the promotion of biorational pesticides in agriculture. This promotion includes programs to raise awareness and laws that provide a conducive atmosphere for the private sector to participate.
- Campaigns supporting higher biorational pesticide use at the farmer and producer levels have been shown to generate substantial sales in both developed and developing countries.
Governments Drive Biorational Pesticide Boom with Emphasis on Natural Insecticides! The government is also pushing the use of natural insecticides instead of conventional ones in several nations, driving the biorational pesticide market expansion.
- The Environmental Protection Agency (EPA) is in charge of the biopesticides market in North America. The EPA controls registration and keeps an eye on how they affect the environment and people. The majority of inert compounds on a list of low-risk substances determined by the EPA are used as co-formulants in organic pesticide formulations.
- Through multiple initiatives and programs, the Indian government has been encouraging the use of biofertilizers rather than chemical fertilizers. In addition, 46 pesticides and 4 pesticide formulations have been prohibited by the government from being imported, manufactured, or used within the nation.
- Governments with effective pesticide regulation systems are encouraged under the Code of Conduct to offer technical support to member nations of the European Union with weak regulatory frameworks.
Technological Advancements Transform Pesticides into Sustainable Solutions! Due to significant research efforts in crop protection by leading industry players, RNAi-specific genes can now be activated by biological cues.
- This invention has the potential to enhance crop quality and productivity while strengthening resilience to pests and diseases. Significant progress has been made in the development of sprayable RNAi products for biological crop protection.
- Prior to being acquired by Bayer, the EPA approved Monsanto Company's use of genetic engineering technology that uses RNA interference to control insect pests. Furthermore, Monsanto licensed two insect characteristics, including an RNAi rootworm trait, to Corteva Agriscience (USA). Growing industrial acceptance of this technology offers a new approach that is very helpful in controlling rootworm characteristics.
The introduction of RNA interference technology into biorational pesticides is a positive development. It supports crop protection methods that are ecologically harmless and have the potential to be more precise and successful in controlling pests.
Key Restraints Impacting Revenue Expansion in the Biorational Pesticide Sector
In comparison to synthetic pesticides, biological insecticides frequently show less effectiveness. This implies the possibility of requiring larger doses or more frequent sprays to get equivalent natural enemy pest control levels. Using biorational pesticides more often or at higher dosages might result in higher total pest management costs. As a result, this element could render biorational pesticides less appealing to some consumers and businesses.
It might also be difficult to manage pests using pesticides derived environmentally or organically while guaranteeing quick and effective insect eradication when utilizing biorational pesticides with swift control. Biorational pesticides frequently target certain pests or are not very efficient against different insect populations or pest species in the same location. This precision may pose a constraint.
Historical vs Future Analysis of the Biorational Pesticide Market
From 2020 to 2025, the biorational pesticide market showed staggering growth, boasting a 20.1% CAGR. Significant progress in ecologically friendly biorational insecticides in pest management techniques occurred during this period, indicating a favorable trend toward sustainable farming methods and increased farmer knowledge.
| Historical CAGR (2020 to 2025) |
20.1% |
| Forecasted CAGR (2025 to 2035) |
16.1% |
The market for biorational pesticides is expected to exhibit a lower CAGR compared to the historical period. Despite the lower CAGR projection, ongoing advancements in sustainable agricultural practices contribute to a positive outlook for the biorational pesticide sector. As the most successful biorational pesticides, the development of microbial pesticides based on Bacillus thuringiensis (Bt) is expected to revolutionize the industry. In export markets where food residue issues are significant, these kinds of biorational pesticides can be used in lieu of competitive chemical products, which are prohibited.
Emerging Trends in the Biorational Pesticide Industry
- The evolving trends in the biorational pesticide market indicate that one of the newest technologies available to shield plants from pests is nanotechnology. This technique is going to help manage the insect population and have a minimum impact on the environment when used alongside Integrated Insect Management.
- Ongoing research and development efforts are leading to the discovery of new biorational pesticide formulations that are more effective, targeted, and economically viable. Some of these include Microemulsion, Nanoemulsion, Capsulated Suspension, Nano-encapsulation, etc.
Regional Demand Outlook for Biorational Pesticides
The North America biorational pesticide market stands out as a dominant force due to its strategic blend of eco-friendly solutions, heightened awareness of sustainable practices, and a robust commitment to agricultural innovation. Europe is witnessing steady growth in demand for biorational pesticides. Burgeoning emphasis on sustainable agriculture and stringent environmental regulations support this growth. There is likely to be a historical development in the Asia Pacific biorational pesticide industry. Rising awareness of eco-friendly agricultural practices is escalating demand for sustainable pest control solutions.
| Country |
United States |
| Forecasted CAGR (2025 to 2035) |
16.2% |
| Market Size by 2035 |
USD 7.1 billion |
| Country |
United Kingdom |
| Forecasted CAGR (2025 to 2035) |
16.9% |
| Market Size by 2035 |
USD 1.5 billion |
| Country |
China |
| Forecasted CAGR (2025 to 2035) |
16.7% |
| Market Size by 2035 |
USD 6.1 billion |
| Country |
Japan |
| Forecasted CAGR (2025 to 2035) |
17.4% |
| Market Size by 2035 |
USD 4.1 billion |
| Country |
South Korea |
| Forecasted CAGR (2025 to 2035) |
17.2% |
| Market Size by 2035 |
USD 2.4 billion |
Consumer Awareness Boosts Biorational Pesticide Adoption in the United States
Demand for biorational pesticides in the United States is set to rise with an anticipated CAGR of 16.2% through 2035. Key factors influencing the pest control market include:
- Biorational insecticide demand is expected to rise in response to the growing trend of organic products. Growing consumer awareness of artificial pesticides' detrimental effects on the environment fuels the need for innovative liquid formulations, which in turn fuels market expansion.
- The primary goal of market participants operating in the United States is the introduction of new products to acquire an enormous revenue share of biorational pesticides. Terra-Sorb® Organic, a novel biostimulant concentrate approved by ECOCERT for application in organic farming, was introduced by Bioiberica. It has 20% L-alpha amino acids, which are produced by enzymatic hydrolysis, and micronutrients, which help stressed crops recover and become more resilient.
Biorational Pesticide Demand Flourishes on United Kingdom’s Organic Agriculture Trends
The United Kingdom biorational pesticide market is expected to surge at a CAGR of 16.9% through 2035. Top factors supporting the market expansion in the country include:
- The market is primarily driven by the growing consumer desire for organic products, fostering the adoption of organic agricultural techniques. Additionally, government support for biocontrol products and an increasing consumer demand for food safety and quality further contribute to the industry's momentum.
- Companies headquartered in the United Kingdom are attempting to spread overseas to increase their market share. For example, in July 2025, EcoStim, a United Kingdom-based developer and producer of natural plant biostimulants, revealed ambitions to enter the North American market by teaming up with Excel Holdings.
China's 14th Five-Year Plan Sparks Surge in Biorational Pesticide Demand
The China biorational pesticide market is forecasted to inflate at a CAGR of 16.7% through 2035. The main factors supporting the biopesticides market growth are:
- China has put in place multiple regulations to limit the application of chemical pesticides to protect food production and lessen pollution of the water and land. By 2050, the country intends to abandon chemical pesticides entirely in agriculture, provided biopesticides are successfully produced and pests are effectively managed.
- The improvement of the green agricultural standard system is emphasized in China's 14th Five-Year Plan for National Economic and Social Development. This commitment represents an eco-friendly agricultural trend that could boost China's demand for biorational pesticides.
- Given China's incredible development potential, foreign investors are attempting to provide specific products to take up a substantial portion of the market. For example, in December 2025, Yara introduced YaraAmplix, its initially developed biostimulant product, in China with the goal of maximizing agricultural productivity and quality through increased crop resilience.
Japan's Biorational Pesticide Market Booms with Ministry Support and Industry Innovation
Sales of biorational pesticides in Japan are estimated to record a CAGR of 17.4% through 2035. The primary factors bolstering the biorational pesticides market size are:
- The Ministry of Agriculture, Forestry and Fisheries (MAFF) is spearheading Japan's Organic Village effort, which seeks to dramatically raise the proportion of organic food to 25% by 2050. The purpose of this program is to strategically support organic agricultural methods, which is perhaps why the market is growing.
- Japan is also projected to witness rapid growth because of the presence of key market players like Sumitomo Chemical. Every country utilizes the biorational insecticides made by Sumitomo Chemical, which are well-known globally. Its AgroSolutions Division-Japan is committed to creating innovative biorational goods and environmentally friendly farming innovations.
- In addition to the market's top players, start-ups are becoming increasingly noticeable. Ac-Planta Inc., a start-up that creates biostimulants to help plants tolerate extreme temperatures and droughts, revealed that it earned USD 10.3 million at the second close of a pre-Series A investment deal in June 2025.
South Korea's Biorational Pesticide Market Surges on Consumer Demand
The market in South Korea is likely to exhibit a CAGR of 17.2% through 2035. Reasons supporting the growth of the biopesticides market in the country include:
- The market has grown progressively in recent years and shows potential for long-term expansion. A fascinating statistic from the Korea Rural Economic Institute (KREI) reveals that Korea’s farmers utilize the internet to locate and obtain helpful information on revolutionary biorational products.
- Customers' growing concerns about the quality and safety of food present possibilities for market players. Biostimulants are in tune with customer aspirations for sustainably produced foods with limited residue by fostering plant health and lowering the requirement for chemical inputs.
Biorational Pesticide Industry Analysis by Top Investment Segments
As far as the source is concerned, the botanical segment is likely to dominate the revenue share of biorational pesticides through 2035, registering a CAGR of 16.0%. Similarly, the foliar spray segment is expected to dominate in terms of application, with a projected CAGR of 15.7% through 2035.
| Segment |
Forecasted CAGR (2025 to 2035) |
| Botanical |
16.0% |
| Foliar Spray |
15.7% |
Botanical Pesticides Shine in the Limelight for Sustainable Agriculture
The botanical is set to take the spotlight in the market, a trend authenticated by factors such as:
- Since botanical-based pesticides are naturally occurring and produced from plants, they are ecologically friendly and biodegradable. Customers who are becoming more aware of the environmental effects of pest management techniques are likely to find this appealing.
- In general, beneficial insects and animals are less harmful to botanical pesticides than non-target creatures, which lowers the possibility of ecological damage.
- As these pesticides comply with organic agricultural methods, the botanical sector is becoming ever more significant as the demand for organic products rises.
- Botanical pesticide research and adoption are receiving incentives and assistance from governments and regulatory organizations, who are pushing for the use of sustainable and environmentally friendly alternatives.
Foliar Spray Emerges as the Go-to Option in Biorational Pesticides
Foliar spray is anticipated to lead the way, holding an impressive biorational pesticide market share. Factors supporting its sales are as follows:
- Foliar spraying is a top choice in the market because of its precision in targeting plant pests directly on leaves. Its comfort and ease of application play a key role in the adoption of biorational pesticides
- It guarantees efficient and successful pest management, in line with the fundamentals of biorational pesticides, which give priority to environmentally conscious, effective, and targeted pest management techniques.
- Reducing the influence on non-target species, the direct application of biorational pesticides by foliar spraying enables a more concentrated and efficient exploitation of these ecologically harmless treatments.
- Compared to other techniques, such as seed treatments and soil treatment trunk injection, foliar sprays use fewer pesticides, which is consistent with the rational pesticides' focus on sustainability and reducing the environmental effects.
Competitive Landscape of the Biorational Pesticide Market
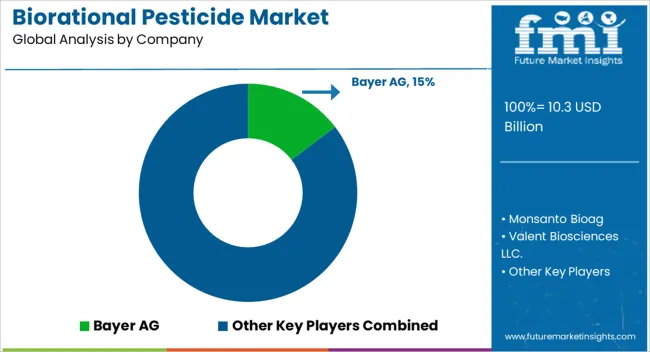
Biorational pesticide market players employ diverse strategies to gain a competitive edge. Key strategies include expanding product portfolios with eco-friendly formulations, fostering strategic partnerships for research and development collaboration, and investing in advanced technologies for enhanced production efficiency. Additionally, market players prioritize extensive market outreach, engaging in targeted marketing campaigns to raise awareness. Maintaining a competitive advantage still requires constant innovation and a dedication to environmental sustainability.
Recent Developments
- In October 2025, for the sole purpose of growing apples in Brazil, Sumitomo Chemical revealed the release of Accede (1-Aminocyclopropane-1-carboxylic acid, or ACC), a biorational solvent. Larger-caliber fruits are fostered by this innovative growth regulator, which offers the grower substantial operational benefits.
- In January 2025, the acquisition of FBSciences Holdings, Inc. by Valent BioSciences LLC. was disclosed. Through this acquisition, Sumitomo Chemical Co., Ltd., a wholly owned subsidiary of Valent BioSciences, plans to provide a cutting-edge and well-researched portfolio of integrated biorational solutions, such as crop nutrition solutions, biostimulants, and biopesticides.
- In October 2025, Valent BioSciences LLC. declared that it has started selling biostimulant products directly to its clientele in the United States. The company has since been able to service the entire United States market because of the establishment of the new operating unit in February 2025 and its current full operational state.
Leading Companies Offering Biorational Pesticide Solutions
- Bayer AG
- Monsanto Bioag
- Valent Biosciences LLC.
- Sumitomo Chemical
- Isagro SAP
- Koppert
Top Segments Studied in the Biorational Pesticide Market Report
By Source:
- Botanical
- Microbial
- Minerals
- Others
By Application:
- Foliar Spray
- Soil Treatment
- Trunk Injection
- Others
By Type:
- Biorational Insecticides
- Biorational Fungicide
- Biorational Nematicides
- Others
By Crop Type:
- Fruits & Vegetables
- Cereals & Grains
- Oilseeds & Pulses
- Others
By Region:
- North America
- Latin America
- Europe
- East Asia
- South Asia & Pacific
- Middle East & Africa (MEA)
Frequently Asked Questions
How big is the biorational pesticide market in 2025?
The global biorational pesticide market is estimated to be valued at USD 10.3 billion in 2025.
What will be the size of biorational pesticide market in 2035?
The market size for the biorational pesticide market is projected to reach USD 46.0 billion by 2035.
How much will be the biorational pesticide market growth between 2025 and 2035?
The biorational pesticide market is expected to grow at a 15.8% CAGR between 2025 and 2035.
What are the key product types in the biorational pesticide market?
The key product types in biorational pesticide market are microbial, botanical, minerals and others.
Which application segment to contribute significant share in the biorational pesticide market in 2025?
In terms of application, foliar spray segment to command 58.9% share in the biorational pesticide market in 2025.


