Pest Control Services Market
Market Insights on Pest Control Services covering sales outlook, demand forecast & up-to-date key trends
Pest Control Services Market By Product (Insecticides, Rodenticides, Other Chemicals, Mechanical), Service Type (Chemical Control Services, Mechanical Control Services, Other Pest Control Services), End-User (Residential, Commercial and Industrial, Agricultural), Application (Rodent Control, Insect Control, Wildlife Control) & Region - Forecast to 2021 - 2031
Pest Control Services Market Snapshot
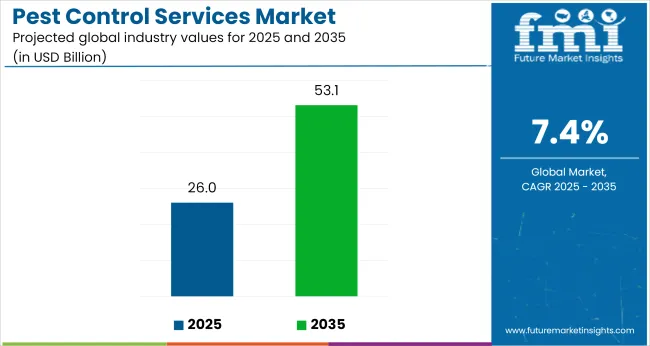
[300 Pages Report] The global pest control services market is slated to top US$ 21.9 Bn in 2021, finds Future Market Insights (FMI) in a recent analysis. Rising incidence of pest infestation in residential and commercial buildings, along with the introduction of integrated pest management (IPM) technologies are anticipated to drive sales of pest control services over the forecast period.
Considering this, FMI has forecast the market to expand at a steady 6.2% CAGR, reaching a valuation of US$ 39. 8 Bn in 2031.
With growing awareness regarding harmful effects on chemical pesticides in the agriculture sector, sales of organic pesticides are projected to rise at 7.7% CAGR through 2031, accounting for over half of the total pest control services market share.
Current year (2021) Market Value |
US$ 21.9 Bn |
Projected year (2031) Market Value |
US$ 39. 8 Bn |
CAGR% (2021-2031) |
6.20% |
Let us know your requirement to get
100% FREE customization
How The Market Progressed Till June 2022?
Market Statistics |
Details |
H1,2021 (A) |
6.9% |
H1,2022 Projected (P) |
7.0% |
H1,2022 Outlook (O) |
7.7% |
BPS Change : H1,2022 (O) - H1,2022 (P) |
(+) 70 ↑ |
BPS Change : H1,2022 (O) - H1,2021 (A) |
(+) 77 ↑ |
Future Market Insights predict a comparison and review analysis of the dynamics of the pest control services market, which is principally subjected to an array of industry factors along with a few definite influences concerning viewpoints that support industry innovation. Some new advances that have taken place in the market include days of inventory is high as compared to competitors, thereby impacting the long-term growth of the company.
According to FMI analysis, the variation between the BPS values observed in the pest control services market in H1, 2022 - Outlook over H1, 2022 Projected reflects a growth of 70 units. However, compared to H1, 2021, the market is expected to spike by 77 BPS in H1 -2022.
Key reasons for this change in growth rate are attributed to the steady uptake of the market during the first half of the forecast period, owed to increasing sales of organic pest control services can be attributed to the growing demand for pest control in residential buildings, rising pest threats due to hotter climatic conditions.
In October 2021, Rentokil North America acquired Aberdeen, N.C.-based Aberdeen Exterminating. The acquired company uses innovative technology and offers customized pest control solutions that are based around ongoing prevention, removal, and exclusion.
Despite these prospects, some likely challenges stayed for the industry, which includes challenges in gaining new customers due to the presence of several market players.
Pest Control Services Market Historic Sales Compared to 2021-2031 Forecast Outlook
Sales of pest control services generated US$ 20.7 Bn in 2020. Shifting consumer focus from traditional methods of pest control to organic methods is leading to product developments in the market, which in turn is pushing sales of pest control services.
Increasing sales of organic pest control services can be attributed to growing demand for pest control in residential buildings. Lack of regular cleaning and sanitization in old buildings triggers pest infestation. Pests bread in a dark and unclean environment, which is why pest control services are critical in building restoration and renovation.
If left unattended, pest infestation can lead to severe vector-borne diseases. As urbanization and restoration of older commercial and residential spaces continue to rise, demand for pest control services is anticipated to rise in tandem over the assessment period.
Besides this, pest infestation in crops results in poor food quality and high economic burden on farmers. Consumers are getting more aware of ingredients used in food products, which makes it imperative for the agriculture industry to maintain quality standards to attain revenue.
This is anticipated to fuel sales of pest control services in the agriculture sector. As per FMI, the agriculture segment is set to gain 50-150 bps between 2021 and 2031.
Further, owing to concerns regarding toxic chemicals in pesticides, consumers are seeking natural and do-it-yourself (DIY) methods to maintain a clean environment in their homes and gardens. In response to this, manufacturers are collaborating with biochemical and biotechnology research institutes to devise sustainable and organic pesticides to improve sales.
How will Introduction of Integrated Pest Management (IPM) Influence Pest Control Services Sales?
Advanced plant protection practices in well-managed farms result in higher yield gains. However, lack of awareness is limiting the adoption of such technologies in emerging economies.
Integrated pest management (IPM) is a novel approach that enables farmers to identify diseases and pests in crops to take necessary actions at the earliest. This results in long-term pest control that is less risky for farmers and the environment.
Using IPM can potentially help farmers in identifying the type of pests and diseases, the number of crops affected, and the type of solution required. The technology incorporates artificial intelligence (AI) that generates insights into accurate descriptions of pests and disease pressure in fields. It also involves a scouting process through which location-based tasks are shared with pest control service providers to make the treatment procedure more precise and efficient.
When it comes to pest detection in farms, timing is crucial. Utilizing effective IPM services allow farms to predict infestations before it spreads to the entire field. These systems monitor global spread of pests and diseases and issue alerts that minimize unprecedented pest attacks during growing seasons.
In addition to this, IPM programs monitor and observe plant health and pest lifecycle in real-time, facilitating communication between farmers and experts to pick adequate pest control solutions. This considerably reduces misjudgment of pest infestation, progression of outbreaks and allows farmers to coordinate plant protection operations with service providers.
Find your sweet spots for generating winning opportunities in this market.
Talk to AnalystStringent Food Regulation and Sanitization Protocols To Propel Demand for Pest Control Services
Growing concerns regarding food safety and efficient sanitization in offices, hospitals, hotels, and restaurants have resulted in stringency of regulations to maintain proper hygiene standards. Kitchens in these spaces have to comply with the mandated hygiene standards to continue operating, which in turn is driving sales of pest control services.
As per recent data from the Centers for Disease Control and Prevention (CDC), approximately 48 million people in the U.S. fall ill, 128,000 are hospitalized and 3,000 die each year due to foodborne diseases.
In response to these staggering numbers, the Food and Drug Administration (FDA) has issues the FDA Food Safety Modernization Act (FSMA) which improves food safety and prevention of foodborne illness. The FDA has finalized seven rules to implement FSMA to protect the global supply chain for both human and animal food. The rules are specifically designed to take necessary actions to prevent contamination in every space that houses a cooking facility.
Similarly, the Food Safety and Standard Authority of India (FSSAI) and Food Safety and Hygiene Regulations 2013 in England are responsible for consistently monitoring food production and maintenance of hygiene practices across agricultural, hospitality, educational, and healthcare institutes.
The implementation of such regulations is urging food manufacturing companies and other sectors to invest in effective pest control services to avoid contamination and maintain clean and hygienic manufacturing and supply practices.
Owing to these factors, FMI projects demand for pest control services to continue rising in the forthcoming years.
Will ‘Do It Yourself’ Pest Control Methods Limit Sales of Pest Control Services?
The pest control services market is brimming with new entrants and existing players. In a highly competitive environment, it is getting difficult for market players to attract new customers and retain existing ones.
Large-scale companies are offering one-step solutions that cover all aspects of pest management, along with yearly inspection services. This is making it difficult for local players to stand out among existing players.
In addition to this, some companies are offering do-it-yourself (DIY) solutions to customers. The advent of COVID-19 has also resulted in higher reliance on DIY pest control solutions due to restrictions in movement. These methods are highly effective and natural, which is impacting sales of chemical-based pest control services.
Further, as a result of high competition, initial costs of pest control services have increased. Players are trying to cover production and profit margins by increasing the initial package pricing, which is likely to have a negative impact on sales of pest control services, opines FMI.

An unified Market Research Subscription Platform, built for today’s disparate research needs.
Country-wise Insights
What will be the Demand Outlook for Pest Control Services in the U.S.?
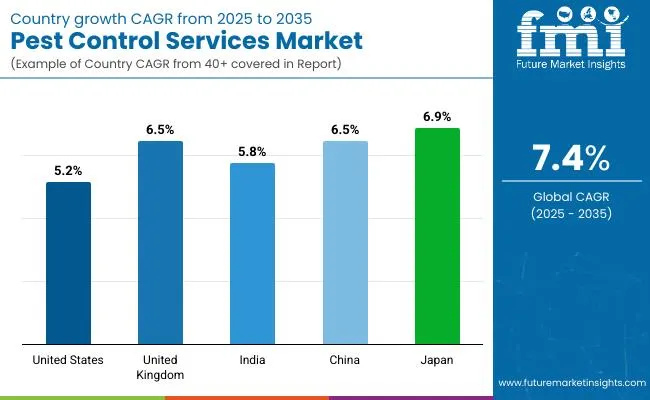
As per FMI, demand for pest control services in the U.S. is expected to surge at a healthy 5.1% CAGR. Increasing incidence of bed bug infestation and termites in residential and commercial spaces in the U.S. is propelling demand for pest control services. Pest infestation is a major problem in housing units across the country, especially in houses with structural problems and water leaks, raising public health concerns.
Data released by the United States Census Bureau shows that around 14 million of the 124 million housing units in the U.S. reported roach infestation in their homes during the last 12 months. Nearly 14.8 million reported seeing rodents.
Insects in typical homes are common, but cockroaches and rodents thrive in well-adapted human environments. The Environmental Protection Agency states that these infestations can trigger asthma, food poisoning, and other health concerns.
Additionally, rodents can spread disease to humans directly through urine, feces, or saliva, and indirectly through mites, ticks, and fleas that have fed on the infected rodent. These issues have led to significant adoption of pest control services in residential and commercial units in the U.S. and the trend is projected to continue over the forecast period.
How Will Pest Control Services Market Expand Across the U.K.?
In the U.K., pest infestations in larger cities like London are causing environmental and health burdens on the population. Every year, the country witnesses the influx of thousands of tourists that demand proper hygiene and safety in hotels, resorts, cruises, and restaurants.
This is resulting in high demand for pest control services in the hospitality sector in the U.K. Further, pest control service providers are offering monthly and yearly packages that provide timely inspection, infestation predictions, and control measures to eliminate rodents, insects, and termite infestations.
Besides this, increasing rate of rapid mosquito infestation in the suburban areas in the U.K. is spurring demand for pest control services. Driven by these factors, sales of pest control services in the U.K. are forecast to grow at a 3.9% CAGR through 2031.
Why is Demand for Pest Control Services Rising in India?
India is home to a booming agriculture industry, which in turn is driving adoption of pest control services in the country. As a result, sales of pest control services in India are slated to rise at a robust 8.4% CAGR by 2031.
Rapid urbanization in the country is resulting in development of residential projects in urban areas. Rising awareness regarding public health and government-backed initiatives for the development of clean, healthy, and safe residential complexes are chief factors pushing sales of pest control services.
Will Japan Emerge as a Lucrative Pest Control Services Market?
Rapid adoption of technologically advanced pest control solutions in Japan is anticipated to augment growth of the market over the assessment period. FMI has forecast demand for pest control services in Japan to rise at a healthy rate in the country, accounting for over 16% of the East Asia market share in 2031.
Termite infestation is increasing at a fast pace in Japan owing to the prevalence of traditional wooden houses. As a result, residents are increasing their expenditure on optimal pest control solutions in the country.
Besides this, local players in Japan are offering AI-enabled pest scanning services, allowing consumers to scan their houses and offices for possible pest infestation and take required actions in a timely manner. These developments are anticipated to bode well for new entrants and existing players operating in the pest control services market in Japan through 2031.
Category-wise Insights
Organic Pest Control Services to Remain Highly-Sought, Followed by Chemical
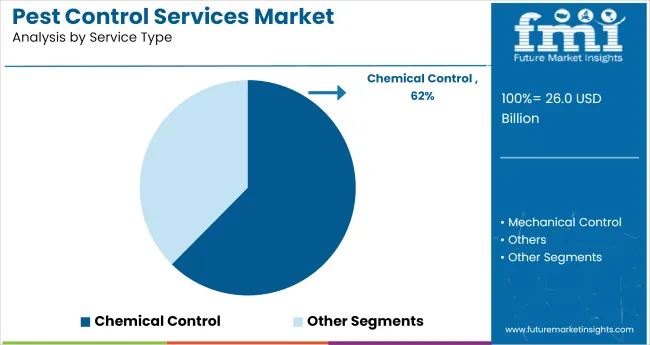
Based on service type, the chemical pest control segment is set to expand at a 5.9% CAGR. Chemical pest control services are the most commonly used and easily available services across the globe.
However, rising awareness of toxic chemicals used in insect and rodent control solutions is compelling consumers to prefer organic pest control services. In the agriculture sector, farmers are choosing organic pest control services as chemicals used in insecticides can damage crop health.
Insecticides to Remain the Most Preferred Product Type
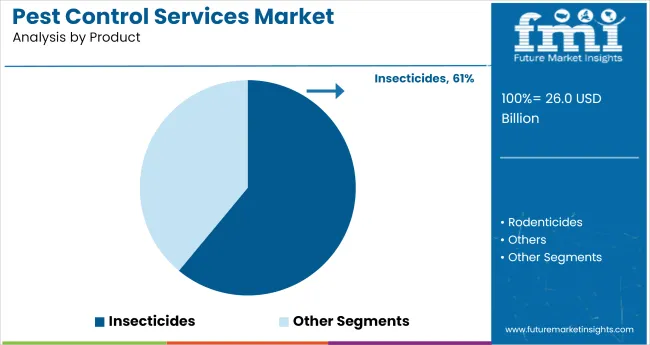
In the product category, sales of insecticides are projected to grow at 7% CAGR. Increasing adoption of insecticides in the agricultural and public health sectors, and household and commercial spaces to control roach and termite infestation will continue driving sales of pest control services over the forecast period.
Insecticides damage the central nervous system of insects, while some variants only act as growth regulators and endotoxins. These work efficiently in preventing pest infestations regardless of the area affected. Besides this, increasing preference for food quality and need for greater crop yields will continue driving demand for insecticides in the forthcoming years.
Adoption of Pest Control Services in the Residential Sector to Gain Traction
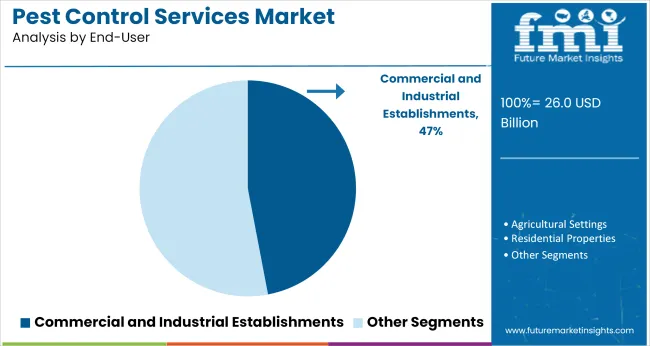
In terms of end-user, sales of pest control services in the residential sector are poised to grow at a healthy pace. The segment is anticipated to account for nearly 35% of the total market share in 2031.
The residential sector is currently experiencing a surge in demand for pest control services due to high infection rates of viral infections such as dengue and malaria. In addition to this, residents living in apartments and smaller houses are reporting cases of bed bugs and termite infestation, resulting in increasing sales of pest control services.
Dust control is also a primary preventive measure adopted by residents as excessive dust allows fleas, mosquitos, and other insects to breed rapidly. This results in breathing disorders like asthma and degrades the hygiene levels in households, affecting daily activities of residents.
Insect Control to Dominate the Application Category
The insect control segment is expected to hold over three-fourth of the total pest control services market in 2031, finds FMI.
Growing demand for effective insect control services in hospitals, hotels, resorts, and educational institutes is anticipated to fuel sales of pest control services in the forthcoming years.
In addition to the aforementioned spaces, increasing applications of insect control solutions in warehouses, storage and transport facilities and public places such as theatres, parks, gymnasiums, and swimming pools will continue driving sales of pest control services.
Competitive Landscape
Leading players operating in the pest control services market are investing in research and development to launch organic biopesticides and integrated pest control services to gain a competitive edge in the market. Apart from this, mergers, acquisitions, and collaborations are anticipated to assist players in expanding their global footprint. For instance:
- In October 2021, Rentokil North America acquired Aberdeen, N.C.-based Aberdeen Exterminating. The acquired company uses innovative technology and offers customized pest control solutions that are based around ongoing prevention, removal, and exclusion.
- In September 2021, Anticimex continued its U.S. expansion by acquiring Woodstock, Ga-based Pestban. Pestban is one of the leading pest management firms operating in Georgia, South Carolina, and North Carolina. With this acquisition, Anticimex aims to strengthen its market position across South Eastern U.S.
Scope of Report
Attribute |
Details |
Forecast Period |
2021-2031 |
Historical Data Available for |
2016-2020 |
Market Analysis |
USD Million for Value |
Key Regions Covered |
North America, Latin America, Europe, East Asia, South Asia, Oceania, and the Middle East & Africa |
Key Countries Covered |
US, Canada, Germany, U.K., France, Italy, Spain, Russia, China, Japan, South Korea, India, Thailand, Malaysia, Indonesia, Australia, New Zealand, GCC Countries, Turkey, Northern Africa, and South Africa |
Key Segments Covered |
Product Type, Service Type, End-User, Applications, and Regions |
Key Companies Profiled |
|
Report Coverage |
Market Forecast, Company Share Analysis, Competition Intelligence, DROT Analysis, Market Dynamics and Challenges, and Strategic Growth Initiatives |
Customization & Pricing |
Available upon Request |
Pest Control Services Market by Category
By Product:
- Insecticides
- Rodenticides
- Other Chemicals
- Mechanical
- Other Products
By Service Type:
- Chemical Control Services
- Organic
- Synthetic
- Mechanical Control Services
- Other Pest Control Services
By End-User:
- Residential
- Commercial and Industrial
- Agricultural
By Application:
- Rodent Control
- Insect Control
- Cockroaches
- Ants
- Bed Bugs
- Termites
- Mosquitoes
- Wasps
- Flies
- Other Insect Control
- Wildlife Control
- Birds
- Fleas
- Other Applications
By Region:
- North America
- Latin America
- Europe
- East Asia
- South Asia
- Middle East and Africa (MEA)
Frequently Asked Questions
The global pest control services market is poised to total US$ 21.9 Bn in 2021.
The global pest control services market reached a valuation of US$ 20.1 Bn in 2020.
Rapid expansion of residential spaces, along with introduction of technology-enabled solutions such as integrated pest management (IPM) will continue driving sales of pest control services.
Demand for pest control services in North America is expected to surge at a 5.2% CAGR.
Europe is projected to account for 19.5% of the global pest control services market share in 2031.
Japan and South Korea will collectively account for approximately 35.8% of the global pest control services market share.
Table of Content
1. Executive Summary
1.1. Pest Control Services Market Outlook
1.2. Summary of Key Statistics
1.3. Summary of Key Findings
1.4. Analysis and Recommendations
2. Market Overview
2.1. Market Taxonomy
2.2. Market Scope
3. Key Market Trends
3.1. Key Trends Impacting the Market
3.1.1. Increasing deployment of digital pest control
3.1.2. Technology advancement in Pest Control service
3.1.3. Rise in Restoration and Cleaning in Residential, Commercial and Agriculture
3.1.4. Pest infestations may damage a home or business
3.1.5. Increase in usage of organic pest control services
3.2. Product Innovation Trends
3.2.1. Rentokil- only company to have registered CO2 under rodent Control
3.2.2. Area of Focus- Prevention, remote monitoring and added value information management
3.2.3. Smarter use of Technology
3.2.3.1. Mobile Communication Technologies for real time technical support
3.2.3.2. Smarter Extranets – greater management information for customers
3.2.3.3. Route Optimization
4. The Massive Impact of the Crisis
4.1. Covid-19 The Situation Now
4.2. An economic and labor market shock impacting the production, consumption and investments
4.3. Impact of declining global growth on unemployment based on three scenarios, world and income groups
4.4. Countries in action: How have countries been responding?
4.5. The Economic Impact of the COVID-19 Outbreak on Developing Asia
4.6. Impact of COVID-19 on the Gross Domestic Product of Selected Economies
4.7. Current Economic Projection – GDP/GVA and probable impact
4.8. Comparison of SAARs and market recovery, comparison to 2008 financial crisis and market recovery and forecast comparison for recovery of COVID-19
4.8.1. Cluster Wise Comparison of all Key Countries (USA, Italy, Spain, Germany, France, UK, China, India, South Korea, Japan, Iran etc.)
5. The 2020 Market Size of Pest Control Services
5.1. Previous forecast
5.2. Quarter by Quarter forecast, 2020
5.3. Projected Recovery Quarter
5.4. Change In Market Size by –
5.4.1. Regions
5.4.2. Product Type
5.4.3. Service Type
5.4.4. End-User
5.4.5. Application
6. Why is Demand for Pest Control Increasing?
6.1. Increasing demand for vector control
6.2. Key End User Segments – Outperforming
6.2.1. Food Processing & Pharmaceutical
6.2.2. Offices
6.2.3. Hospitality
6.2.4. Retail
6.2.5. Healthcare & Educational
7. Maintaining the High Standards – Key Regulations & Frameworks
7.1. Legislation and regulation changes
7.2. REACH and Biocidal Products Regulation
7.3. AIB International, BRC Global Standards and large food processing and retail organizations – Food Standard Regulations
7.4. Company in-house Regulatory Team
8. Key Success Factors
8.1. Go To Market strategy
8.2. Strategic Promotional Strategies
8.3. Customer educational programs – Pest issues and basic biology of pest
9. Global Pest Control Services Market Demand (in Value or Size in US$ Mn) Analysis 2016-2020 and Forecast, 2021-2031
9.1. Historical Market Value (US$ Mn) Analysis, 2016-2020
9.2. Current and Future Market Value (US$ Mn) Projections, 2021-2031
9.2.1. Y-o-Y Growth Trend Analysis
9.2.2. Absolute $ Opportunity Analysis
10. Market Background
10.1. Macro-Economic Factors
10.1.1. Global GDP Growth Outlook
10.1.2. Global Per capita Disposable Income
10.1.3. Global Urbanization growth matrix
10.1.4. Growth in Middle Class
10.1.5. Strengthening of the housing
10.2. Forecast Factors - Relevance & Impact
10.2.1. Top Companies Historical Growth
10.2.2. Growth Climate Change
10.2.3. Health conscious consumers
10.2.4. Environmental awareness
10.2.5. Government regulations
10.2.6. Demand for organic food and crops
10.3. Value Chain
10.3.1. Service Providers
10.3.2. List of End Users
10.3.3. Profit Margin Analysis
10.4. Market Dynamics
10.4.1. Drivers
10.4.2. Restraints
10.4.3. Opportunity Analysis
11. Social Media Sentiment Analysis
11.1. Consumer perception for target products on social media platforms- Positive and Negative Mentions
11.2. Trending #hashtags
11.3. Social Media Platform Mentions (% of total mentions)
11.4. Region-wise Social Media Mentions (% of total mentions)
11.5. Trending Subject Titles
12. Global Pest Control Services Market Analysis 2016-2020 and Forecast 2021-2031, By Product Type
12.1. Introduction / Key Findings
12.2. Historical Market Size (US$ Mn) Analysis By Product Type, 2016-2020
12.3. Current and Future Market Size (US$ Mn) Analysis and Forecast By Product Type, 2021-2031
12.3.1. Insecticides
12.3.2. Rodenticides
12.3.3. Other Chemicals
12.3.4. Mechanical
12.3.5. Other Products
12.4. Market Attractiveness Analysis By Product Type
13. Global Pest Control Services Market Analysis 2016-2020 and Forecast 2021-2031, By Service Type
13.1. Introduction / Key Findings
13.2. Historical Market Size (US$ Mn) Analysis By Service Type, 2016-2020
13.3. Current and Future Market Size (US$ Mn) Analysis and Forecast By Service Type, 2021-2031
13.3.1. Chemical Control Services
13.3.1.1. Organic
13.3.1.2. Synthetic
13.3.2. Mechanical Control Services
13.3.3. Other Pest Control Services
13.4. Market Attractiveness Analysis By Service Type
14. Global Pest Control Services Market Analysis 2016-2020 and Forecast 2021-2031, By End-User
14.1. Introduction / Key Findings
14.2. Historical Market Size (US$ Mn) Analysis By End-User, 2016-2020
14.3. Current and Future Market Size (US$ Mn) Analysis and Forecast By End-User, 2021-2031
14.3.1. Commercial
14.3.2. Residential
14.3.3. Agricultural
14.4. Market Attractiveness Analysis By End-User
15. Global Pest Control Services Market Analysis 2016-2020 and Forecast 2021-2031, by Application
15.1. Introduction / Key Findings
15.2. Historical Market Size (US$ Mn) Analysis By Application, 2016-2020
15.3. Current and Future Market Size (US$ Mn) Analysis and Forecast By Application, 2021-2031
15.3.1. Rodent Control
15.3.2. Insect Control
15.3.2.1. Cockroaches
15.3.2.2. Ants
15.3.2.3. Bed bugs
15.3.2.4. Termites
15.3.2.5. Mosquitoes
15.3.2.6. Wasps
15.3.2.7. Flies
15.3.2.8. Other Insect Control
15.3.3. Wildlife Control
15.3.3.1. Birds
15.3.3.2. Fleas
15.3.4. Other Applications
15.4. Market Attractiveness Analysis By Application
16. Global Pest Control Services Market Analysis 2016-2020 and Forecast 2021-2031, by Region
16.1. Introduction / Key Findings
16.2. Historical Market Size (US$ Mn) Analysis By Region, 2016-2020
16.3. Current and Future Market Size (US$ Mn) Analysis and Forecast By Region, 2021-2031
16.3.1. North America
16.3.2. Latin America
16.3.3. Europe
16.3.4. South Asia
16.3.5. East Asia
16.3.6. Oceania
16.3.7. Middle East and Africa (MEA)
16.4. Market Attractiveness Analysis By Region
17. North America Pest Control Services Market Analysis 2016-2020 and Forecast 2021-2031
17.1. Introduction / Key Findings
17.2. Historical Market Size (US$ Mn)Trend Analysis By Market Taxonomy, 2016-2020
17.3. Market Size (US$ Mn) Forecast By Market Taxonomy, 2021-2031
17.3.1. By Country
17.3.1.1. U.S.
17.3.1.2. Canada
17.3.2. By Product Type
17.3.3. By Service Type
17.3.4. By End-User
17.3.5. By Application
17.4. Market Attractiveness Analysis
17.4.1. By Country
17.4.2. By Product Type
17.4.3. By Service Type
17.4.4. By End-User
17.4.5. By Application
17.5. Market Trends
17.6. Drivers and Restraints - Impact Analysis
18. Latin America Pest Control Services Market Analysis 2016-2020 and Forecast 2021-2031
18.1. Introduction / Key Findings
18.2. Historical Market Size (US$ Mn)Trend Analysis By Market Taxonomy, 2016-2020
18.3. Market Size (US$ Mn) Forecast By Market Taxonomy, 2021-2031
18.3.1. By Country
18.3.1.1. Brazil
18.3.1.2. Mexico
18.3.1.3. Rest of Latin America
18.3.2. By Product Type
18.3.3. By Service Type
18.3.4. By End-User
18.3.5. By Application
18.4. Market Attractiveness Analysis
18.4.1. By Country
18.4.2. By Product Type
18.4.3. By Service Type
18.4.4. By End-User
18.4.5. By Application
18.5. Market Trends
18.6. Drivers and Restraints - Impact Analysis
19. Europe Pest Control Services Market Analysis 2016-2020 and Forecast 2021-2031
19.1. Introduction / Key Findings
19.2. Historical Market Size (US$ Mn)Trend Analysis By Market Taxonomy, 2016-2020
19.3. Market Size (US$ Mn) Forecast By Market Taxonomy, 2021-2031
19.3.1. By Country
19.3.1.1. Germany
19.3.1.2. France
19.3.1.3. UK
19.3.1.4. Spain
19.3.1.5. Italy
19.3.1.6. BENELUX
19.3.1.7. Russia
19.3.1.8. Poland
19.3.1.9. Nordic
19.3.1.10. Rest of Europe
19.3.2. By Product Type
19.3.3. By Service Type
19.3.4. By End-User
19.3.5. By Application
19.4. Market Attractiveness Analysis
19.4.1. By Country
19.4.2. By Product Type
19.4.3. By Service Type
19.4.4. By End-User
19.4.5. By Application
19.5. Market Trends
19.6. Drivers and Restraints - Impact Analysis
20. East Asia Pest Control Services Market Analysis 2016-2020 and Forecast 2021-2031
20.1. Introduction / Key Findings
20.2. Historical Market Size (US$ Mn)Trend Analysis By Market Taxonomy, 2016-2020
20.3. Market Size (US$ Mn) Forecast By Market Taxonomy, 2021-2031
20.3.1. By Country
20.3.1.1. China
20.3.1.2. Japan
20.3.1.3. South Korea
20.3.2. By Product Type
20.3.3. By Service Type
20.3.4. By End-User
20.3.5. By Application
20.4. Market Attractiveness Analysis
20.4.1. By Country
20.4.2. By Product Type
20.4.3. By Service Type
20.4.4. By End-User
20.4.5. By Application
20.5. Market Trends
20.6. Drivers and Restraints - Impact Analysis
21. South Asia Pest Control Services Market Analysis 2016-2020 and Forecast 2021-2031
21.1. Introduction / Key Findings
21.2. Historical Market Size (US$ Mn)Trend Analysis By Market Taxonomy, 2016-2020
21.3. Market Size (US$ Mn) Forecast By Market Taxonomy, 2021-2031
21.3.1. By Country
21.3.1.1. India
21.3.1.2. Thailand
21.3.1.3. Indonesia
21.3.1.4. Malaysia
21.3.1.5. Rest of South Asia
21.3.2. By Product Type
21.3.3. By Service Type
21.3.4. By End-User
21.3.5. By Application
21.4. Market Attractiveness Analysis
21.4.1. By Country
21.4.2. By Product Type
21.4.3. By Service Type
21.4.4. By End-User
21.4.5. By Application
21.5. Market Trends
21.6. Drivers and Restraints - Impact Analysis
22. Oceania Pest Control Services Market Analysis 2016-2020 and Forecast 2021-2031
22.1. Introduction / Key Findings
22.2. Historical Market Size (US$ Mn)Trend Analysis By Market Taxonomy, 2016-2020
22.3. Market Size (US$ Mn) Forecast By Market Taxonomy, 2021-2031
22.3.1. By Country
22.3.1.1. Australia
22.3.1.2. New Zealand
22.3.2. By Product Type
22.3.3. By Service Type
22.3.4. By End-User
22.3.5. By Application
22.4. Market Attractiveness Analysis
22.4.1. By Country
22.4.2. By Product Type
22.4.3. By Service Type
22.4.4. By End-User
22.4.5. By Application
22.5. Market Trends
22.6. Drivers and Restraints - Impact Analysis
23. Middle East and Africa Pest Control Services Market Analysis 2016-2020 and Forecast 2021-2031
23.1. Introduction / Key Findings
23.2. Historical Market Size (US$ Mn)Trend Analysis By Market Taxonomy, 2016-2020
23.3. Market Size (US$ Mn) Forecast By Market Taxonomy, 2021-2031
23.3.1. By Country
23.3.1.1. GCC Countries
23.3.1.2. Turkey
23.3.1.3. Northern Africa
23.3.1.4. South Africa
23.3.1.5. Rest of Middle East and Africa
23.3.2. By Product Type
23.3.3. By Service Type
23.3.4. By End-User
23.3.5. By Application
23.4. Market Attractiveness Analysis
23.4.1. By Country
23.4.2. By Product Type
23.4.3. By Service Type
23.4.4. By End-User
23.4.5. By Application
23.5. Market Trends
23.6. Drivers and Restraints - Impact Analysis
24. Market Structure Analysis
24.1. Market Analysis by Tier of Companies (Pest Control Services)
24.2. Market Concentration
24.3. Market Share Analysis of Top Players
24.4. Market Presence Analysis
24.4.1. By Regional Foot Print of Players
24.4.2. Channel Foot Print by Players
25. Competition Analysis
25.1. Competition Dashboard
25.2. Competition Benchmarking
25.3. Competition Deep Dive
25.3.1. Terminix International Company, L.P.
25.3.1.1. Overview
25.3.1.2. Product Portfolio
25.3.1.3. Profitability by Market Segments (Product/Channel/Application)
25.3.1.4. Sales Footprint
25.3.1.5. Strategy Overview
25.3.1.5.1. Marketing Strategy
25.3.1.5.2. Product Strategy
25.3.1.5.3. Channel Strategy
25.3.2. Rollins Inc.
25.3.2.1. Overview
25.3.2.2. Product Portfolio
25.3.2.3. Profitability by Market Segments (Product/Channel/Application)
25.3.2.4. Sales Footprint
25.3.2.5. Strategy Overview
25.3.2.5.1. Marketing Strategy
25.3.2.5.2. Product Strategy
25.3.2.5.3. Channel Strategy
25.3.3. Rentokil Initial plc
25.3.3.1. Overview
25.3.3.2. Product Portfolio
25.3.3.3. Profitability by Market Segments (Product/Channel/Application)
25.3.3.4. Sales Footprint
25.3.3.5. Strategy Overview
25.3.3.5.1. Marketing Strategy
25.3.3.5.2. Product Strategy
25.3.3.5.3. Channel Strategy
25.3.4. Ecolab Inc.
25.3.4.1. Overview
25.3.4.2. Product Portfolio
25.3.4.3. Profitability by Market Segments (Product/Channel/Application)
25.3.4.4. Sales Footprint
25.3.4.5. Strategy Overview
25.3.4.5.1. Marketing Strategy
25.3.4.5.2. Product Strategy
25.3.4.5.3. Channel Strategy
25.3.5. Massey Services Inc.
25.3.5.1. Overview
25.3.5.2. Product Portfolio
25.3.5.3. Profitability by Market Segments (Product/Channel/Application)
25.3.5.4. Sales Footprint
25.3.5.5. Strategy Overview
25.3.5.5.1. Marketing Strategy
25.3.5.5.2. Product Strategy
25.3.5.5.3. Channel Strategy
25.3.6. Arrow Exterminators
25.3.6.1. Overview
25.3.6.2. Product Portfolio
25.3.6.3. Profitability by Market Segments (Product/Channel/Application)
25.3.6.4. Sales Footprint
25.3.6.5. Strategy Overview
25.3.6.5.1. Marketing Strategy
25.3.6.5.2. Product Strategy
25.3.6.5.3. Channel Strategy
25.3.7. Anticimex
25.3.7.1. Overview
25.3.7.2. Product Portfolio
25.3.7.3. Profitability by Market Segments (Product/Channel/Application)
25.3.7.4. Sales Footprint
25.3.7.5. Strategy Overview
25.3.7.5.1. Marketing Strategy
25.3.7.5.2. Product Strategy
25.3.7.5.3. Channel Strategy
25.3.8. Cook's Pest Control Inc.
25.3.8.1. Overview
25.3.8.2. Product Portfolio
25.3.8.3. Profitability by Market Segments (Product/Channel/Application)
25.3.8.4. Sales Footprint
25.3.8.5. Strategy Overview
25.3.8.5.1. Marketing Strategy
25.3.8.5.2. Product Strategy
25.3.8.5.3. Channel Strategy
25.3.9. Aptive Environmental LLC
25.3.9.1. Overview
25.3.9.2. Product Portfolio
25.3.9.3. Profitability by Market Segments (Product/Channel/Application)
25.3.9.4. Sales Footprint
25.3.9.5. Strategy Overview
25.3.9.5.1. Marketing Strategy
25.3.9.5.2. Product Strategy
25.3.9.5.3. Channel Strategy
25.3.10. Truly Nolen of America Inc.
25.3.10.1. Overview
25.3.10.2. Product Portfolio
25.3.10.3. Profitability by Market Segments (Product/Channel/Application)
25.3.10.4. Sales Footprint
25.3.10.5. Strategy Overview
25.3.10.5.1. Marketing Strategy
25.3.10.5.2. Product Strategy
25.3.10.5.3. Channel Strategy
25.3.11. ABC Home & Commercial Services
25.3.11.1. Overview
25.3.11.2. Product Portfolio
25.3.11.3. Profitability by Market Segments (Product/Channel/Application)
25.3.11.4. Sales Footprint
25.3.11.5. Strategy Overview
25.3.11.5.1. Marketing Strategy
25.3.11.5.2. Product Strategy
25.3.11.5.3. Channel Strategy
25.3.12. Green Pest Solutions
25.3.12.1. Overview
25.3.12.2. Product Portfolio
25.3.12.3. Profitability by Market Segments (Product/Channel/Application)
25.3.12.4. Sales Footprint
25.3.12.5. Strategy Overview
25.3.12.5.1. Marketing Strategy
25.3.12.5.2. Product Strategy
25.3.12.5.3. Channel Strategy
25.3.13. Apex Pest Control Inc.
25.3.13.1. Overview
25.3.13.2. Product Portfolio
25.3.13.3. Profitability by Market Segments (Product/Channel/Application)
25.3.13.4. Sales Footprint
25.3.13.5. Strategy Overview
25.3.13.5.1. Marketing Strategy
25.3.13.5.2. Product Strategy
25.3.13.5.3. Channel Strategy
25.3.14. Animal Pest Management Services Inc.
25.3.14.1. Overview
25.3.14.2. Product Portfolio
25.3.14.3. Profitability by Market Segments (Product/Channel/Application)
25.3.14.4. Sales Footprint
25.3.14.5. Strategy Overview
25.3.14.5.1. Marketing Strategy
25.3.14.5.2. Product Strategy
25.3.14.5.3. Channel Strategy
25.3.15. Accurate Pest Control Inc.
25.3.15.1. Overview
25.3.15.2. Product Portfolio
25.3.15.3. Profitability by Market Segments (Product/Channel/Application)
25.3.15.4. Sales Footprint
25.3.15.5. Strategy Overview
25.3.15.5.1. Marketing Strategy
25.3.15.5.2. Product Strategy
25.3.15.5.3. Channel Strategy
25.3.16. Lloyd Pest Control
25.3.16.1. Overview
25.3.16.2. Product Portfolio
25.3.16.3. Profitability by Market Segments (Product/Channel/Application)
25.3.16.4. Sales Footprint
25.3.16.5. Strategy Overview
25.3.16.5.1. Marketing Strategy
25.3.16.5.2. Product Strategy
25.3.16.5.3. Channel Strategy
25.3.17. Dodson Pest Control
25.3.17.1. Overview
25.3.17.2. Product Portfolio
25.3.17.3. Profitability by Market Segments (Product/Channel/Application)
25.3.17.4. Sales Footprint
25.3.17.5. Strategy Overview
25.3.17.5.1. Marketing Strategy
25.3.17.5.2. Product Strategy
25.3.17.5.3. Channel Strategy
25.3.18. Environmental Pest Service LLC
25.3.18.1. Overview
25.3.18.2. Product Portfolio
25.3.18.3. Profitability by Market Segments (Product/Channel/Application)
25.3.18.4. Sales Footprint
25.3.18.5. Strategy Overview
25.3.18.5.1. Marketing Strategy
25.3.18.5.2. Product Strategy
25.3.18.5.3. Channel Strategy
25.3.19. Florida Pest Control & Chemical
25.3.19.1. Overview
25.3.19.2. Product Portfolio
25.3.19.3. Profitability by Market Segments (Product/Channel/Application)
25.3.19.4. Sales Footprint
25.3.19.5. Strategy Overview
25.3.19.5.1. Marketing Strategy
25.3.19.5.2. Product Strategy
25.3.19.5.3. Channel Strategy
25.3.20. Green Earth Pest Control LLC
25.3.20.1. Overview
25.3.20.2. Product Portfolio
25.3.20.3. Profitability by Market Segments (Product/Channel/Application)
25.3.20.4. Sales Footprint
25.3.20.5. Strategy Overview
25.3.20.5.1. Marketing Strategy
25.3.20.5.2. Product Strategy
25.3.20.5.3. Channel Strategy
25.3.21. Home Paramount Pest Control LLC
25.3.21.1. Overview
25.3.21.2. Product Portfolio
25.3.21.3. Profitability by Market Segments (Product/Channel/Application)
25.3.21.4. Sales Footprint
25.3.21.5. Strategy Overview
25.3.21.5.1. Marketing Strategy
25.3.21.5.2. Product Strategy
25.3.21.5.3. Channel Strategy
25.3.22. Hulett Environmental Services
25.3.22.1. Overview
25.3.22.2. Product Portfolio
25.3.22.3. Profitability by Market Segments (Product/Channel/Application)
25.3.22.4. Sales Footprint
25.3.22.5. Strategy Overview
25.3.22.5.1. Marketing Strategy
25.3.22.5.2. Product Strategy
25.3.22.5.3. Channel Strategy
25.3.23. Plunkett’s Pest Control
25.3.23.1. Overview
25.3.23.2. Product Portfolio
25.3.23.3. Profitability by Market Segments (Product/Channel/Application)
25.3.23.4. Sales Footprint
25.3.23.5. Strategy Overview
25.3.23.5.1. Marketing Strategy
25.3.23.5.2. Product Strategy
25.3.23.5.3. Channel Strategy
25.3.24. Senske Inc.
25.3.24.1. Overview
25.3.24.2. Product Portfolio
25.3.24.3. Profitability by Market Segments (Product/Channel/Application)
25.3.24.4. Sales Footprint
25.3.24.5. Strategy Overview
25.3.24.5.1. Marketing Strategy
25.3.24.5.2. Product Strategy
25.3.24.5.3. Channel Strategy
25.3.25. Others (As Per Request)
25.3.25.1. Overview
25.3.25.2. Product Portfolio
25.3.25.3. Profitability by Market Segments (Product/Channel/Application)
25.3.25.4. Sales Footprint
25.3.25.5. Strategy Overview
25.3.25.5.1. Marketing Strategy
25.3.25.5.2. Product Strategy
25.3.25.5.3. Channel Strategy
26. Assumptions and Acronyms Used
27. Research Methodology
Let us know your requirement to get
100% FREE customization
List of Tables
Table 1: Global Pest Control Services Market Value (US$ Mn) Forecast, By Product Type, 2016-2031
Table 2: Global Pest Control Services Market Value (US$ Mn) Forecast, By Service Type, 2016-2031
Table 3: Global Pest Control Services Market Value (US$ Mn) Forecast, By End-User, 2016-2031
Table 4: Global Pest Control Services Market Value (US$ Mn) Forecast, By Application, 2016-2031
Table 5: Global Pest Control Services Market Value (US$ Mn) Forecast, By Region, 2016-2031
Table 6: North America Pest Control Services Market Value (US$ Mn) Forecast, By Country, 2016-2031
Table 7: North America Pest Control Services Market Value (US$ Mn) Forecast, By Product Type, 2016-2031
Table 8: North America Pest Control Services Market Value (US$ Mn) Forecast, By Service Type, 2016-2031
Table 9: North America Pest Control Services Market Value (US$ Mn) Forecast, By End-User, 2016-2031
Table 10: North America Pest Control Services Market Value (US$ Mn) Forecast, By Application, 2016-2031
Table 11: Latin America Pest Control Services Market Value (US$ Mn) Forecast, By Country, 2016-2031
Table 12: Latin America Pest Control Services Market Value (US$ Mn) Forecast, By Product Type, 2016-2031
Table 13: Latin America Pest Control Services Market Value (US$ Mn) Forecast, By Service Type, 2016-2031
Table 14: Latin America Pest Control Services Market Value (US$ Mn) Forecast, By End-User, 2016-2031
Table 15: Latin America Pest Control Services Market Value (US$ Mn) Forecast, By Application, 2016-2031
Table 16: Europe Pest Control Services Market Value (US$ Mn) Forecast, By Country, 2016-2031
Table 17: Europe Pest Control Services Market Value (US$ Mn) Forecast, By Product Type, 2016-2031
Table 18: Europe Pest Control Services Market Value (US$ Mn) Forecast, By Service Type, 2016-2031
Table 19: Europe Pest Control Services Market Value (US$ Mn) Forecast, By End-User, 2016-2031
Table 20: Europe Pest Control Services Market Value (US$ Mn) Forecast, By Application, 2016-2031
Table 21: East Asia Pest Control Services Market Value (US$ Mn) Forecast, By Country, 2016-2031
Table 22: East Asia Pest Control Services Market Value (US$ Mn) Forecast, By Product Type, 2016-2031
Table 23: East Asia Pest Control Services Market Value (US$ Mn) Forecast, By Service Type, 2016-2031
Table 24: East Asia Pest Control Services Market Value (US$ Mn) Forecast, By End-User, 2016-2031
Table 25: East Asia Pest Control Services Market Value (US$ Mn) Forecast, By Application, 2016-2031
Table 26: South Asia Pest Control Services Market Value (US$ Mn) Forecast, By Country, 2016-2031
Table 27: South Asia Pest Control Services Market Value (US$ Mn) Forecast, By Product Type, 2016-2031
Table 28: South Asia Pest Control Services Market Value (US$ Mn) Forecast, By Service Type, 2016-2031
Table 29: South Asia Pest Control Services Market Value (US$ Mn) Forecast, By End-User, 2016-2031
Table 30: South Asia Pest Control Services Market Value (US$ Mn) Forecast, By Application, 2016-2031
Table 31: Oceania Pest Control Services Market Value (US$ Mn) Forecast, By Country, 2016-2031
Table 32: Oceania Pest Control Services Market Value (US$ Mn) Forecast, By Product Type, 2016-2031
Table 33: Oceania Pest Control Services Market Value (US$ Mn) Forecast, By Service Type, 2016-2031
Table 34: Oceania Pest Control Services Market Value (US$ Mn) Forecast, By End-User, 2016-2031
Table 35: Oceania Pest Control Services Market Value (US$ Mn) Forecast, By Application, 2016-2031
Table 36: MEA Pest Control Services Market Value (US$ Mn) Forecast, By Country, 2016-2031
Table 37: MEA Pest Control Services Market Value (US$ Mn) Forecast, By Product Type, 2016-2031
Table 38: MEA Pest Control Services Market Value (US$ Mn) Forecast, By Service Type, 2016-2031
Table 39: MEA Pest Control Services Market Value (US$ Mn) Forecast, By End-User, 2016-2031
Table 40: MEA Pest Control Services Market Value (US$ Mn) Forecast, By Application, 2016-2031
Find your sweet spots for generating winning opportunities in this market.
Talk to AnalystList of Charts
Figure 01: Global Pest Control Services Market Value (US$ Mn), 2016-2020
Figure 02: Global Pest Control Services Market Absolute $ Opportunity Value (US$ Mn), 2021-2031
Figure 03: Global Pest Control Services Market Value (US$ Mn) Forecast, 2021-2031
Figure 04: Global Pest Control Services Market Share and BPS Analysis by Product Type, 2021 & 2031
Figure 05: Global Pest Control Services Market Y-o-Y Growth (%) Projections by Product Type, 2021-2031
Figure 06: Global Pest Control Services Market Attractiveness by Product Type, 2021-2031
Figure 07: Global Pest Control Services Market Share and BPS Analysis by Service Type, 2021 & 2031
Figure 08: Global Pest Control Services Market Y-o-Y Growth (%) Projections by Service Type, 2021-2031
Figure 09: Global Pest Control Services Market Attractiveness by Service Type, 2021-2031
Figure 10: Global Pest Control Services Market Share and BPS Analysis by End-User, 2021 & 2031
Figure 11: Global Pest Control Services Market Y-o-Y Growth (%) Projections by End-User, 2021-2031
Figure 12: Global Pest Control Services Market Attractiveness by End-User, 2021-2031
Figure 13: Global Pest Control Services Market Share and BPS Analysis by Application, 2021 & 2031
Figure 14: Global Pest Control Services Market Y-o-Y Growth (%) Projections by Application, 2021-2031
Figure 15: Global Pest Control Services Market Attractiveness by Application, 2021-2031
Figure 16: Global Pest Control Services Market Share and BPS Analysis by Region, 2021 & 2031
Figure 17: Global Pest Control Services Market Y-o-Y Growth (%) Projections by Region, 2021-2031
Figure 18: Global Pest Control Services Market Attractiveness by Region, 2021-2031
Figure 19: North America Pest Control Services Market Share and BPS Analysis by Country, 2021 & 2031
Figure 20: North America Pest Control Services Market Y-o-Y Growth (%) Projections by Country, 2021-2031
Figure 21: North America Pest Control Services Market Attractiveness by Country, 2021-2031
Figure 22: North America Pest Control Services Market Share and BPS Analysis by Product Type, 2021 & 2031
Figure 23: North America Pest Control Services Market Y-o-Y Growth (%) Projections by Product Type, 2021-2031
Figure 24: North America Pest Control Services Market Attractiveness by Product Type, 2021-2031
Figure 25: North America Pest Control Services Market Share and BPS Analysis by Service Type, 2021 & 2031
Figure 26: North America Pest Control Services Market Y-o-Y Growth (%) Projections by Service Type, 2021-2031
Figure 27: North America Pest Control Services Market Attractiveness by Service Type, 2021-2031
Figure 28: North America Pest Control Services Market Share and BPS Analysis by End-User, 2021 & 2031
Figure 29: North America Pest Control Services Market Y-o-Y Growth (%) Projections by End-User, 2021-2031
Figure 30: North America Pest Control Services Market Attractiveness by End-User, 2021-2031
Figure 31: North America Pest Control Services Market Share and BPS Analysis by Application, 2021 & 2031
Figure 32: North America Pest Control Services Market Y-o-Y Growth (%) Projections by Application, 2021-2031
Figure 33: North America Pest Control Services Market Attractiveness by Application, 2021-2031
Figure 34: Latin America Pest Control Services Market Share and BPS Analysis by Country, 2021 & 2031
Figure 35: Latin America Pest Control Services Market Y-o-Y Growth (%) Projections by Country, 2021-2031
Figure 36: Latin America Pest Control Services Market Attractiveness by Country, 2021-2031
Figure 37: Latin America Pest Control Services Market Share and BPS Analysis by Product Type, 2021 & 2031
Figure 38: Latin America Pest Control Services Market Y-o-Y Growth (%) Projections by Product Type, 2021-2031
Figure 39: Latin America Pest Control Services Market Attractiveness by Product Type, 2021-2031
Figure 40: Latin America Pest Control Services Market Share and BPS Analysis by Service Type, 2021 & 2031
Figure 41: Latin America Pest Control Services Market Y-o-Y Growth (%) Projections by Service Type, 2021-2031
Figure 42: Latin America Pest Control Services Market Attractiveness by Service Type, 2021-2031
Figure 43: Latin America Pest Control Services Market Share and BPS Analysis by End-User, 2021 & 2031
Figure 44: Latin America Pest Control Services Market Y-o-Y Growth (%) Projections by End-User, 2021-2031
Figure 45: Latin America Pest Control Services Market Attractiveness by End-User, 2021-2031
Figure 46: Latin America Pest Control Services Market Share and BPS Analysis by Application, 2021 & 2031
Figure 47: Latin America Pest Control Services Market Y-o-Y Growth (%) Projections by Application, 2021-2031
Figure 48: Latin America Pest Control Services Market Attractiveness by Application, 2021-2031
Figure 49: Europe Pest Control Services Market Share and BPS Analysis by Country, 2021 & 2031
Figure 50: Europe Pest Control Services Market Y-o-Y Growth (%) Projections by Country, 2021-2031
Figure 51: Europe Pest Control Services Market Attractiveness by Country, 2021-2031
Figure 52: Europe Pest Control Services Market Share and BPS Analysis by Product Type, 2021 & 2031
Figure 53: Europe Pest Control Services Market Y-o-Y Growth (%) Projections by Product Type, 2021-2031
Figure 54: Europe Pest Control Services Market Attractiveness by Product Type, 2021-2031
Figure 55: Europe Pest Control Services Market Share and BPS Analysis by Service Type, 2021 & 2031
Figure 56: Europe Pest Control Services Market Y-o-Y Growth (%) Projections by Service Type, 2021-2031
Figure 57: Europe Pest Control Services Market Attractiveness by Service Type, 2021-2031
Figure 58: Europe Pest Control Services Market Share and BPS Analysis by End-User, 2021 & 2031
Figure 59: Europe Pest Control Services Market Y-o-Y Growth (%) Projections by End-User, 2021-2031
Figure 60: Europe Pest Control Services Market Attractiveness by End-User, 2021-2031
Figure 61: Europe Pest Control Services Market Share and BPS Analysis by Application, 2021 & 2031
Figure 62: Europe Pest Control Services Market Y-o-Y Growth (%) Projections by Application, 2021-2031
Figure 63: Europe Pest Control Services Market Attractiveness by Application, 2021-2031
Figure 64: East Asia Pest Control Services Market Share and BPS Analysis by Country, 2021 & 2031
Figure 65: East Asia Pest Control Services Market Y-o-Y Growth (%) Projections by Country, 2021-2031
Figure 66: East Asia Pest Control Services Market Attractiveness by Country, 2021-2031
Figure 67: East Asia Pest Control Services Market Share and BPS Analysis by Product Type, 2021 & 2031
Figure 68: East Asia Pest Control Services Market Y-o-Y Growth (%) Projections by Product Type, 2021-2031
Figure 69: East Asia Pest Control Services Market Attractiveness by Product Type, 2021-2031
Figure 70: East Asia Pest Control Services Market Share and BPS Analysis by Service Type, 2021 & 2031
Figure 71: East Asia Pest Control Services Market Y-o-Y Growth (%) Projections by Service Type, 2021-2031
Figure 72: East Asia Pest Control Services Market Attractiveness by Service Type, 2021-2031
Figure 73: East Asia Pest Control Services Market Share and BPS Analysis by End-User, 2021 & 2031
Figure 74: East Asia Pest Control Services Market Y-o-Y Growth (%) Projections by End-User, 2021-2031
Figure 75: East Asia Pest Control Services Market Attractiveness by End-User, 2021-2031
Figure 76: East Asia Pest Control Services Market Share and BPS Analysis by Application, 2021 & 2031
Figure 77: East Asia Pest Control Services Market Y-o-Y Growth (%) Projections by Application, 2021-2031
Figure 78: East Asia Pest Control Services Market Attractiveness by Application, 2021-2031
Figure 79: South Asia Pest Control Services Market Share and BPS Analysis by Country, 2021 & 2031
Figure 80: South Asia Pest Control Services Market Y-o-Y Growth (%) Projections by Country, 2021-2031
Figure 81: South Asia Pest Control Services Market Attractiveness by Country, 2021-2031
Figure 82: South Asia Pest Control Services Market Share and BPS Analysis by Product Type, 2021 & 2031
Figure 83: South Asia Pest Control Services Market Y-o-Y Growth (%) Projections by Product Type, 2021-2031
Figure 84: South Asia Pest Control Services Market Attractiveness by Product Type, 2021-2031
Figure 85: South Asia Pest Control Services Market Share and BPS Analysis by Service Type, 2021 & 2031
Figure 86: South Asia Pest Control Services Market Y-o-Y Growth (%) Projections by Service Type, 2021-2031
Figure 87: South Asia Pest Control Services Market Attractiveness by Service Type, 2021-2031
Figure 88: South Asia Pest Control Services Market Share and BPS Analysis by End-User, 2021 & 2031
Figure 89: South Asia Pest Control Services Market Y-o-Y Growth (%) Projections by End-User, 2021-2031
Figure 90: South Asia Pest Control Services Market Attractiveness by End-User, 2021-2031
Figure 91: South Asia Pest Control Services Market Share and BPS Analysis by Application, 2021 & 2031
Figure 92: South Asia Pest Control Services Market Y-o-Y Growth (%) Projections by Application, 2021-2031
Figure 93: South Asia Pest Control Services Market Attractiveness by Application, 2021-2031
Figure 94: Oceania Pest Control Services Market Share and BPS Analysis by Country, 2021 & 2031
Figure 95: Oceania Pest Control Services Market Y-o-Y Growth (%) Projections by Country, 2021-2031
Figure 96: Oceania Pest Control Services Market Attractiveness by Country, 2021-2031
Figure 97: Oceania Pest Control Services Market Share and BPS Analysis by Product Type, 2021 & 2031
Figure 98: Oceania Pest Control Services Market Y-o-Y Growth (%) Projections by Product Type, 2021-2031
Figure 99: Oceania Pest Control Services Market Attractiveness by Product Type, 2021-2031
Figure 100: Oceania Pest Control Services Market Share and BPS Analysis by Service Type, 2021 & 2031
Figure 101: Oceania Pest Control Services Market Y-o-Y Growth (%) Projections by Service Type, 2021-2031
Figure 102: Oceania Pest Control Services Market Attractiveness by Service Type, 2021-2031
Figure 103: Oceania Pest Control Services Market Share and BPS Analysis by End-User, 2021 & 2031
Figure 104: Oceania Pest Control Services Market Y-o-Y Growth (%) Projections by End-User, 2021-2031
Figure 105: Oceania Pest Control Services Market Attractiveness by End-User, 2021-2031
Figure 106: Oceania Pest Control Services Market Share and BPS Analysis by Application, 2021 & 2031
Figure 107: Oceania Pest Control Services Market Y-o-Y Growth (%) Projections by Application, 2021-2031
Figure 108: Oceania Pest Control Services Market Attractiveness by Application, 2021-2031
Figure 109: MEA Pest Control Services Market Share and BPS Analysis by Country, 2021 & 2031
Figure 110: MEA Pest Control Services Market Y-o-Y Growth (%) Projections by Country, 2021-2031
Figure 111: MEA Pest Control Services Market Attractiveness by Country, 2021-2031
Figure 112: MEA Pest Control Services Market Share and BPS Analysis by Product Type, 2021 & 2031
Figure 113: MEA Pest Control Services Market Y-o-Y Growth (%) Projections by Product Type, 2021-2031
Figure 114: MEA Pest Control Services Market Attractiveness by Product Type, 2021-2031
Figure 115: MEA Pest Control Services Market Share and BPS Analysis by Service Type, 2021 & 2031
Figure 116: MEA Pest Control Services Market Y-o-Y Growth (%) Projections by Service Type, 2021-2031
Figure 117: MEA Pest Control Services Market Attractiveness by Service Type, 2021-2031
Figure 118: MEA Pest Control Services Market Share and BPS Analysis by End-User, 2021 & 2031
Figure 119: MEA Pest Control Services Market Y-o-Y Growth (%) Projections by End-User, 2021-2031
Figure 120: MEA Pest Control Services Market Attractiveness by End-User, 2021-2031
Figure 121: MEA Pest Control Services Market Share and BPS Analysis by Application, 2021 & 2031
Figure 122: MEA Pest Control Services Market Y-o-Y Growth (%) Projections by Application, 2021-2031
Figure 123: MEA Pest Control Services Market Attractiveness by Application, 2021-2031
Need specific information?
Request CustomizationExplore Services and Utilities Insights
View Reports