
- Market Size (2026)
- USD 631.0 Mn
- Forecast (2036)
- USD 1300.5 Mn
- CAGR (2026 to 2036)
- 7.5%
How big is Blend Market in 2026?
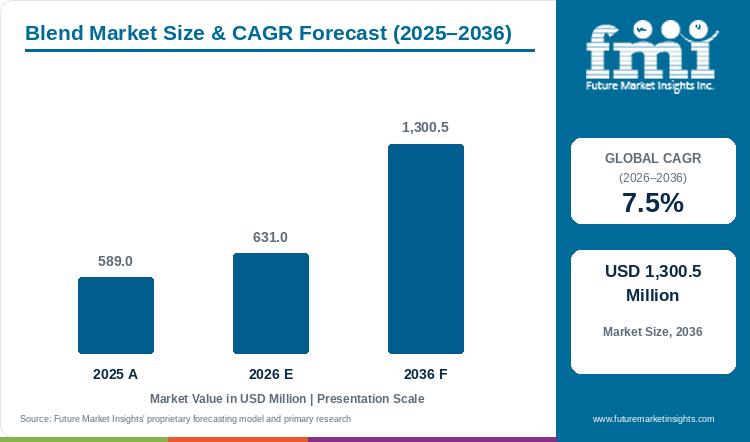
The blend market establishes its foundation at USD 589.0 million in 2025, advances to USD 631.0 million in 2026 and is forecast to scale to USD 1,300.5 million by 2036 at a CAGR of 7.5%.
The global blend market was valued at USD 589.0 million in 2025 and is estimated to reach USD 631.0 million in 2026. The market is projected to reach USD 1,300.5 million by 2036, expanding at a compound annual growth rate (CAGR) of 7.5% between 2026 and 2036. Analysis by FMI reveals that red Wine Bordeaux Blends Cabernet Merlot hold an estimated 49.4% share of 2026 beverage category demand since combining Cabernet Sauvignon backbone with Merlot fruit softness stabilizes sensory profiles across fluctuating harvests. Procurement is driven by multi-origin harvest hedging, as June 2025 enological trials in Food Chemistry X proved that blending 76.7% base grape wine with 16.7% Cabernet Sauvignon and 6.6% Syrah raised total phenolics by 60.74% and terpene aroma complexity by 17.82% [1]. That cross-varietal formulation flexibility separates the category from the herbal tea infusions sector at 3.3% CAGR, where single-herb chamomile and peppermint sachets track steady pantry replacement while wine and espresso blends capture premium retail trade-up. Global ingredient and beverage groups are investing in sensory modulation to support multi-origin blends, as Kerry Group released its 2026 Global Taste Charts in January 2026 mapping botanical and roasted flavor pairings [2] and Symrise reported organic beverage growth in April 2026 [3]. Beverage brand owners renew blending contracts when suppliers guarantee 80-point cupping and tasting consistency across crop cycles, although glass bottle freight inflation and green coffee tariff swings restrain supermarket margin expansion through 2036.
Key Market Trends & Insights
- By beverage category: Red Wine Bordeaux Blends Cabernet Merlot hold an estimated 49.4% share in 2026 because multi-cultivar assemblage buffers single-vineyard weather damage and standardizes anthocyanin color intensity.
- By price tier: Commercial Volume Retail Blends represent 56.1% in 2026 as off-trade grocery chains prioritize USD 10 to USD 18 bottled wine blends and kilogram espresso bags.
- By packaging format: Retail Consumer Packages Glass and Foil account for 59.8% in 2026 since dark-tinted glass bottles and nitrogen-flushed foil laminate bags prevent polyphenol and lipid oxidation.
- By formulation claim: Conventional Standardized Blends secure 54.2% in 2026 owing to flexible cross-regional grape must and green bean sourcing rules for commercial bottlers and roasters.
- By distribution channel: Supermarkets and Hypermarkets Off-Trade commands 52.6% in 2026 through private-label wine club endcaps and national whole-bean coffee planograms.
Regional Highlights
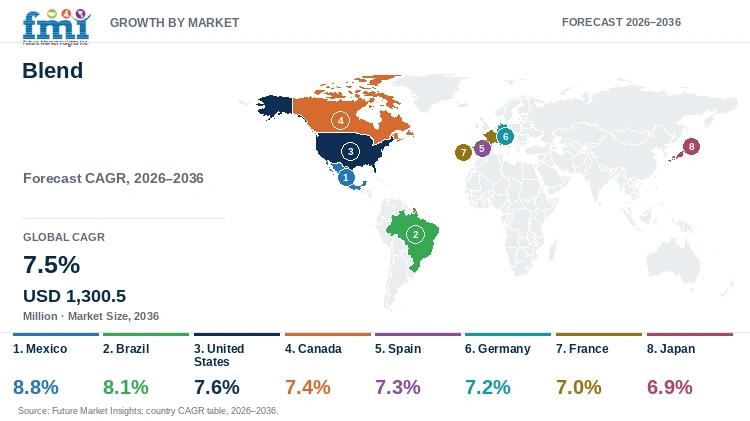
- Top national expansion: Mexico leads national growth projections at an 8.8% CAGR through 2036 under surging specialty cafe roasteries and imported table wine distribution.
- Broader country progression: Brazil tracks at an 8.1% CAGR ahead of the United States at 7.6% and Canada at 7.4%, while Spain advances at 7.3% and Germany at 7.2%.
Market Size & Forecast
Table 1: Market Size and Forecast for the Blend Market (USD million and CAGR percentage), 2025 to 2036
| Metric | Value |
|---|---|
| 2025 Market Size | USD 589.0 million |
| Estimated Market Size in 2026 | USD 631.0 million |
| Projected Market Size by 2036 | USD 1,300.5 million |
| CAGR, 2026 to 2036 | 7.5% |
| Added Valuation, 2026 to 2036 | USD 669.5 million |
Commercial wineries and specialty coffee roasters confront severe harvest yield swings and green-bean price spikes when heatwaves strike single growing regions. When beverage brands rely on single-origin lots, vintage acid drops or frost damage force abrupt retail price hikes that trigger supermarket delistings. In October 2025, food packaging researchers reporting in Foods demonstrated across accelerated storage at 40 to 60 degrees Celsius that multi-layer barrier foil packages preserve polyphenol kinetics and keep specialty roasted coffee blends above the 80-point sensory threshold [4]. Consequently, master blenders combine complementary cultivar lots and natural aroma modulators to maintain signature house flavor profiles year after year.
Formulated Volume and Blending Input Sizing
Table 2: Formulated Beverage Blend Volume and Input Sizing for the Blend Market (USD million and operational ranges), 2025 to 2036
| Metric | 2025 | 2026 | 2036 |
|---|---|---|---|
| Market size (USD million) | 589.0 | 631.0 | 1,300.5 |
| Formulated wine, coffee & tea blend volume (million 9L case equivalents) | 74.0 to 82.0 | 79.0 to 88.0 | 158.0 to 176.0 |
| Specialty flavor, tannin & botanical blending inputs (thousand metric tons) | 42.0 to 47.5 | 45.0 to 51.0 | 92.0 to 104.0 |
| Average B2B blending & formulation value per case equivalent (USD) | 7.2 to 8.0 | 7.3 to 8.1 | 7.5 to 8.4 |
Operational note on formulation ranges applies standard 15% to 35% secondary varietal wine assemblage and 70/30 to 80/20 Arabica-Robusta espresso roast ratios across commercial bottling and roasting plants.
Uniform mouthfeel and crema density across multi-origin beverage lots require calibrated maceration and roast-curve profiling. Global beverage ingredient suppliers provide enological tannins, yeast mannoproteins and natural coffee extracts that support curated wine subscriptions and retail roastery labels.
Per Capita & Blending Facility Indicators
Table 3: Per Capita and Blending Facility Indicators for the Blend Market (USD), 2025 to 2036
| Metric | 2025 | 2026 | 2036 |
|---|---|---|---|
| Global population (billion) | 8.2 | 8.3 | 9.0 |
| Market value per 1,000 people (USD) | 71.8 | 76.0 | 144.5 |
| Annual procurement per commercial blending facility (USD thousand) | 138.0 to 154.0 | 146.0 to 164.0 | 285.0 to 320.0 |
| Multi-origin artisanal & reserve blend share (%) | 41.0% to 44.0% | 42.5% to 45.5% | 51.0% to 55.0% |
Table 4: Blending Facility & Channel Indicators for the Blend Market (USD and percentages), 2026
| Metric | Value | Institutional Reference Basis |
|---|---|---|
| Market size, 2026 | USD 631.0 million | 2026 global valuation baseline |
| Commercial wineries, roasteries & tea blenders global | 4,100 facilities | Industrial wine bottling, espresso roasting & botanical houses |
| Average procurement per facility | USD 153,902.4 | Annualized blending & formulation procurement |
| Supermarkets and Hypermarkets Off-Trade value, 2026 | USD 331.9 million | 52.6% distribution channel allocation |
Cold-chain ready-to-drink espresso cans and low-alcohol botanical spritzers require emulsion and pH stabilization so organic acids from wine or coffee do not curdle plant milks or precipitate tannins. Beverage technologists incorporate hydrocolloid buffers from beverage premix formulations to preserve shelf stability across ambient grocery distribution.
Analyst Perspective
"Commercial wineries, coffee roasters and botanical tea houses use multi-origin blending as their primary financial shield against climate-driven harvest shocks. Producers that combine analytical GC-MS aroma fingerprinting with flexible Arabica-Robusta and Cabernet-Merlot ratios will protect retail shelf margins while single-origin competitors face supply shortages through 2036."
- Nandini Roy Choudhury, Principal Consultant, Future Market Insights.
How is the blend market segmented?
The blend market is segmented by beverage category, price tier, packaging format, formulation claim and distribution channel. In 2026, Red Wine Bordeaux Blends Cabernet Merlot is projected at 49.4%, Commercial Volume Retail Blends at 56.1%, Retail Consumer Packages Glass and Foil at 59.8%, Conventional Standardized Blends at 54.2% and Supermarkets and Hypermarkets Off-Trade at 52.6%.
By beverage category: Red Wine Bordeaux Blends Cabernet Merlot and White Wine Rhone Blends Viognier Marsanne with Artisan Coffee Bean Espresso Blends Arabica Robusta and Specialty Tea Herbal Infusion Blends.
By price tier: Commercial Volume Retail Blends and Specialty Craft Artisanal Small-Batch with Reserve Estate Multi-Varietal Blends and Private-Label Grocery Blends.
By packaging format: Retail Consumer Packages Glass and Foil and Foodservice Bulk HoReCa Packs with Single-Serve Capsules and Pods and Bag-in-Box Dispensing Formats.
By formulation claim: Conventional Standardized Blends and Certified Organic Multi-Origin Blends with Fair-Trade Certified Blends and Botanical Functional Blends.
By distribution channel: Supermarkets and Hypermarkets Off-Trade and On-Trade Hospitality Cafes and Restaurants with Specialty Wine and Roastery Boutiques and Direct-to-Consumer Online Subscriptions.
Why do Red Wine Bordeaux Blends Cabernet Merlot lead the beverage category?
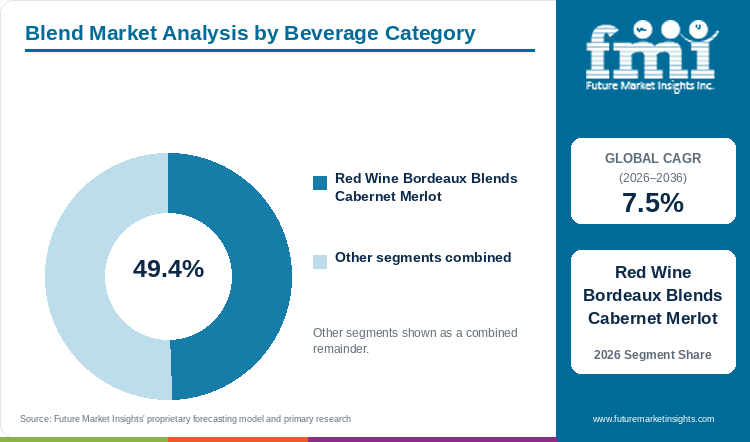
Red Wine Bordeaux Blends Cabernet Merlot hold an estimated 49.4% of beverage category demand in 2026, anchored by structured tannin-fruit balance and global restaurant list recognition.
Table 5: Beverage Category Share for the Blend Market (percentage share), 2026
| Beverage Category | Share (2026) |
|---|---|
| Red Wine Bordeaux Blends Cabernet Merlot | 49.4% |
| Other Segments Combined | 50.6%* |
| Total | 100.0% |
*Note: Remaining beverage categories account for the balance of 2026 global blend demand.
Table 6: Beverage Category Leadership and Market Growth for the Blend Market (segment and CAGR percentage), 2026 to 2036
| Metric | Value |
|---|---|
| Global CAGR (2026 to 2036) | 7.5% |
| Primary Segment | Red Wine Bordeaux Blends Cabernet Merlot |
Single-varietal Cabernet Sauvignon from cooler vintages can exhibit astringent green pyrazines, whereas pure Merlot from hot harvests can lack acidity and aging structure. By blending Cabernet Sauvignon and Merlot lots with ready to drink tea and botanical beverage portfolios, beverage groups deliver consistent berry aroma and predictable oak integration.
- Red Wine Bordeaux Blends Cabernet Merlot hold 49.4% of beverage category value in 2026 because multi-varietal red assemblage dominates both Old World chateaux and New World retail wine tiers.
- In September 2025, enologists reporting in Foods demonstrated across two Cabernet Sauvignon vintages aged 12 months in oak barrels and stainless steel that vessel selection and blending govern ester and phenolic evolution [5].
What sustains Commercial Volume Retail Blends leadership in the price tier segment?
Commercial Volume Retail Blends represent 56.1% of the price tier category in 2026, supported by high-turn supermarket planograms and everyday household consumption.
Inflation-sensitive grocery shoppers trade down from USD 40 single-vineyard bottles and boutique micro-lot coffees toward dependable USD 12 to USD 16 multi-region blends. Large commercial blenders contract bulk wine, green coffee and natural tea extracts across multiple hemispheres to maintain stable retail shelf pricing without sacrificing cup or glass quality.
- Commercial Volume Retail Blends represent 56.1% of the price tier segment in 2026 as national grocery chains expand core mid-priced wine and coffee blend SKUs.
- In July 2026, winemaking researchers in Foods documented that combining pre-fermentative cold maceration with controlled post-fermentative blending optimizes color intensity and soft tannins for early-consumption retail wines [6].
How do Retail Consumer Packages Glass and Foil lead the packaging format category?
Retail Consumer Packages Glass and Foil account for 59.8% of packaging format demand in 2026, driven by oxygen-barrier shelf life and premium visual merchandising.
Volatile esters in roasted Arabica-Robusta espresso blends and anthocyanin pigments in red wine blends degrade rapidly when exposed to oxygen ingress or ultraviolet light. Bottlers and roasters package retail blends in UV-filtering dark glass bottles and multi-layer aluminum-foil pouches with one-way degassing valves, complementing ready to serve cocktails on off-trade shelves.
- Retail Consumer Packages Glass and Foil account for 59.8% of packaging format demand in 2026 because at-home wine and espresso preparation anchors off-trade volume.
- In January 2025, analytical chemists in Food Chemistry X identified ethyl isobutyrate and (-)-epigallocatechin via UHPLC-ESI-Q-ToF as key markers preserving Cabernet Sauvignon and Marselan wine aroma in bottle storage [7].
Why do Conventional Standardized Blends lead the formulation claim category?
Conventional Standardized Blends secure 54.2% of formulation claim value in 2026, supported by cross-origin sourcing flexibility and lower raw-material premiums.
Strict organic or single-estate certification restricts blenders from substituting alternative regional lots when localized drought or leaf rust cuts certified crop yields. Conventional Standardized Blends allow master roasters and winemakers to source compliant beans, grape musts and botanicals across diverse regions to hold target sensory specs and unit costs.
- Conventional Standardized Blends secure 54.2% of formulation claim demand in 2026 as commercial blenders prioritize multi-region supply flexibility.
- In December 2025, the USDA Foreign Agricultural Service reported in its Coffee World Markets and Trade assessment that global roasters actively adjust Arabica and Robusta blend ratios to manage bean price peaks [8].
What gives Supermarkets and Hypermarkets Off-Trade the leading position in distribution channel?
Supermarkets and Hypermarkets Off-Trade commands 52.6% of distribution channel share in 2026, anchored by loyalty-card cross-promotions and private-label tiering.
Supermarket beverage buyers allocate prime aisle space to multi-varietal red wines, breakfast coffee blends and wellness herbal infusions that generate high weekly basket repeat rates. National grocery chains partner directly with industrial wine bottlers and coffee roasters to develop exclusive private-label Bordeaux, Rhone and espresso blends.
- Supermarkets and Hypermarkets Off-Trade commands 52.6% of distribution channel value in 2026 because consolidated grocery chains control majority household beverage volume.
- In July 2026, the USDA Foreign Agricultural Service confirmed in its mid-year Coffee World Markets and Trade report that off-trade retail roast-and-ground blends remain the primary volume anchor across major importing economies [9].
What are the drivers, restraints, and opportunities in the blend market?
In the blend market, climate-driven single-origin harvest volatility and cafe espresso menu expansion are projected to drive multi-origin blending whereas green-bean and glass container cost swings restrain retail margins and functional botanical-tea and low-alcohol wine blends open new consumer occasions.
- Driver: Multi-origin combinations of Arabica with high-grade Robusta beans and Cabernet with Merlot or Syrah lots enable beverage brands to buffer single-harvest crop failures and maintain uniform flavor profiles.
- Restraint: Severe weather disruptions in Brazil and Vietnam with high glass bottle and excise tax costs compress operating margins for commercial retail blenders.
- Opportunity: Formulators creating functional herbal-botanical tea blends and precision sensor-authenticated reserve wine blends capture high-margin wellness and premium hospitality demand.
Growth Analysis and Future Potential: Qualitative Demand Catalysts
Specialty cafe chains and home espresso machine ownership are accelerating demand for calibrated Arabica-Robusta bean blends and functional botanical tea infusions. While 100% single-origin Arabica often produces thin crema and sharp acidity under high-pressure 9-bar espresso extraction, blending 15% to 30% washed Robusta or Brazilian naturals builds dense crema body and chocolate notes. Consumer interest in organic food and beverages also supports metabolic herbal infusion blends. In July 2025, a clinical trial of 132 patients in Frontiers in Nutrition demonstrated that a standardized herbal infusion blend significantly improved fasting blood glucose and lipid profiles in adults with metabolic syndrome [10].
Risk Assessment of the Blend Market: Operational and Formulation Friction
Extreme weather volatility across tropical coffee belts and European vineyards represents the primary operational risk disrupting raw-material ratios for commercial blenders. When droughts in Vietnam or heatwaves in Brazil spike green Robusta and Arabica futures simultaneously, roasters cannot easily substitute cheaper beans without altering roast color and caffeine levels. In May 2026, the USDA Foreign Agricultural Service reported in its Vietnam Coffee Annual that post-2025 price peaks and erratic rainfall continue to tighten exportable green bean inventories [11]. Bottlers purchasing beverage container systems also face heavy glass container freight charges and extended producer responsibility packaging fees.
Commercial Opportunity Analysis: Formulation Differentiation and Value-Add Formats
Beverage formulators capture higher margins by pairing traditional tea and wine blends with bioactive African and Mediterranean botanicals and electrochemical quality verification. Artisanal blenders use portable electrochemical sensors and machine-learning models to authenticate polyphenol fingerprints and prevent counterfeit dilution in reserve blends. Upgrades to ready to drink packaging with single-serve nitrogen-flushed pods and canned botanical spritzers expand convenience-store distribution. In March 2026, pharmacology researchers in Journal of Ethnopharmacology demonstrated that Artemisia afra herbal infusions rich in apigenin and homoeriodictyol potently inhibit alpha-glucosidase and reverse oxidative tissue damage [12].
Blend Market by Country (2026 to 2036)
FMI country modeling indicates that Mexico leads blend market expansion at an 8.8% CAGR through 2036, while Japan advances at a 6.9% CAGR. Commercial growth across Latin American coffee and wine hubs and North American grocery chains with European appellation cellars depends on harvest yields and retail private-label adoption.
Table 7: Country CAGR and Primary Growth Levers for the Blend Market (CAGR percentage and operational drivers), 2026 to 2036
| Country | CAGR (2026 to 2036) | Primary Growth Lever |
|---|---|---|
| Mexico | 8.8% | Valle de Guadalupe red wine blends and urban specialty espresso cafe expansion |
| Brazil | 8.1% | Domestic Arabica-Conilon coffee roasting upgrades and El Nino harvest blending hedges |
| United States | 7.6% | California red wine blends, single-serve espresso pods and functional herbal teas |
| Canada | 7.4% | USD 125B retail grocery private-label coffee blends and VQA/international wine blending |
| Spain | 7.3% | Rioja and Ribera del Duero multi-varietal wine exports and 244 new retail store openings |
| Germany | 7.2% | Europe's largest green coffee roasting hub and herbal infusion pharmacy/retail blends |
| France | 7.0% | Bordeaux and Rhone AOC wine assemblage heritage and artisanal herbal tisane blends |
| Japan | 6.9% | Precision canned kissaten coffee blends and functional green-botanical tea infusions |
Source: Future Market Insights analysis
Mexico Blend Market Outlook (2026 to 2036)
Demand for commercial and artisanal beverage blends in Mexico is projected to expand at a leading 8.8% CAGR through 2036 across Valle de Guadalupe wineries, urban espresso chains and herbal infusion packers. Unlike traditional soda-dominated decades, rising middle-class hospitality spending in Mexico City and Monterrey is accelerating adoption of Baja California Cabernet-Merlot blends and Chiapas-Veracruz espresso roasts. In November 2025, the USDA Foreign Agricultural Service reported in its Mexico Retail Foods Annual that modern supermarket and convenience-store expansion continues to lift premium beverage and food distribution [13]. Domestic roasters and wine bottlers blend highland Mexican harvests with imported South American and European lots to stabilize year-round supermarket shelf supply and hospitality menu pricing.
Key takeaway: In Mexico, expanding urban cafe chains and Baja California multi-varietal winemaking are projected to drive leading beverage blend growth.
Brazil Blend Market Outlook (2026 to 2036)
Whereas growth in Mexico is led by hospitality and retail expansion, the blend market in Brazil is supported by domestic roasters combining Cerrado Arabica with washed Espirito Santo Conilon (Robusta) to counter climate-driven bean inflation. Valuation of the blend market in Brazil is forecast to climb at an 8.1% CAGR between 2026 and 2036 across roast-and-ground, capsule and Serra Gaucha red wine segments. In October 2026, the USDA Foreign Agricultural Service warned that the 2026/27 El Nino brings heatwave risks to central coffee flowering in Brazil and excessive rain to southern vineyards [14]. Master blenders in Brazil dynamically adjust Arabica-Conilon and Cabernet-Merlot percentages to preserve retail price stability despite harvest weather shocks.
Key takeaway: In Brazil, dynamic Arabica-Conilon coffee blending to hedge El Nino crop volatility is forecast to sustain rapid market expansion.
United States Blend Market Outlook (2026 to 2036)
Commercial volume in the United States is anchored by California red wine blends, specialty espresso bean subscriptions and wellness herbal tea sachets sold across club and grocery stores. Blend market size in the United States is anticipated to progress at a 7.6% CAGR through 2036 across retail glass bottles, foil valve bags and single-serve pods. In May 2026, the USDA Foreign Agricultural Service reported in its Colombia Coffee Annual that Colombia remains a top supplier of washed Arabica beans to roasters in the United States for house blends [15]. Beverage brands in the United States pair Latin American Arabica with East African or Asian beans and blend Napa-Lodi wine lots to protect gross margins.
Key takeaway: In the United States, multi-origin specialty coffee roasting and California red wine assemblage are anticipated to anchor large-scale retail demand.
Canada Blend Market Outlook (2026 to 2036)
Canada features high per-capita roasted coffee and table wine consumption with provincial liquor boards and grocery chains that favor consistent international-domestic wine and espresso blends. Demand for beverage blends in Canada is estimated to advance at a 7.4% CAGR from 2026 to 2036 across Ontario and British Columbia bottlers and national coffee roasters. In May 2026, the USDA Foreign Agricultural Service documented in its Costa Rica Coffee Annual that high-grown Central American beans remain sought after by North American specialty roasters for premium blends [16]. Beverage packers in Canada use nitrogen-flushed foil bags and lightweight glass bottles to preserve aroma across long domestic winter transit corridors.
Key takeaway: In Canada, provincial wine bottling programs and high per-capita espresso blend consumption are estimated to support steady market growth.
Spain Blend Market Outlook (2026 to 2036)
Spain is a pillar of European wine and coffee blending, where Rioja and Ribera del Duero bodegas blend Tempranillo and Garnacha with Cabernet and Merlot for global export. Market size in Spain is slated to expand at a 7.3% CAGR over the 2026 to 2036 forecast period across bottled wine exports, HoReCa espresso blends and Mediterranean herbal infusions. Per the November 2025 USDA Foreign Agricultural Service Spain Retail Foods Annual report, Spain's food distribution sector opened 244 new stores between January and April 2025, a 25% increase [17]. Wineries and commercial roasters in Spain use modern retail expansion and hospitality tourism to scale packaged blend volumes.
Key takeaway: In Spain, export-driven multi-varietal winemaking and resurgent supermarket store openings are slated to sustain strong blend demand.
Germany Blend Market Outlook (2026 to 2036)
Unlike wine-exporting Spain, Germany operates as Europe's largest green coffee roasting and herbal-fruit tea blending powerhouse across Hamburg and Bremen. Valuation of the blend market in Germany is forecast to grow at a 7.2% CAGR between 2026 and 2036 across supermarket whole-bean espresso blends, herbal infusions and imported cuvee wines. In May 2026, the USDA Foreign Agricultural Service reported in its Ethiopia Coffee Annual that Germany remains a leading European destination for Ethiopian Arabica beans used in aromatic roast blends [18]. Roasters and tea houses in Germany invest in automated optical bean sorting and precision drum roasting to supply private-label supermarket chains and specialty cafe accounts.
Key takeaway: In Germany, large-scale Hamburg coffee roasting and pharmacy-grade herbal tea blending are forecast to drive consistent demand through 2036.
France Blend Market Outlook (2026 to 2036)
France defined the global benchmark for beverage blending through centuries of Bordeaux Cabernet-Merlot and Southern Rhone Viognier-Marsanne-Roussanne appellation assemblage rules. Demand in France is projected to increase at a 7.0% CAGR through 2036 as chateaux, cooperatives and specialty cafe roasters adapt blends to warmer summer vintages and shifting bistro tastes. In September 2026, the USDA Foreign Agricultural Service published its France Retail Foods Annual report, noting steady consumer demand for organic and origin-certified grocery beverages [19]. Wine cooperatives and tisane blenders in France introduce drought-tolerant grape varieties and domestic organic Provence herbs to stabilize bottle acidity and aromatic freshness across national supermarket wine aisles and metropolitan specialty bistro hospitality channels.
Key takeaway: In France, Bordeaux and Rhone wine assemblage adaptation to warmer vintages with organic tisane growth are projected to sustain demand.
Japan Blend Market Outlook (2026 to 2036)
Japan distinguishes itself through meticulous kissaten siphon and espresso coffee blending, ready-to-drink canned coffee engineering and blended green-botanical teas sold across convenience stores and vending networks. Blend market size in Japan is predicted to advance at a 6.9% CAGR from 2026 to 2036 across commercial roasters, RTD beverage packers and imported Bordeaux wine bottlers. In May 2026, the USDA Foreign Agricultural Service reported in its Indonesia Coffee Annual that Japan remains a premier Asian buyer of Indonesian and Latin American coffee beans for multi-origin roasting [20]. Beverage formulators in Japan combine multi-origin roast profiles with oxygen-scavenging bottle caps and foil packs to prevent flavor staling.
Key takeaway: In Japan, precision multi-origin coffee roasting and convenience-store blended tea innovation are predicted to support steady long-term growth.
Full report country CAGRs cover North America and Latin America with Western Europe and Eastern Europe. Regional coverage also spans East Asia and South Asia and Pacific with Middle East and Africa.
Who are the notable companies in the blend market?
DSM-Firmenich AG, Archer Daniels Midland Company, Cargill Incorporated, International Flavors and Fragrances Inc., Kerry Group plc, Givaudan SA, Symrise AG, Tate and Lyle plc, Ingredion Incorporated and Roquette Freres SA are the notable companies in the blend market.
Competitive positioning in the B2B beverage blend and formulation industry separates global taste and botanical extract houses from integrated beverage processors and texture specialists. DSM-Firmenich AG and Kerry Group plc with Givaudan SA and Symrise AG engineer natural wine and coffee aroma modulators with enological enzymes. Archer Daniels Midland Company and Cargill Incorporated with International Flavors and Fragrances Inc. supply bulk botanical extracts and beverage bases. Tate and Lyle plc and Ingredion Incorporated with Roquette Freres SA provide mouthfeel hydrocolloids and encapsulation carriers.
- Beverage Taste and Enological Specialists: DSM-Firmenich AG and Kerry Group plc with Givaudan SA and Symrise AG supply natural flavor modulators, tea/coffee extracts and winemaking enzymes.
- Integrated Beverage Ingredient and Botanical Processors: Archer Daniels Midland Company and Cargill Incorporated with International Flavors and Fragrances Inc. provide bulk botanical extracts, beverage acidulants and turnkey drink bases.
- Mouthfeel and Encapsulation Matrix Suppliers: Tate and Lyle plc and Ingredion Incorporated with Roquette Freres SA manufacture soluble fibers, modified starches and plant-based beverage stabilizers.
Competitive Benchmarking: Blend Market
Table 8: Competitive Benchmarking for the Blend Market (qualitative capability ratings), 2026
| Company | Beverage Aroma & Botanical Blending | Mouthfeel & Stability Engineering | Clean-Label & Origin Traceability | Geographic Reach |
|---|---|---|---|---|
| DSM-Firmenich AG | High | High | High | Global Taste, Texture & Health beverage labs and Oenobrands wine enzymes |
| Archer Daniels Midland Company | High | High | High | Global WILD Flavors botanical extracts and beverage formulation centers |
| Cargill Incorporated | Medium | High | High | Global beverage texturizers, acidulants and cocoa/coffee supply chains |
| International Flavors and Fragrances Inc. | High | High | High | Global Nourish beverage flavor modulation and botanical extract network |
| Kerry Group plc | High | High | High | Global coffee, tea and botanical extract systems and taste charts |
| Givaudan SA | High | High | High | Global Taste & Wellbeing natural beverage infusions and aroma locking |
| Symrise AG | High | High | High | Global Food & Beverage Naturals wine, tea and coffee flavor solutions |
| Tate and Lyle plc | Medium | High | High | Global beverage mouthfeel optimization and low-sugar blend balancing |
| Ingredion Incorporated | Medium | High | High | Global clean-label hydrocolloids and spray-dried flavor encapsulation |
| Roquette Freres SA | Medium | High | High | Global plant-based cyclodextrins and beverage clarity stabilizers |
Evaluation basis: Beverage Aroma & Botanical Blending evaluates first-party production of natural coffee and wine extracts or enological enzymes, whereas Mouthfeel & Stability Engineering rates tannin and emulsion balancing. Clean-Label & Origin Traceability measures certified organic and natural-flavor compliance.
Key Developments in the Blend Market
- Kerry Group plc published its Feeding the Future study in August 2026 examining how climate volatility, consumer preferences and input costs are reshaping global beverage and food formulation [21].
- Symrise AG reported solid H1 2026 financial results in July 2026 with accelerating second-quarter volume momentum across its Food & Beverage division [22].
- Novonesis and partner beverage enzyme lines expanded global biosolutions capacity in August 2026 after reporting 8% organic H1 2026 sales growth [23].
Key Players in the Blend Market
Beverage Taste and Enological Specialists
- DSM-Firmenich AG
- Kerry Group plc
- Givaudan SA
- Symrise AG
Integrated Beverage Ingredient and Botanical Processors
- Archer Daniels Midland Company
- Cargill Incorporated
- International Flavors and Fragrances Inc.
Mouthfeel and Encapsulation Matrix Suppliers
- Tate and Lyle plc
- Ingredion Incorporated
- Roquette Freres SA
Blend Market - Report Scope
Table 9: Report Scope for the Blend Market (coverage fields and definitions), 2026 to 2036
| Coverage field | Report scope |
|---|---|
| Market breakdown | Beverage Category, Price Tier, Packaging Format, Formulation Claim, Distribution Channel |
| Quantitative Units | USD Million |
| Market Definition | Includes commercial supplier and contract-formulation valuation from multi-varietal wine blends (Bordeaux red Cabernet-Merlot, Rhone white Viognier-Marsanne), roasted Arabica-Robusta coffee blends, specialty herbal-tea infusion blends and attributable B2B blending inputs. Category Scope Note excludes single-origin unblended commodities and industrial fuel ethanol. |
| Regions Covered | North America, Latin America, Western Europe, Eastern Europe, East Asia, South Asia and Pacific, Middle East and Africa |
| Countries Covered | Mexico, Brazil, United States, Canada, Spain, Germany, France, Japan and additional countries in the full report |
| Key Companies Covered | DSM-Firmenich AG, Archer Daniels Midland Company, Cargill Incorporated, International Flavors and Fragrances Inc., Kerry Group plc, Givaudan SA, Symrise AG, Tate and Lyle plc, Ingredion Incorporated, Roquette Freres SA |
| Forecast Period | 2026 to 2036 |
| Approach | Primary and secondary research with top-down and bottom-up market triangulation. |
Blend Market - Research Methodology
Table 10: Research Methodology for the Blend Market (research methods and approach), 2026 edition
| Method | Approach |
|---|---|
| Primary Research | Structured interviews with commercial winemakers, specialty coffee master roasters, botanical tea blenders and supermarket private-label beverage buyers to validate cultivar ratios and B2B input costs. |
| Secondary Research | Analysis of USDA FAS Coffee Annual and Retail Foods Annual reports, PubMed enological maceration and polyphenol degradation studies, appellation blending rules and corporate financial filings. |
| Market Sizing and Forecasting | Top-down parent specialty beverage and botanical ingredients baselines reconciled against bottom-up formulated case equivalents (79.0M to 88.0M in 2026) and B2B blending realization per case from 2026 to 2036. |
| Country Forecasting Model | Econometric country projections weight national wine assemblage output, green coffee roasting capacity, specialty cafe store counts and supermarket private-label penetration across eight national markets. |
| Operational Benchmark Traceability | Formulated volume and facility indicators in Tables 2, 3 and 4 trace to D-optimal wine assemblage trials, 80-point specialty coffee storage kinetics and USDA FAS national trade registries. |
| Data Triangulation and Validation | Valuation estimates isolate commercial multi-varietal and multi-origin blend formulation and B2B sensory inputs while excluding unblended single-estate agricultural commodities and on-premise restaurant markups. |
Blend Market by Segments
Blend Market segmented by Beverage Category:
- Red Wine Bordeaux Blends Cabernet Merlot
- White Wine Rhone Blends Viognier Marsanne
- Artisan Coffee Bean Espresso Blends Arabica Robusta
- Specialty Tea Herbal Infusion Blends
Blend Market segmented by Price Tier:
- Commercial Volume Retail Blends
- Specialty Craft Artisanal Small-Batch
- Reserve Estate Multi-Varietal Blends
- Private-Label Grocery Blends
Blend Market segmented by Packaging Format:
- Retail Consumer Packages Glass and Foil
- Foodservice Bulk HoReCa Packs
- Single-Serve Capsules and Pods
- Bag-in-Box Dispensing Formats
Blend Market segmented by Formulation Claim:
- Conventional Standardized Blends
- Certified Organic Multi-Origin Blends
- Fair-Trade Certified Blends
- Botanical Functional Blends
Blend Market segmented by Distribution Channel:
- Supermarkets and Hypermarkets Off-Trade
- On-Trade Hospitality Cafes and Restaurants
- Specialty Wine and Roastery Boutiques
- Direct-to-Consumer Online Subscriptions
Blend Market by Region
- North America
- United States
- Canada
- Latin America
- Brazil
- Mexico
- Argentina
- Chile
- Western Europe
- Germany
- France
- United Kingdom
- Italy
- Spain
- Benelux
- Nordics
- Eastern Europe
- Poland
- Czech Republic
- Romania
- Hungary
- East Asia
- China
- Japan
- South Korea
- South Asia and Pacific
- India
- ASEAN
- Australia and New Zealand
- Middle East and Africa
- GCC Countries
- South Africa
- Türkiye
- Israel
Research Sources and Bibliography
- [1] Zhang, Y. and Liu, S. (2025, June 11). A Precise Blending Strategy Towards the Organoleptic Augmentation of Table Grape Wine with Cabernet Sauvignon. Food Chemistry X, 29, 102644 (PMCID PMC12221527).
- [2] Kerry Group plc. (2026, January 14). Kerry Releases 2026 Global Taste Charts Defining the Future of Beverage Flavours. Kerry Group plc Media Releases.
- [3] Symrise AG. (2026, April 29). Symrise Reports Solid Q1 2026 Sales Results and Beverage Naturals Growth. Symrise AG Corporate Newsroom.
- [4] Rodriguez, M. and Gomez, L. (2025, October 23). Polyphenol Degradation Kinetics of Specialty Coffee Blends in Different Packaging Presentations. Foods, 14(21), 3600 (PMCID PMC12607991).
- [5] Pichler, A. and Kopjar, M. (2025, September 12). A Comparative Study of Cabernet Sauvignon Red Wine Aroma and Phenolic Evolution. Foods, 14(18), 3178 (PMCID PMC12469085).
- [6] Morata, A. and Loira, I. (2026, July 22). Traditional and Emerging Maceration Techniques in Red Winemaking and Blending. Foods, 15(14), 2571 (PMCID PMC13409729).
- [7] Wang, J. and Sun, B. (2025, January 21). Chemical and Sensory Properties of Young Cabernet Sauvignon and Marselan Wines. Food Chemistry X, 25, 102180 (PMCID PMC11803894).
- [8] USDA Foreign Agricultural Service. (2025, December 18). Coffee World Markets and Trade Global Roast and Production Report. U.S. Department of Agriculture Commodity Reports.
- [9] USDA Foreign Agricultural Service. (2026, July 22). Coffee World Markets and Trade Mid-Year Global Supply Assessment. U.S. Department of Agriculture Commodity Reports.
- [10] Tariq, M. and Ahmad, N. (2025, July 17). Combined Effects of Controlled Diet and Herbal Infusion on Lipid and Glycemic Parameters. Frontiers in Nutrition, 12, 154210 (PubMed PMID 40747337).
- [11] USDA Foreign Agricultural Service. (2026, May 20). Vietnam Coffee Annual Production and Export Assessment VM2026-0012. U.S. Department of Agriculture GAIN Report.
- [12] Molan, A. and Chukwuma, C. I. (2026, March 6). Antidiabetic Antioxidant and Anti-Inflammatory Effects of Artemisia afra Herbal Infusion. Journal of Ethnopharmacology, 340, 119210 (PubMed PMID 41790936).
- [13] USDA Foreign Agricultural Service. (2025, November 19). Mexico Retail Foods Annual Market Assessment MX2025-0050. U.S. Department of Agriculture GAIN Report.
- [14] USDA Foreign Agricultural Service. (2026, October 13). Brazil Bracing for Impact on How the 2026 El Nino Affects Coffee and Agriculture. U.S. Department of Agriculture GAIN Report.
- [15] USDA Foreign Agricultural Service. (2026, May 20). Colombia Coffee Annual Production and Export Report CO2026-0009. U.S. Department of Agriculture GAIN Report.
- [16] USDA Foreign Agricultural Service. (2026, May 20). Costa Rica Coffee Annual Specialty Bean Trade Report CS2026-0007. U.S. Department of Agriculture GAIN Report.
- [17] USDA Foreign Agricultural Service. (2025, November 19). Spain Retail Foods Annual Distribution Report SP2025-0026. U.S. Department of Agriculture GAIN Report.
- [18] USDA Foreign Agricultural Service. (2026, May 20). Ethiopia Coffee Annual Production and Export Report ET2026-0006. U.S. Department of Agriculture GAIN Report.
- [19] USDA Foreign Agricultural Service. (2026, September 30). France Retail Foods Annual Market Assessment FR2026-0010. U.S. Department of Agriculture GAIN Report.
- [20] USDA Foreign Agricultural Service. (2026, May 15). Indonesia Coffee Annual Production and Trade Report ID2026-0014. U.S. Department of Agriculture GAIN Report.
- [21] Kerry Group plc. (2026, August 31). How Climate Consumers and Costs Are Reshaping Global Food and Beverage Systems. Kerry Group plc Media Releases.
- [22] Symrise AG. (2026, July 30). Symrise Reports Solid H1 2026 Performance with Accelerating Q2 Growth Momentum. Symrise AG Corporate Newsroom.
- [23] Novonesis. (2026, August 19). H1 2026 Novonesis Delivered Strong 8% Organic Sales Growth in Food and Beverage Biosolutions. Novonesis Corporate Newsroom.
- [24] Silva, R. and Santos, M. (2026, August 18). Portable Electrochemical Sensing Coupled with Machine Learning for Beverage Polyphenol Analysis. Biosensors and Bioelectronics, 260, 116420 (PMCID PMC13636340).
- [25] USDA Foreign Agricultural Service. (2026, May 20). Peru Coffee Annual Production and Export Assessment PE2026-0008. U.S. Department of Agriculture GAIN Report.
- [26] USDA Foreign Agricultural Service. (2026, April 1). Colombia Food Processing Ingredients Annual Report CO2026-0005. U.S. Department of Agriculture GAIN Report.
- [27] Kerry Group plc. (2026, January 22). Kerry 2026 Taste Charts Map Botanical and Functional Beverage Formulations. Kerry Group plc Media Releases.
- [28] Givaudan SA. (2026, July 23). Givaudan 2026 Half-Year Financial Results for Taste and Wellbeing. Givaudan SA Media Releases.
- [29] Symrise AG. (2026, October 28). Symrise Delivered Strong Volume-Driven Organic Sales Growth in Q3 2026. Symrise AG Corporate Newsroom.
- [30] Archer Daniels Midland Company. (2026, August 4). ADM Reports Second Quarter 2026 Results and Beverage Nutrition Performance. ADM Corporate News Releases.
- [31] dsm-firmenich. (2025, June 2). dsm-firmenich Completes Portfolio Alignment Around Taste Texture and Health. dsm-firmenich Corporate Press Releases.
- [32] Archer Daniels Midland Company. (2026, February 3). ADM Reports Fourth Quarter and Full-Year 2025 Results and 2026 Nutrition Outlook. ADM Corporate News Releases.
- [33] Cargill Incorporated. (2026, April 1). Cargill Wins 2026 Artificial Intelligence Excellence Award for Supply Chain Optimization. Cargill Media Center.
- [34] International Flavors and Fragrances Inc. (2026, October 6). IFF Identifies the Life-Stage Consumer Insights Shaping Beverage Formulations. IFF Media Center.
- [35] Kerry Group plc. (2026, March 19). Kerry Publishes 2025 Annual Report on Global Taste and Nutrition Performance. Kerry Group plc Media Releases.
- [36] Tate and Lyle plc. (2026, August 26). Tate and Lyle Adds New Purpose Target to Improve Consumer Beverage Health. Tate and Lyle plc Newsroom.
This bibliography is provided for reader reference and is not exhaustive. The full report contains the complete reference list and detailed citations.
This Report Answers
- How large is the blend market in 2026 and what is forecast for 2036?
- Which harvest-hedging economics and cafe menu trends support demand for multi-origin blends?
- Why do Red Wine Bordeaux Blends Cabernet Merlot lead the beverage category?
- Why do Commercial Volume Retail Blends lead the price tier category globally?
- How do growth rates differ across Mexico and Brazil with the United States and Spain?
- Which leading companies supply natural beverage aroma modulators versus bulk botanical and mouthfeel systems today?
- What limits margin expansion across glass-bottled wine blends and roasted espresso blends?
- What should beverage buyers evaluate when qualifying multi-layer barrier foil and glass packaging?
Table of Content
Table of Content
- Key Takeaways
- Market Size and CAGR
- Top Growth Driver
- Fastest Growing Segment
- Leading Region
- Key Companies
- Emerging Opportunities
- Executive Summary
- Global Market Outlook
- Demand-side Trends
- Supply-side Trends
- Technology Roadmap Analysis
- Analysis and Recommendations
- Analyst Perspective (What is happening? Why now? What should investors know?)
- Key Questions Answered
- How large is the market?
- What is the CAGR?
- What are key trends?
- Which region dominates?
- Who are the leaders?
Read More...
- Market Overview
- Market Coverage / Taxonomy
- Market Definition / Scope / Limitations
- Research Methodology
- Chapter Orientation
- Analytical Lens and Working Hypotheses
- Market Structure, Signals, and Trend Drivers
- Benchmarking and Cross-market Comparability
- Market Sizing, Forecasting, and Opportunity Mapping
- Research Design and Evidence Framework
- Desk Research Programme (Secondary Evidence)
- Expert Input and Fieldwork (Primary Evidence)
- Tooling, Models, and Reference Databases
- Data Engineering and Model Build
- Quality Assurance and Audit Trail
- Market Background
- Market Dynamics (Drivers, Restraints, Opportunity, Trends)
- Scenario Forecast (Optimistic, Likely, Conservative)
- Impact Analysis
- AI Impact
- Sustainability Impact
- Regulatory Impact
- Technology Impact
- Consumer / Buyer Analysis
- Purchase Drivers
- Adoption Barriers
- Buyer Journey
- Opportunity Map Analysis
- Product Life Cycle Analysis
- Supply Chain Analysis
- Investment Feasibility Matrix
- Value Chain Analysis
- PESTLE and Porter's Analysis
- Regulatory Landscape
- Regional Parent Market Outlook
- Production and Consumption Statistics
- Import and Export Statistics
- Global Market Analysis and Forecast, 2021 to 2036
- Historical Market Size Value (USD Million) Analysis, 2021 to 2025
- Current and Future Market Size Value (USD Million) Projections, 2026 to 2036
- Y-o-Y Growth Trend Analysis
- Absolute $ Opportunity Analysis
- Global Market Pricing Analysis, 2021 to 2036
- Global Market Analysis and Forecast, By Beverage Category, 2021 to 2036
- Introduction / Key Findings
- Historical Market Size Value (USD Million) Analysis By Beverage Category, 2021 to 2025
- Current and Future Market Size Value (USD Million) Analysis and Forecast By Beverage Category, 2026 to 2036
- Red Wine Bordeaux Blends Cabernet Merlot
- White Wine Rhone Blends Viognier Marsanne
- Artisan Coffee Bean Espresso Blends Arabica Robusta
- Specialty Tea Herbal Infusion Blends
- Y-o-Y Growth Trend Analysis By Beverage Category, 2021 to 2025
- Absolute $ Opportunity Analysis By Beverage Category, 2026 to 2036
- Global Market Analysis and Forecast, By Price Tier, 2021 to 2036
- Introduction / Key Findings
- Historical Market Size Value (USD Million) Analysis By Price Tier, 2021 to 2025
- Current and Future Market Size Value (USD Million) Analysis and Forecast By Price Tier, 2026 to 2036
- Commercial Volume Retail Blends
- Specialty Craft Artisanal Small-Batch
- Reserve Estate Multi-Varietal Blends
- Private-Label Grocery Blends
- Y-o-Y Growth Trend Analysis By Price Tier, 2021 to 2025
- Absolute $ Opportunity Analysis By Price Tier, 2026 to 2036
- Global Market Analysis and Forecast, By Packaging Format, 2021 to 2036
- Introduction / Key Findings
- Historical Market Size Value (USD Million) Analysis By Packaging Format, 2021 to 2025
- Current and Future Market Size Value (USD Million) Analysis and Forecast By Packaging Format, 2026 to 2036
- Retail Consumer Packages Glass and Foil
- Foodservice Bulk HoReCa Packs
- Single-Serve Capsules and Pods
- Bag-in-Box Dispensing Formats
- Y-o-Y Growth Trend Analysis By Packaging Format, 2021 to 2025
- Absolute $ Opportunity Analysis By Packaging Format, 2026 to 2036
- Global Market Analysis and Forecast, By Formulation Claim, 2021 to 2036
- Introduction / Key Findings
- Historical Market Size Value (USD Million) Analysis By Formulation Claim, 2021 to 2025
- Current and Future Market Size Value (USD Million) Analysis and Forecast By Formulation Claim, 2026 to 2036
- Conventional Standardized Blends
- Certified Organic Multi-Origin Blends
- Fair-Trade Certified Blends
- Botanical Functional Blends
- Y-o-Y Growth Trend Analysis By Formulation Claim, 2021 to 2025
- Absolute $ Opportunity Analysis By Formulation Claim, 2026 to 2036
- Global Market Analysis and Forecast, By Distribution Channel, 2021 to 2036
- Introduction / Key Findings
- Historical Market Size Value (USD Million) Analysis By Distribution Channel, 2021 to 2025
- Current and Future Market Size Value (USD Million) Analysis and Forecast By Distribution Channel, 2026 to 2036
- Supermarkets and Hypermarkets Off-Trade
- On-Trade Hospitality Cafes and Restaurants
- Specialty Wine and Roastery Boutiques
- Direct-to-Consumer Online Subscriptions
- Y-o-Y Growth Trend Analysis By Distribution Channel, 2021 to 2025
- Absolute $ Opportunity Analysis By Distribution Channel, 2026 to 2036
- Global Market Analysis and Forecast, By Region, 2021 to 2036
- Introduction
- Historical Market Size Value (USD Million) Analysis By Region, 2021 to 2025
- Current Market Size Value (USD Million) Analysis and Forecast By Region, 2026 to 2036
- North America
- Latin America
- Western Europe
- Eastern Europe
- East Asia
- South Asia and Pacific
- Middle East and Africa
- Market Attractiveness Analysis By Region
- North America Market Analysis and Forecast, By Country, 2021 to 2036
- Historical Market Size Value (USD Million) Trend Analysis By Market Taxonomy, 2021 to 2025
- Market Size Value (USD Million) Forecast By Market Taxonomy, 2026 to 2036
- By Country
- United States
- Canada
- By Beverage Category
- By Price Tier
- By Packaging Format
- By Formulation Claim
- By Distribution Channel
- By Country
- Market Attractiveness Analysis
- By Country
- By Beverage Category
- By Price Tier
- By Packaging Format
- By Formulation Claim
- By Distribution Channel
- Key Takeaways
- Latin America Market Analysis and Forecast, By Country
- Historical Market Size Value (USD Million) Trend Analysis By Market Taxonomy, 2021 to 2025
- Market Size Value (USD Million) Forecast By Market Taxonomy, 2026 to 2036
- By Country
- Brazil
- Mexico
- Argentina
- Chile
- By Beverage Category
- By Price Tier
- By Packaging Format
- By Formulation Claim
- By Distribution Channel
- By Country
- Market Attractiveness Analysis
- By Country
- By Beverage Category
- By Price Tier
- By Packaging Format
- By Formulation Claim
- By Distribution Channel
- Key Takeaways
- Western Europe Market Analysis and Forecast, By Country
- Historical Market Size Value (USD Million) Trend Analysis By Market Taxonomy, 2021 to 2025
- Market Size Value (USD Million) Forecast By Market Taxonomy, 2026 to 2036
- By Country
- Germany
- France
- United Kingdom
- Italy
- Spain
- Benelux
- Nordics
- By Beverage Category
- By Price Tier
- By Packaging Format
- By Formulation Claim
- By Distribution Channel
- By Country
- Market Attractiveness Analysis
- By Country
- By Beverage Category
- By Price Tier
- By Packaging Format
- By Formulation Claim
- By Distribution Channel
- Key Takeaways
- Eastern Europe Market Analysis and Forecast, By Country
- Historical Market Size Value (USD Million) Trend Analysis By Market Taxonomy, 2021 to 2025
- Market Size Value (USD Million) Forecast By Market Taxonomy, 2026 to 2036
- By Country
- Poland
- Czech Republic
- Romania
- Hungary
- By Beverage Category
- By Price Tier
- By Packaging Format
- By Formulation Claim
- By Distribution Channel
- By Country
- Market Attractiveness Analysis
- By Country
- By Beverage Category
- By Price Tier
- By Packaging Format
- By Formulation Claim
- By Distribution Channel
- Key Takeaways
- East Asia Market Analysis and Forecast, By Country
- Historical Market Size Value (USD Million) Trend Analysis By Market Taxonomy, 2021 to 2025
- Market Size Value (USD Million) Forecast By Market Taxonomy, 2026 to 2036
- By Country
- China
- Japan
- South Korea
- By Beverage Category
- By Price Tier
- By Packaging Format
- By Formulation Claim
- By Distribution Channel
- By Country
- Market Attractiveness Analysis
- By Country
- By Beverage Category
- By Price Tier
- By Packaging Format
- By Formulation Claim
- By Distribution Channel
- Key Takeaways
- South Asia and Pacific Market Analysis and Forecast, By Country
- Historical Market Size Value (USD Million) Trend Analysis By Market Taxonomy, 2021 to 2025
- Market Size Value (USD Million) Forecast By Market Taxonomy, 2026 to 2036
- By Country
- India
- ASEAN
- Australia and New Zealand
- By Beverage Category
- By Price Tier
- By Packaging Format
- By Formulation Claim
- By Distribution Channel
- By Country
- Market Attractiveness Analysis
- By Country
- By Beverage Category
- By Price Tier
- By Packaging Format
- By Formulation Claim
- By Distribution Channel
- Key Takeaways
- Middle East and Africa Market Analysis and Forecast, By Country
- Historical Market Size Value (USD Million) Trend Analysis By Market Taxonomy, 2021 to 2025
- Market Size Value (USD Million) Forecast By Market Taxonomy, 2026 to 2036
- By Country
- GCC Countries
- South Africa
- Türkiye
- Israel
- By Beverage Category
- By Price Tier
- By Packaging Format
- By Formulation Claim
- By Distribution Channel
- By Country
- Market Attractiveness Analysis
- By Country
- By Beverage Category
- By Price Tier
- By Packaging Format
- By Formulation Claim
- By Distribution Channel
- Key Takeaways
- Key Countries Market Analysis
- United States
- Pricing Analysis
- Market Share Analysis, 2025
- By Beverage Category
- By Price Tier
- By Packaging Format
- By Formulation Claim
- By Distribution Channel
- Canada
- Pricing Analysis
- Market Share Analysis, 2025
- By Beverage Category
- By Price Tier
- By Packaging Format
- By Formulation Claim
- By Distribution Channel
- Mexico
- Pricing Analysis
- Market Share Analysis, 2025
- By Beverage Category
- By Price Tier
- By Packaging Format
- By Formulation Claim
- By Distribution Channel
- Brazil
- Pricing Analysis
- Market Share Analysis, 2025
- By Beverage Category
- By Price Tier
- By Packaging Format
- By Formulation Claim
- By Distribution Channel
- Chile
- Pricing Analysis
- Market Share Analysis, 2025
- By Beverage Category
- By Price Tier
- By Packaging Format
- By Formulation Claim
- By Distribution Channel
- Germany
- Pricing Analysis
- Market Share Analysis, 2025
- By Beverage Category
- By Price Tier
- By Packaging Format
- By Formulation Claim
- By Distribution Channel
- United Kingdom
- Pricing Analysis
- Market Share Analysis, 2025
- By Beverage Category
- By Price Tier
- By Packaging Format
- By Formulation Claim
- By Distribution Channel
- Italy
- Pricing Analysis
- Market Share Analysis, 2025
- By Beverage Category
- By Price Tier
- By Packaging Format
- By Formulation Claim
- By Distribution Channel
- Spain
- Pricing Analysis
- Market Share Analysis, 2025
- By Beverage Category
- By Price Tier
- By Packaging Format
- By Formulation Claim
- By Distribution Channel
- France
- Pricing Analysis
- Market Share Analysis, 2025
- By Beverage Category
- By Price Tier
- By Packaging Format
- By Formulation Claim
- By Distribution Channel
- India
- Pricing Analysis
- Market Share Analysis, 2025
- By Beverage Category
- By Price Tier
- By Packaging Format
- By Formulation Claim
- By Distribution Channel
- ASEAN
- Pricing Analysis
- Market Share Analysis, 2025
- By Beverage Category
- By Price Tier
- By Packaging Format
- By Formulation Claim
- By Distribution Channel
- Australia and New Zealand
- Pricing Analysis
- Market Share Analysis, 2025
- By Beverage Category
- By Price Tier
- By Packaging Format
- By Formulation Claim
- By Distribution Channel
- China
- Pricing Analysis
- Market Share Analysis, 2025
- By Beverage Category
- By Price Tier
- By Packaging Format
- By Formulation Claim
- By Distribution Channel
- Japan
- Pricing Analysis
- Market Share Analysis, 2025
- By Beverage Category
- By Price Tier
- By Packaging Format
- By Formulation Claim
- By Distribution Channel
- South Korea
- Pricing Analysis
- Market Share Analysis, 2025
- By Beverage Category
- By Price Tier
- By Packaging Format
- By Formulation Claim
- By Distribution Channel
- Poland
- Pricing Analysis
- Market Share Analysis, 2025
- By Beverage Category
- By Price Tier
- By Packaging Format
- By Formulation Claim
- By Distribution Channel
- Hungary
- Pricing Analysis
- Market Share Analysis, 2025
- By Beverage Category
- By Price Tier
- By Packaging Format
- By Formulation Claim
- By Distribution Channel
- Türkiye
- Pricing Analysis
- Market Share Analysis, 2025
- By Beverage Category
- By Price Tier
- By Packaging Format
- By Formulation Claim
- By Distribution Channel
- South Africa
- Pricing Analysis
- Market Share Analysis, 2025
- By Beverage Category
- By Price Tier
- By Packaging Format
- By Formulation Claim
- By Distribution Channel
- United States
- Market Structure Analysis
- Competition Dashboard
- Competition Benchmarking
- Market Share Analysis of Top Players
- By Regional
- By Beverage Category
- By Price Tier
- By Packaging Format
- By Formulation Claim
- By Distribution Channel
- Emerging Startups
- Innovation Benchmarking
- Competition Analysis
- Competition Deep Dive
- DSM-Firmenich AG
- Overview
- Product Portfolio
- Profitability by Market Segments
- Sales Footprint
- Strategy Overview
- Marketing Strategy
- Product Strategy
- Channel Strategy
- Archer Daniels Midland Company
- Cargill Incorporated
- International Flavors and Fragrances Inc.
- Kerry Group plc
- Givaudan SA
- Symrise AG
- Tate and Lyle plc
- Ingredion Incorporated
- Roquette Freres SA
- DSM-Firmenich AG
- Case Studies
- Success Stories
- Recent Developments
- Competition Deep Dive
- Assumptions & Acronyms Used
List of Tables
- Table 1: Global Market Value (USD Million) Forecast by Region, 2021 to 2036
- Table 2: Global Market Value (USD Million) Forecast by Beverage Category, 2021 to 2036
- Table 3: Global Market Value (USD Million) Forecast by Price Tier, 2021 to 2036
- Table 4: Global Market Value (USD Million) Forecast by Packaging Format, 2021 to 2036
- Table 5: Global Market Value (USD Million) Forecast by Formulation Claim, 2021 to 2036
- Table 6: Global Market Value (USD Million) Forecast by Distribution Channel, 2021 to 2036
- Table 7: North America Market Value (USD Million) Forecast by Country, 2021 to 2036
- Table 8: North America Market Value (USD Million) Forecast by Beverage Category, 2021 to 2036
- Table 9: North America Market Value (USD Million) Forecast by Price Tier, 2021 to 2036
- Table 10: North America Market Value (USD Million) Forecast by Packaging Format, 2021 to 2036
- Table 11: North America Market Value (USD Million) Forecast by Formulation Claim, 2021 to 2036
- Table 12: North America Market Value (USD Million) Forecast by Distribution Channel, 2021 to 2036
- Table 13: Latin America Market Value (USD Million) Forecast by Country, 2021 to 2036
- Table 14: Latin America Market Value (USD Million) Forecast by Beverage Category, 2021 to 2036
- Table 15: Latin America Market Value (USD Million) Forecast by Price Tier, 2021 to 2036
- Table 16: Latin America Market Value (USD Million) Forecast by Packaging Format, 2021 to 2036
- Table 17: Latin America Market Value (USD Million) Forecast by Formulation Claim, 2021 to 2036
- Table 18: Latin America Market Value (USD Million) Forecast by Distribution Channel, 2021 to 2036
- Table 19: Western Europe Market Value (USD Million) Forecast by Country, 2021 to 2036
- Table 20: Western Europe Market Value (USD Million) Forecast by Beverage Category, 2021 to 2036
- Table 21: Western Europe Market Value (USD Million) Forecast by Price Tier, 2021 to 2036
- Table 22: Western Europe Market Value (USD Million) Forecast by Packaging Format, 2021 to 2036
- Table 23: Western Europe Market Value (USD Million) Forecast by Formulation Claim, 2021 to 2036
- Table 24: Western Europe Market Value (USD Million) Forecast by Distribution Channel, 2021 to 2036
- Table 25: Eastern Europe Market Value (USD Million) Forecast by Country, 2021 to 2036
- Table 26: Eastern Europe Market Value (USD Million) Forecast by Beverage Category, 2021 to 2036
- Table 27: Eastern Europe Market Value (USD Million) Forecast by Price Tier, 2021 to 2036
- Table 28: Eastern Europe Market Value (USD Million) Forecast by Packaging Format, 2021 to 2036
- Table 29: Eastern Europe Market Value (USD Million) Forecast by Formulation Claim, 2021 to 2036
- Table 30: Eastern Europe Market Value (USD Million) Forecast by Distribution Channel, 2021 to 2036
- Table 31: East Asia Market Value (USD Million) Forecast by Country, 2021 to 2036
- Table 32: East Asia Market Value (USD Million) Forecast by Beverage Category, 2021 to 2036
- Table 33: East Asia Market Value (USD Million) Forecast by Price Tier, 2021 to 2036
- Table 34: East Asia Market Value (USD Million) Forecast by Packaging Format, 2021 to 2036
- Table 35: East Asia Market Value (USD Million) Forecast by Formulation Claim, 2021 to 2036
- Table 36: East Asia Market Value (USD Million) Forecast by Distribution Channel, 2021 to 2036
- Table 37: South Asia and Pacific Market Value (USD Million) Forecast by Country, 2021 to 2036
- Table 38: South Asia and Pacific Market Value (USD Million) Forecast by Beverage Category, 2021 to 2036
- Table 39: South Asia and Pacific Market Value (USD Million) Forecast by Price Tier, 2021 to 2036
- Table 40: South Asia and Pacific Market Value (USD Million) Forecast by Packaging Format, 2021 to 2036
- Table 41: South Asia and Pacific Market Value (USD Million) Forecast by Formulation Claim, 2021 to 2036
- Table 42: South Asia and Pacific Market Value (USD Million) Forecast by Distribution Channel, 2021 to 2036
- Table 43: Middle East and Africa Market Value (USD Million) Forecast by Country, 2021 to 2036
- Table 44: Middle East and Africa Market Value (USD Million) Forecast by Beverage Category, 2021 to 2036
- Table 45: Middle East and Africa Market Value (USD Million) Forecast by Price Tier, 2021 to 2036
- Table 46: Middle East and Africa Market Value (USD Million) Forecast by Packaging Format, 2021 to 2036
- Table 47: Middle East and Africa Market Value (USD Million) Forecast by Formulation Claim, 2021 to 2036
- Table 48: Middle East and Africa Market Value (USD Million) Forecast by Distribution Channel, 2021 to 2036
List of Figures
- Figure 1: Global Market Pricing Analysis
- Figure 2: Global Market Value (USD Million) Forecast 2021-2036
- Figure 3: Global Market Value Share and BPS Analysis by Beverage Category, 2026 and 2036
- Figure 4: Global Market Y-o-Y Growth Comparison by Beverage Category, 2026-2036
- Figure 5: Global Market Attractiveness Analysis by Beverage Category
- Figure 6: Global Market Value Share and BPS Analysis by Price Tier, 2026 and 2036
- Figure 7: Global Market Y-o-Y Growth Comparison by Price Tier, 2026-2036
- Figure 8: Global Market Attractiveness Analysis by Price Tier
- Figure 9: Global Market Value Share and BPS Analysis by Packaging Format, 2026 and 2036
- Figure 10: Global Market Y-o-Y Growth Comparison by Packaging Format, 2026-2036
- Figure 11: Global Market Attractiveness Analysis by Packaging Format
- Figure 12: Global Market Value Share and BPS Analysis by Formulation Claim, 2026 and 2036
- Figure 13: Global Market Y-o-Y Growth Comparison by Formulation Claim, 2026-2036
- Figure 14: Global Market Attractiveness Analysis by Formulation Claim
- Figure 15: Global Market Value Share and BPS Analysis by Distribution Channel, 2026 and 2036
- Figure 16: Global Market Y-o-Y Growth Comparison by Distribution Channel, 2026-2036
- Figure 17: Global Market Attractiveness Analysis by Distribution Channel
- Figure 18: Global Market Value (USD Million) Share and BPS Analysis by Region, 2026 and 2036
- Figure 19: Global Market Y-o-Y Growth Comparison by Region, 2026-2036
- Figure 20: Global Market Attractiveness Analysis by Region
- Figure 21: North America Market Incremental Dollar Opportunity, 2026-2036
- Figure 22: Latin America Market Incremental Dollar Opportunity, 2026-2036
- Figure 23: Western Europe Market Incremental Dollar Opportunity, 2026-2036
- Figure 24: Eastern Europe Market Incremental Dollar Opportunity, 2026-2036
- Figure 25: East Asia Market Incremental Dollar Opportunity, 2026-2036
- Figure 26: South Asia and Pacific Market Incremental Dollar Opportunity, 2026-2036
- Figure 27: Middle East and Africa Market Incremental Dollar Opportunity, 2026-2036
- Figure 28: North America Market Value Share and BPS Analysis by Country, 2026 and 2036
- Figure 29: North America Market Value Share and BPS Analysis by Beverage Category, 2026 and 2036
- Figure 30: North America Market Y-o-Y Growth Comparison by Beverage Category, 2026-2036
- Figure 31: North America Market Attractiveness Analysis by Beverage Category
- Figure 32: North America Market Value Share and BPS Analysis by Price Tier, 2026 and 2036
- Figure 33: North America Market Y-o-Y Growth Comparison by Price Tier, 2026-2036
- Figure 34: North America Market Attractiveness Analysis by Price Tier
- Figure 35: North America Market Value Share and BPS Analysis by Packaging Format, 2026 and 2036
- Figure 36: North America Market Y-o-Y Growth Comparison by Packaging Format, 2026-2036
- Figure 37: North America Market Attractiveness Analysis by Packaging Format
- Figure 38: North America Market Value Share and BPS Analysis by Formulation Claim, 2026 and 2036
- Figure 39: North America Market Y-o-Y Growth Comparison by Formulation Claim, 2026-2036
- Figure 40: North America Market Attractiveness Analysis by Formulation Claim
- Figure 41: North America Market Value Share and BPS Analysis by Distribution Channel, 2026 and 2036
- Figure 42: North America Market Y-o-Y Growth Comparison by Distribution Channel, 2026-2036
- Figure 43: North America Market Attractiveness Analysis by Distribution Channel
- Figure 44: Latin America Market Value Share and BPS Analysis by Country, 2026 and 2036
- Figure 45: Latin America Market Value Share and BPS Analysis by Beverage Category, 2026 and 2036
- Figure 46: Latin America Market Y-o-Y Growth Comparison by Beverage Category, 2026-2036
- Figure 47: Latin America Market Attractiveness Analysis by Beverage Category
- Figure 48: Latin America Market Value Share and BPS Analysis by Price Tier, 2026 and 2036
- Figure 49: Latin America Market Y-o-Y Growth Comparison by Price Tier, 2026-2036
- Figure 50: Latin America Market Attractiveness Analysis by Price Tier
- Figure 51: Latin America Market Value Share and BPS Analysis by Packaging Format, 2026 and 2036
- Figure 52: Latin America Market Y-o-Y Growth Comparison by Packaging Format, 2026-2036
- Figure 53: Latin America Market Attractiveness Analysis by Packaging Format
- Figure 54: Latin America Market Value Share and BPS Analysis by Formulation Claim, 2026 and 2036
- Figure 55: Latin America Market Y-o-Y Growth Comparison by Formulation Claim, 2026-2036
- Figure 56: Latin America Market Attractiveness Analysis by Formulation Claim
- Figure 57: Latin America Market Value Share and BPS Analysis by Distribution Channel, 2026 and 2036
- Figure 58: Latin America Market Y-o-Y Growth Comparison by Distribution Channel, 2026-2036
- Figure 59: Latin America Market Attractiveness Analysis by Distribution Channel
- Figure 60: Western Europe Market Value Share and BPS Analysis by Country, 2026 and 2036
- Figure 61: Western Europe Market Value Share and BPS Analysis by Beverage Category, 2026 and 2036
- Figure 62: Western Europe Market Y-o-Y Growth Comparison by Beverage Category, 2026-2036
- Figure 63: Western Europe Market Attractiveness Analysis by Beverage Category
- Figure 64: Western Europe Market Value Share and BPS Analysis by Price Tier, 2026 and 2036
- Figure 65: Western Europe Market Y-o-Y Growth Comparison by Price Tier, 2026-2036
- Figure 66: Western Europe Market Attractiveness Analysis by Price Tier
- Figure 67: Western Europe Market Value Share and BPS Analysis by Packaging Format, 2026 and 2036
- Figure 68: Western Europe Market Y-o-Y Growth Comparison by Packaging Format, 2026-2036
- Figure 69: Western Europe Market Attractiveness Analysis by Packaging Format
- Figure 70: Western Europe Market Value Share and BPS Analysis by Formulation Claim, 2026 and 2036
- Figure 71: Western Europe Market Y-o-Y Growth Comparison by Formulation Claim, 2026-2036
- Figure 72: Western Europe Market Attractiveness Analysis by Formulation Claim
- Figure 73: Western Europe Market Value Share and BPS Analysis by Distribution Channel, 2026 and 2036
- Figure 74: Western Europe Market Y-o-Y Growth Comparison by Distribution Channel, 2026-2036
- Figure 75: Western Europe Market Attractiveness Analysis by Distribution Channel
- Figure 76: Eastern Europe Market Value Share and BPS Analysis by Country, 2026 and 2036
- Figure 77: Eastern Europe Market Value Share and BPS Analysis by Beverage Category, 2026 and 2036
- Figure 78: Eastern Europe Market Y-o-Y Growth Comparison by Beverage Category, 2026-2036
- Figure 79: Eastern Europe Market Attractiveness Analysis by Beverage Category
- Figure 80: Eastern Europe Market Value Share and BPS Analysis by Price Tier, 2026 and 2036
- Figure 81: Eastern Europe Market Y-o-Y Growth Comparison by Price Tier, 2026-2036
- Figure 82: Eastern Europe Market Attractiveness Analysis by Price Tier
- Figure 83: Eastern Europe Market Value Share and BPS Analysis by Packaging Format, 2026 and 2036
- Figure 84: Eastern Europe Market Y-o-Y Growth Comparison by Packaging Format, 2026-2036
- Figure 85: Eastern Europe Market Attractiveness Analysis by Packaging Format
- Figure 86: Eastern Europe Market Value Share and BPS Analysis by Formulation Claim, 2026 and 2036
- Figure 87: Eastern Europe Market Y-o-Y Growth Comparison by Formulation Claim, 2026-2036
- Figure 88: Eastern Europe Market Attractiveness Analysis by Formulation Claim
- Figure 89: Eastern Europe Market Value Share and BPS Analysis by Distribution Channel, 2026 and 2036
- Figure 90: Eastern Europe Market Y-o-Y Growth Comparison by Distribution Channel, 2026-2036
- Figure 91: Eastern Europe Market Attractiveness Analysis by Distribution Channel
- Figure 92: East Asia Market Value Share and BPS Analysis by Country, 2026 and 2036
- Figure 93: East Asia Market Value Share and BPS Analysis by Beverage Category, 2026 and 2036
- Figure 94: East Asia Market Y-o-Y Growth Comparison by Beverage Category, 2026-2036
- Figure 95: East Asia Market Attractiveness Analysis by Beverage Category
- Figure 96: East Asia Market Value Share and BPS Analysis by Price Tier, 2026 and 2036
- Figure 97: East Asia Market Y-o-Y Growth Comparison by Price Tier, 2026-2036
- Figure 98: East Asia Market Attractiveness Analysis by Price Tier
- Figure 99: East Asia Market Value Share and BPS Analysis by Packaging Format, 2026 and 2036
- Figure 100: East Asia Market Y-o-Y Growth Comparison by Packaging Format, 2026-2036
- Figure 101: East Asia Market Attractiveness Analysis by Packaging Format
- Figure 102: East Asia Market Value Share and BPS Analysis by Formulation Claim, 2026 and 2036
- Figure 103: East Asia Market Y-o-Y Growth Comparison by Formulation Claim, 2026-2036
- Figure 104: East Asia Market Attractiveness Analysis by Formulation Claim
- Figure 105: East Asia Market Value Share and BPS Analysis by Distribution Channel, 2026 and 2036
- Figure 106: East Asia Market Y-o-Y Growth Comparison by Distribution Channel, 2026-2036
- Figure 107: East Asia Market Attractiveness Analysis by Distribution Channel
- Figure 108: South Asia and Pacific Market Value Share and BPS Analysis by Country, 2026 and 2036
- Figure 109: South Asia and Pacific Market Value Share and BPS Analysis by Beverage Category, 2026 and 2036
- Figure 110: South Asia and Pacific Market Y-o-Y Growth Comparison by Beverage Category, 2026-2036
- Figure 111: South Asia and Pacific Market Attractiveness Analysis by Beverage Category
- Figure 112: South Asia and Pacific Market Value Share and BPS Analysis by Price Tier, 2026 and 2036
- Figure 113: South Asia and Pacific Market Y-o-Y Growth Comparison by Price Tier, 2026-2036
- Figure 114: South Asia and Pacific Market Attractiveness Analysis by Price Tier
- Figure 115: South Asia and Pacific Market Value Share and BPS Analysis by Packaging Format, 2026 and 2036
- Figure 116: South Asia and Pacific Market Y-o-Y Growth Comparison by Packaging Format, 2026-2036
- Figure 117: South Asia and Pacific Market Attractiveness Analysis by Packaging Format
- Figure 118: South Asia and Pacific Market Value Share and BPS Analysis by Formulation Claim, 2026 and 2036
- Figure 119: South Asia and Pacific Market Y-o-Y Growth Comparison by Formulation Claim, 2026-2036
- Figure 120: South Asia and Pacific Market Attractiveness Analysis by Formulation Claim
- Figure 121: South Asia and Pacific Market Value Share and BPS Analysis by Distribution Channel, 2026 and 2036
- Figure 122: South Asia and Pacific Market Y-o-Y Growth Comparison by Distribution Channel, 2026-2036
- Figure 123: South Asia and Pacific Market Attractiveness Analysis by Distribution Channel
- Figure 124: Middle East and Africa Market Value Share and BPS Analysis by Country, 2026 and 2036
- Figure 125: Middle East and Africa Market Value Share and BPS Analysis by Beverage Category, 2026 and 2036
- Figure 126: Middle East and Africa Market Y-o-Y Growth Comparison by Beverage Category, 2026-2036
- Figure 127: Middle East and Africa Market Attractiveness Analysis by Beverage Category
- Figure 128: Middle East and Africa Market Value Share and BPS Analysis by Price Tier, 2026 and 2036
- Figure 129: Middle East and Africa Market Y-o-Y Growth Comparison by Price Tier, 2026-2036
- Figure 130: Middle East and Africa Market Attractiveness Analysis by Price Tier
- Figure 131: Middle East and Africa Market Value Share and BPS Analysis by Packaging Format, 2026 and 2036
- Figure 132: Middle East and Africa Market Y-o-Y Growth Comparison by Packaging Format, 2026-2036
- Figure 133: Middle East and Africa Market Attractiveness Analysis by Packaging Format
- Figure 134: Middle East and Africa Market Value Share and BPS Analysis by Formulation Claim, 2026 and 2036
- Figure 135: Middle East and Africa Market Y-o-Y Growth Comparison by Formulation Claim, 2026-2036
- Figure 136: Middle East and Africa Market Attractiveness Analysis by Formulation Claim
- Figure 137: Middle East and Africa Market Value Share and BPS Analysis by Distribution Channel, 2026 and 2036
- Figure 138: Middle East and Africa Market Y-o-Y Growth Comparison by Distribution Channel, 2026-2036
- Figure 139: Middle East and Africa Market Attractiveness Analysis by Distribution Channel
- Figure 140: Global Market - Tier Structure Analysis
- Figure 141: Global Market - Company Share Analysis
Frequently Asked Questions
How big is the blend market in 2026, and what is forecast for 2036?
FMI estimates that the global blend market size stood at USD 589.0 million in 2025 and reached USD 631.0 million in 2026. Overall industry valuation is on track to hit USD 1,300.5 million by 2036 as wineries, coffee roasters and botanical tea packers expand multi-origin formulations.
What is the CAGR for the blend market from 2026 to 2036?
The blend sector is projected to expand at a 7.5% CAGR over the 2026 to 2036 window, adding USD 669.5 million in net valuation across commercial retail and specialty artisanal beverage lines.
Which beverage category segment leads the blend market?
Red Wine Bordeaux Blends Cabernet Merlot hold 49.4% of beverage category demand in 2026 because multi-cultivar red wine assemblage balances tannin structure, color stability and vintage consistency.
Which packaging format segment leads the blend market?
Retail Consumer Packages Glass and Foil represent 59.8% of the packaging format category in 2026 as dark glass bottles and degassing foil pouches protect volatile aromas and polyphenols.
Which country has a notable growth outlook during the assessment period?
Mexico leads national expansion projections at an 8.8% CAGR through 2036, driven by Baja California multi-varietal winemaking and rapid urban espresso cafe growth.
Who are the key players in the market?
DSM-Firmenich AG and Kerry Group plc with Givaudan SA supply beverage flavor modulation and botanical extracts. Symrise AG and International Flavors and Fragrances Inc. with Archer Daniels Midland Company and Cargill Incorporated provide natural beverage bases and acidulants. Tate and Lyle plc and Ingredion Incorporated with Roquette Freres SA supply mouthfeel stabilizers.
Preview the report firsthand - request a free sample
Get SampleGet the brochure for pricing and purchase details.
Get PDF
