The Drum To Hopper Blends Premix Market is estimated to be valued at USD 931.7 million in 2025 and is projected to reach USD 1902.5 million by 2035, registering a compound annual growth rate (CAGR) of 7.4% over the forecast period.
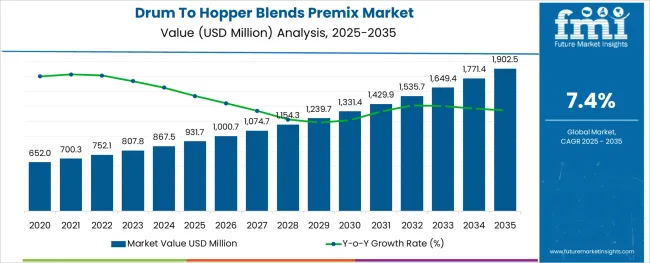
The Drum To Hopper Blends Premix Market is gaining traction as industries prioritize clean-label nutrition, production efficiency, and micronutrient consistency in large-scale manufacturing. The increasing emphasis on batch uniformity, contamination control, and process simplification has driven adoption across both food and pharmaceutical supply chains. With fortified product demand rising globally, manufacturers are favoring premixes that offer precise dosing and quick dissolution during formulation.
Innovations in drum-to-hopper delivery systems are enabling direct use of premixes without manual intervention, minimizing product loss and labor exposure. Advances in ingredient encapsulation and flow optimization are improving the shelf life and compatibility of premixes with sensitive production environments.
Regulatory focus on nutritional labeling, combined with cost optimization needs in mass production facilities, is driving preference for streamlined premix formats. As global nutritional programs and clean manufacturing standards evolve, the market is expected to experience sustained adoption in fortified foods, supplements, and functional beverages across emerging and developed regions.
The market is segmented by Ingredient Type, Form, and Application and region. By Ingredient Type, the market is divided into Vitamin Premix, Mineral Premix, Nucleotides Premixes, Amino Acids Premixes, Enzymes, Coccidiostats, Probiotics, Prebiotics, Multigrain Premix, Omega 3 Fatty Acids, Excipients, and Gums. In terms of Form, the market is classified into Powder and Liquid. Based on Application, the market is segmented into Food Sector, Dietary Supplements, Pharma OTC Drugs, and Pet Food. Regionally, the market is classified into North America, Latin America, Western Europe, Eastern Europe, Balkan & Baltic Countries, Russia & Belarus, Central Asia, East Asia, South Asia & Pacific, and the Middle East & Africa.
The market is segmented by Ingredient Type, Form, and Application and region. By Ingredient Type, the market is divided into Vitamin Premix, Mineral Premix, Nucleotides Premixes, Amino Acids Premixes, Enzymes, Coccidiostats, Probiotics, Prebiotics, Multigrain Premix, Omega 3 Fatty Acids, Excipients, and Gums. In terms of Form, the market is classified into Powder and Liquid. Based on Application, the market is segmented into Food Sector, Dietary Supplements, Pharma OTC Drugs, and Pet Food. Regionally, the market is classified into North America, Latin America, Western Europe, Eastern Europe, Balkan & Baltic Countries, Russia & Belarus, Central Asia, East Asia, South Asia & Pacific, and the Middle East & Africa.
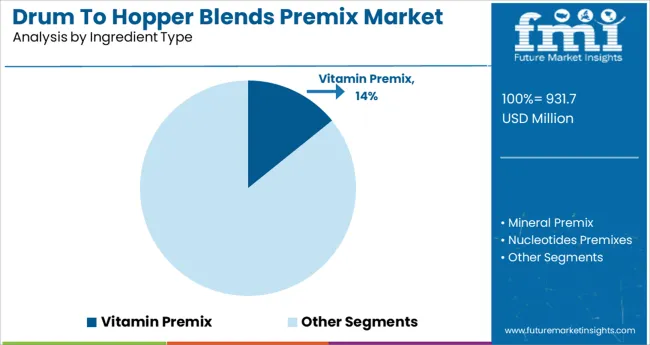
Vitamin premix is projected to contribute 14.2% of total revenue within the ingredient type category in 2025, positioning it as a key component in drum to hopper blending operations. This is being driven by growing demand for micronutrient-fortified foods and supplements across health-conscious consumer segments.
Vitamin premixes offer the advantage of delivering consistent, balanced nutrition across multiple SKUs while simplifying formulation logistics for manufacturers. Their compatibility with high-throughput blending systems ensures homogeneity and reduces variability across batches.
In regulatory-driven sectors such as infant nutrition, clinical foods, and sports supplements, the precision of vitamin dosing via premix formulations is critical to maintaining compliance and product efficacy. The growing complexity of nutrient profiles required in modern functional foods continues to solidify the relevance and demand for vitamin premix solutions in large-scale manufacturing environments.
drum-to-hopper-blends-premix-market-analysis-by-form
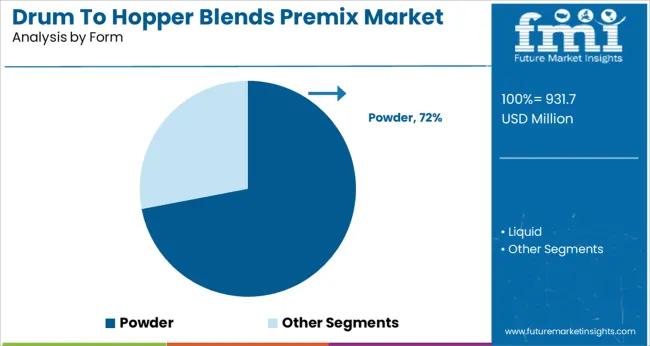
The powder segment is expected to dominate the form category with a 72.0% share in 2025, making it the most widely adopted format in drum to hopper blends premix operations. This dominance is supported by the ease of transportation, stability, and fast solubility that powder forms offer across diverse processing lines.
Powders enable efficient bulk handling and controlled flow rates, making them highly compatible with automated hopper-fed systems used in modern food and pharmaceutical manufacturing. Additionally, powders allow for concentrated nutrient loading and reduced moisture content, which enhances shelf stability and packaging efficiency.
Manufacturers favor powders for their versatility in cold and hot blending processes and their adaptability to customized ingredient matrices. The segment’s continued leadership is reinforced by the push for cost-effective, scalable, and contamination-resistant formulation inputs in high-volume production environments.
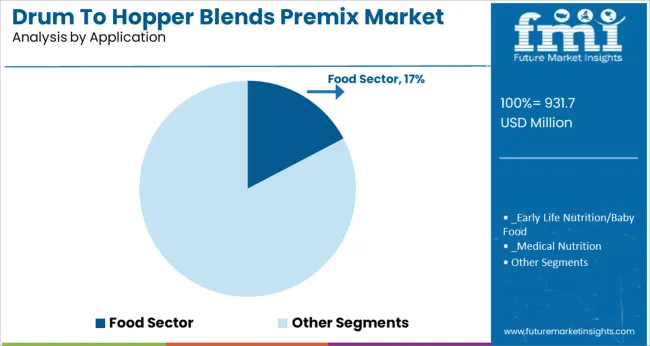
The food sector is anticipated to account for 17.3% of market revenue in 2025, positioning it as a leading application in the drum to hopper blends premix market. This is driven by increasing demand for fortified bakery, dairy, confectionery, and ready-to-eat products that meet evolving consumer health and wellness expectations. Food manufacturers are leveraging premix solutions to streamline nutrient incorporation without altering core product textures, flavors, or process flows.
The food sector’s emphasis on label claims such as vitamin-rich, fortified, and immunity-boosting has prompted widespread use of premix formulations. Regulatory compliance around fortification and clean-label declarations has further intensified the adoption of standardized premix systems in production lines.
Drum to hopper delivery supports hygiene, traceability, and efficient raw material use, aligning with the operational and sustainability objectives of food producers globally. The segment's leadership is expected to strengthen as nutritional enhancement becomes integral to competitive product positioning in both retail and institutional food sectors.
As per the report, demand for drum-to-hopper blends is slated to increase at a 7.4% CAGR over the forecast period, in comparison to the 5.6% CAGR registered between 2020 to 2024.
A drum-to-hopper blend is a mixture of minerals, vitamins, amino acids, and antibiotics, among other things. It is used as a dietary supplement and in food fortification.
Malnutrition and severe health problems are caused by a lack of micronutrients in the diet. It improves the nutritional value of food and beverages while also providing essential nutrition to the body.
It also aids in weight management. The vitamin D present in drum-to-hopper blends improves metabolism and calcium absorption in the body. Rising malnutrition rates and increased use of fortified food products are expected to boost the market over the forecast period.
Factors such as rising demand for functional foods and beverages, as well as increased availability of nutraceuticals in various forms, will drive the drum-to-hopper blends market d. In addition to this, changing consumption patterns regarding food, along with high demand for supplements as a staple will spur demand in the market.
In addition, rising demand for customized premixes and a greater emphasis by various government bodies on raising awareness about the benefits of supplements will drive sales in the market.
The demand for fortification of food is increasing significantly owing to the high prevalence of diseases due to the lack of micronutrients in daily diets.
Several food products such as flour, sugar, maize, wheat, and vegetable oils are generally fortified with vitamins and minerals to improve health, which has driven demand for drum-to-hopper blends in recent years.
Consumption of mineral and nutrient premix, like amino acid-based infant formula, is also on the rise, owing to consumers' growing preference for nutritional fortification of baby food and infant formula.
Many children between the ages of 2-12 suffer from anemia, with iron deficiency being the most common cause. Consumers are seeking nutritional food products to enhance their daily intake of vitamins and minerals, which is expected to have a direct impact on the growth of the drum-to-hopper blend market.
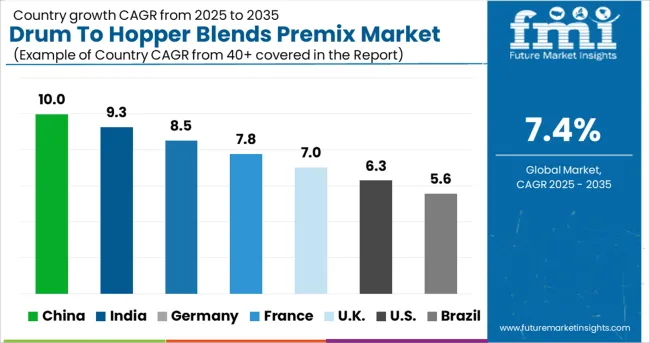
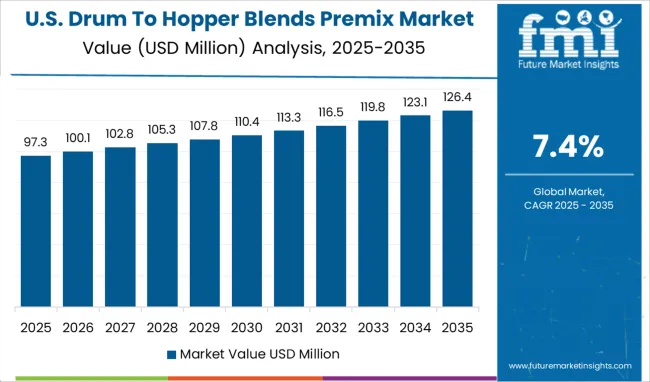
High Preference for Fortified Packaged Food in the USA Will Fuel Sales
Drum to hopper blends sales in the USA are expected to hold 65% total North America drum to hopper blends market over the forecast period. Increasing demand and consumption of convenience products with good taste and health benefits are expected to drive the application of drums to hopper blends.
Expansion in the Food & Beverage Sector in the UK is Spurring Demand for Drum to Hopper Blends
Demand for drum-to-hopper blends in the UK is forecast to increase at a 9.7% CAGR over the assessment period. Companies all over the UK are forming alliances and merging to gain a larger market share. They are investing more in Research and Development projects and providing products that are cutting-edge in terms of technology and efficiency.
Per capita spending on healthy and nutritious food is rising across the UK, and people's desire to stay fit has resulted in high demand for healthy and nutritious food products.
Sales of Drum and Hopper Blend Powders Will Increase
Based on form, demand in the powder segment will increase at a 7.4% CAGR over the forecast period. These products are easy to store and use and are convenient and easy to transport as well. Powdered blend sales are expected to remain high as compared to liquid blends.
Amino Acid-based Blends are Being Incorporated into the Food and Beverage Sector
In terms of ingredients, total sales in the amino acid segment are expected to account for more than 33% of the market share from 2025 to 2035. Vitamins and minerals will continue to have significant market revenue shares. Nucleotide sales will grow at the fastest rate in the market in terms of value through 2035.
Demand from the Food and Beverage Sector Will Boost Drum to Hopper Blends Premix Sales
By application, demand in the food and beverage sector is forecast to increase at a 6.6% CAGR over the forecast period owing to increasing preference for functional foods and highly nutritious ready-to-eat packaged food products across emerging economies.
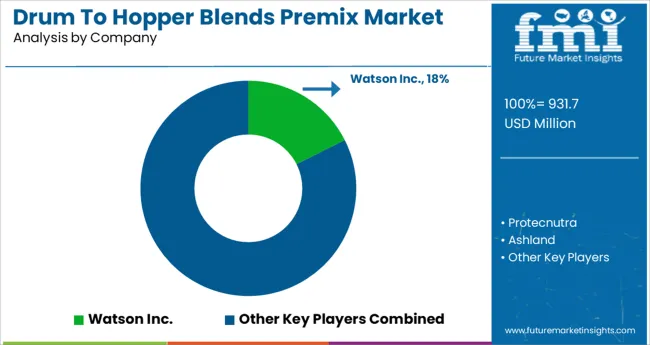
Product innovation and strategic mergers and acquisitions are some of the key strategies that are being adopted by drum-to-hopper blends manufacturers. They are also investing in research and development and in partnerships with healthcare research institutes to improve their product offerings.
For instance,
| Attributes | Details |
|---|---|
| Estimated Market Size (2025) | USD 931.7 million |
| Projected Market Valuation (2035) | USD 1902.5 million |
| Value-based CAGR (2025 to 2035) | 7.4% |
| Forecast Period | 2025 to 2035 |
| Historical Data Available for | 2020 to 2025 |
| Market Analysis | million for Value and Million. Sq. M. for Volume |
| Key Regions Covered | North America; Latin America; Europe; East Asia; South Asia; and the Middle East & Africa |
| Key Countries Covered | The USA, Brazil, Mexico, Germany, the UK, China, India, Japan, Australia, and GCC Countries |
| Key Segments Covered | Form, Ingredient, Application, Function, Region |
| Key Companies Profiled | Glanbia Plc; Archer Daniels Midland Company; Koninklijke DSM N.V.; Jubilant Life Sciences; BASF SE; Farbest Brands; Fenchem Biotek Ltd.; Prinova Group LLC; Watson Inc.; Barentz International; LycoRed Ltd.; SternVitamin GmbH; Hexagon Nutrition Pvt. Ltd. |
| Report Coverage | Market Forecast, Company Share Analysis, Competition Intelligence, Drivers, Restraints, Opportunities and Threats Analysis, Market Dynamics and Challenges, and Strategic Growth Initiatives |
The global drum to hopper blends premix market is estimated to be valued at USD 931.7 million in 2025.
It is projected to reach USD 1,902.5 million by 2035.
The market is expected to grow at a 7.4% CAGR between 2025 and 2035.
The key product types are vitamin premix, mineral premix, nucleotides premixes, amino acids premixes, enzymes, coccidiostats, probiotics, prebiotics, multigrain premix, omega 3 fatty acids, excipients and gums.
powder segment is expected to dominate with a 72.0% industry share in 2025.


Full Research Suite comprises of:
Market outlook & trends analysis
Interviews & case studies
Strategic recommendations
Vendor profiles & capabilities analysis
5-year forecasts
8 regions and 60+ country-level data splits
Market segment data splits
12 months of continuous data updates
DELIVERED AS:
PDF EXCEL ONLINE
Drum Melters Market Size and Share Forecast Outlook 2025 to 2035
Drum Filling Machine Market Size and Share Forecast Outlook 2025 to 2035
Drum Pump Market Growth - Trends & Forecast 2025 to 2035
Drum Liner Market Analysis - Size, Share & Industry Forecast 2025 to 2035
Breaking Down Market Share in the Drum Liner Industry
Drum Handling Equipment Market
Drum Pulper Market
Drum Funnel Market
Drum Plugs Market
Drum to Hopper Blends Market Insights - Precision Mixing & Growth 2025 to 2035
Steel Drum Market Size and Share Forecast Outlook 2025 to 2035
Steel Drums & IBCs Market Size and Share Forecast Outlook 2025 to 2035
Steel Drum Industry Analysis in Southeast Asia Size and Share Forecast Outlook 2025 to 2035
Fiber Drums Market Analysis - Size, Share, and Forecast 2025 to 2035
Competitive Overview of Steel Drum Market Share
Examining Market Share Trends in Steel Drums and IBCs Industry
Competitive Landscape of Fiber Drums Market Share
Japan Steel Drum Market Analysis – Trends & Forecast 2023-2033
Korea Steel Drum Market Growth – Trends & Forecast 2023-2033
Western Europe Steel Drum Market Insights – Trends & Forecast 2023-2033

Thank you!
You will receive an email from our Business Development Manager. Please be sure to check your SPAM/JUNK folder too.
Chat With
MaRIA