Bonded Abrasives Market Size and Share Forecast Outlook 2025 to 2035

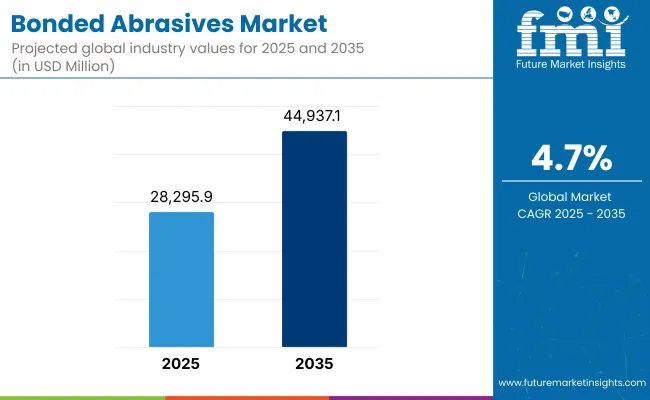
The global bonded abrasives market is projected to expand from USD 28,295.9 million in 2025 to USD 44,937.1 million by 2035, registering a compound annual growth rate (CAGR) of 4.7% during the forecast period. Growth is expected to be supported by continued demand from automotive manufacturing, general metalworking, construction, and precision engineering.
Quick Stats for the Bonded Abrasives Market

  • Industry Value (2025): USD 28,295.9 million
  • Forecast Value (2035): USD 44,937.1 million
  • Forecast CAGR: 4.7%
  • Leading Segment in 2025: Aluminum Oxide (38%)
  • Key Growth Region: Asia-Pacific
  • Top Key Players: 3M, Saint-Gobain (Norton), Tyrolit, Bosch, CUMI

Bonded Abrasives Market Industry Value Analysis

Attributes Key Insights
Estimated Value (2025) USD 28,295.9 million
Projected Size (2035) USD 44,937.1 million
Value-based CAGR (2025 to 2035) 4.7%

Bonded abrasives are used in grinding, cutting, and finishing operations where material removal, surface preparation, or edge profiling is required. These tools are composed of abrasive grains held together by a bonding agent and are applied across processes that demand consistency and high dimensional accuracy. Industries such as aerospace, foundry, and toolmaking rely on bonded abrasives for manufacturing and refurbishing components under tight tolerances.

Grinding wheels and discs continue to be the most utilized bonded abrasive products, favored for their adaptability in both automated and manual operations. These are deployed in tasks such as gear finishing, valve seat machining, weld blending, and die preparation. The automotive industry uses bonded abrasives for deburring engine parts and honing transmission components, while construction applications include concrete cutting and masonry surface leveling.

Technological improvements in abrasive composition are enhancing product life, heat resistance, and material compatibility. Resin bonds, vitrified bonds, and rubber bonds are being engineered to match specific performance parameters. For example, hybrid bond structures combining metal and resin matrices are used to improve wheel stability and cutting efficiency in CNC grinding systems. Manufacturers are also focusing on reduced vibration and increased porosity to aid coolant flow and chip evacuation during high-speed operations.

Environmental, Health, and Safety (EHS) standards are influencing product innovation. Low-dust formulations and bonded abrasives with reduced volatile organic compounds (VOCs) are being adopted to improve workplace safety. Several global manufacturers are pursuing ISO 14001 certifications and investing in eco-conscious manufacturing processes.

Global demand is being influenced by increased automation in fabrication and the need for advanced materials processing, particularly in electric vehicle components and high-strength alloys. As machining complexity rises, bonded abrasives are playing a critical role in ensuring quality, repeatability, and operational efficiency across precision-driven industries.
Analyzing Bonded Abrasives Market by Top Investment Segments

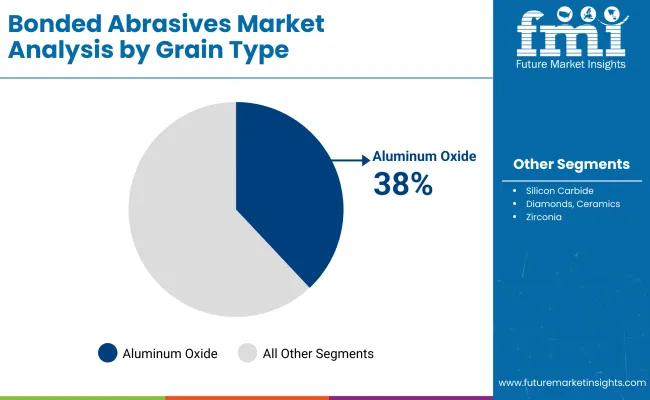
Aluminum oxide is expected to dominate grain type usage due to its durability, cost-effectiveness, and broad applicability in metal grinding and surface finishing

Aluminum oxide is projected to hold approximately 38% of the global bonded abrasive market share in 2025 and is expected to grow at a CAGR of 4.6% through 2035. It is widely used in grinding wheels, sharpening stones, and cutting discs across industries that process ferrous metals. Known for its hardness and long service life, aluminum oxide is preferred in both rough and precision grinding operations.

The grain type is extensively used in the fabrication of components for automotive parts, tools, and industrial machinery. Manufacturers are enhancing performance by incorporating heat-treated and friable variations to improve cutting efficiency and reduce thermal damage on workpieces.
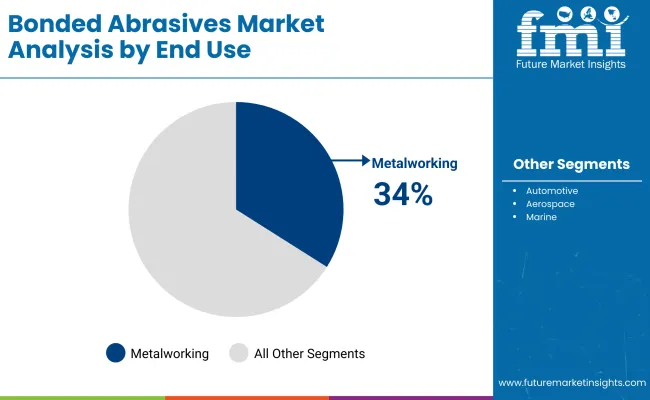
Metalworking is projected to lead end-use demand with consistent application in fabrication, finishing, and surface preparation operations

The metalworking segment is estimated to account for approximately 34% of the global bonded abrasive market share in 2025 and is expected to grow at a CAGR of 4.8% through 2035. Bonded abrasives are used for grinding, deburring, polishing, and shaping metal components in manufacturing, welding, and heavy fabrication industries.

Demand is particularly strong in Asia-Pacific, driven by ongoing industrial expansion, increasing investment in capital goods, and infrastructure development. As end users seek to improve productivity and surface quality while minimizing tool wear, the adoption of advanced bonded abrasives continues to rise. The metalworking sector remains a primary consumer of abrasives, especially in operations requiring high material removal rates and dimensional accuracy.

Semi-annual market update

The annual growth rates of the bonded abrasives market from 2025 to 2035 are illustrated below in the table. Starting with the base year 2024 and going up to the present year 2025, the report examined how the industry growth trajectory changes from the first half of the year, i.e. January through June (H1) to the second half consisting of July through December (H2). This gives stakeholders a comprehensive picture of the sector’s performance over time and insights into potential future developments.

The table provided shows the growth of the sector for each half-year between 2024 and 2025. The market was projected to grow at a CAGR of 3.6% in the first half (H1) of 2024. However, in the second half (H2), there is a noticeable increase in the growth rate.

Particular Value CAGR
H1(2024 to 2034) 3.6%
H2(2024 to 2034) 3.8%
H1(2025 to 2035) 3.9%
H2(2025 to 2035) 4.1%

Moving into the subsequent period, from H1 2024 to H2 2024, the CAGR is projected as 3.9% in the first half and grow to 4.1% in the second half. In the first half (H1) and second half (H2), the market witnessed an increase of 20 BPS each.

Key Industry Highlights

Need for bonded abrasives in the modern era

Modern civilization would not be possible without bonded abrasive products. Bonded abrasive products have a three-dimensional structure consisting of abrasive particles, a bonding agent, and porosity. Each of these three elements may be varied in amount in a precisely controlled fashion to alter the behavioral characteristics of the abrasive article in predictable ways.

Bonded abrasive articles may take the form of sticks, wheels, wheel segments, and variously shaped cylinders, cones, balls, etc., to which are affixed metal rods for insertion into chucking devices of power tools. A bonded abrasive article, being three-dimensional in concept, operates sacrificially during use, with retention of sharpness until all the usable portion has been worn away. In contrast, a coated abrasive product must be discarded when its single abrasive layer loses its sharpness.

Several technological developments is also playing pivotal role in the development of bonded abrasives industry. Bonded abrasives are well suited for diverse grinding applications including ball grinding & lapping, crankshaft & camshaft grinding, gear grinding, centerless grinding, and others. All these factors are in demand across several industries, thus amplifying the demand for bonded abrasives.

Technological advancement associated with production of bonded abrasives

Growth in industries such as automotive, aerospace, marine, and construction have demanded for advanced bonded abrasives. Key players in the bonded abrasive are adopting advanced production technologies to improve the grinding efficiency. For instance, Norton Quantum uses a new generation of alumina grain chemistry and shape developed from the Norton’s patented Seeded-Gel Technology. With innovative organic and vitrified bonds specially developed to enhance grain performance, Norton Quantum Wheels provide the fastest and finest grinding in the industry.

This revolutionary ceramic grain multiplies the cutting efficiency by controlling the grain breakdown at the micrometric level. Norton Quantum is a versatile technology that is ideal for low, medium and high force applications on materials ranging from cast iron to stainless steel as well as hard to grind inconel and titanium. These advanced bonded abrasives are gaining importance across niche applications such as steel roller grinding, micro-sized automotive part grinding, and bearing internal & race grinding.

Ceramic based bonded abrasives offers high length-width ratio compared to other abrasives, thus making it suitable for precision grinding application across diverse industrial sectors. Ceramic based bonded abrasives are also proven to offer sharper cutting edge and better metal removal capability making it ideal for high-efficiency and high-precision grinding applications.

Metal removal rate is crucial as high metal removal rate dramatically reduces the cycle time. For instance, bonded abrasives offered by Saint-Gobain are capable of reducing the cycle times by 50%. These bonded abrasives also offer longer wheel life thus minimizing the cost of frequent changes.

High demand for bonded abrasives in aerospace industry

For aerospace manufacturers, there is constant pressure to innovate, building safer, and more efficient aircraft. World demand for commercial aircraft is at record levels. Industry trends call for more complex, high-cost parts. Processing these parts and materials is costly. Bonded abrasive products are used to improve the quality of aircraft finished parts, minimize abrasive costs, and reduce production time. Bonded abrasives are gaining popularity in the aerospace industry for blending and polishing operations.

Aerospace industry relies on bonded abrasives as aerospace parts such as aircraft engine, turbine blades, and other heat-sensitive parts require blending and polishing. Light grinding and polishing applications are usually carried with use of bonded abrasives and several advancements have been made in the bonded abrasives for aerospace applications.

For example, Ni-Cr Steels and Titanium based bonded abrasives offered by Marrose Abrasives offer low vibration at the hand/arm of the operator, are easy to use giving controlled metal removal and low risk of damage to the turbine blade. Surface finished is improved with a higher bearing area compared to conventional grinding with vitrified or CBN tools, helping to reduce induced grinding stresses prior to subsequent surface treatments such as blasting or plating.

Removing casting gates and cutting stock to length is still a manual practice for many aerospace parts manufacturers. However, advancements in the abrasives industry particularly bonded abrasives has reduced the manual practice. While grinding is already the standard best practice for surface finishing, however advancement in surface finishing abrasive are making high MRR achievable to manufacture precise profiles of high nickel alloy, titanium aluminide, and ceramic parts at tighter tolerances, reduced cycle times, and increased throughputs compared to machining.

Aerospace metal and composite parts are highly susceptible major mismatch, edge break, and deburr. These usually arise during finishing and grinding process. Adoption of ceramic based bonded abrasives are proven to minimize these risk and provide smoot aerospace parts. All these factors are collectively driving the demand for bonded abrasives globally.

Recent development of abrasive machining processes enhanced with non-newtonian fluids

Abrasive machining processes have long been integral to various manufacturing industries, enabling precise material removal and surface finishing. In recent years, the integration of non-Newtonian fluids has emerged as a promising strategy to enhance the performance and efficiency of these processes.

With the continuous development of aerospace and other fields, the processing of high-performance components has become a focus of scholarly research, with both traditional and non-traditional machining methods playing increasingly important roles. Abrasive machining processes, as one of the non-traditional methods, have long been integral to precision manufacturing techniques, including lapping and polishing, playing a crucial role in achieving high-quality surfaces.

Typically, these methods utilize abrasive particles suspended in a carrier medium to meticulously remove material from a workpiece. Despite their effectiveness, traditional abrasive machining approaches encounter challenges when striving for specific surface characteristics, particularly in intricate contours, narrow spaces, and inaccessible regions.

These limitations arise due to the inherent nature of abrasive machining, where achieving uniform material removal across diverse workpiece geometries proves challenging. As manufacturing demands evolve towards greater intricacy and miniaturization, there is an increasing need for innovative solutions that can address these challenges and enhance the capabilities of abrasive machining processes.

The integration of non-Newtonian fluids into abrasive machining processes represents a significant advancement in addressing the challenges inherent in traditional methods. Unlike Newtonian fluids, which follow linear viscosity patterns, non-Newtonian fluids exhibit diverse rheological behaviors such as viscoelasticity and thixotropy.

These unique characteristics enable them to respond dynamically to shear forces, adapting their viscosity accordingly. As a result, non-Newtonian fluids can efficiently carry and distribute abrasive particles during machining operations. This dynamic behavior enhances the fluid’s ability to penetrate intricate geometries, reach challenging areas, and optimize material removal rates.

Sustainability issue associated with use of bonded abrasives is expected to hamper the growth

The use of bonded abrasives poses sustainability challenges, primarily due to the environmental impact of their production and disposal. These abrasives often consist of synthetic materials such as resins, ceramics, and adhesives, which can release harmful substances during manufacturing.

The energy-intensive production processes contribute significantly to carbon emissions, making it difficult for manufacturers to meet increasingly stringent environmental regulations. Additionally, the extraction and processing of raw materials, such as aluminum oxide and silicon carbide, can have adverse environmental consequences, including resource depletion and habitat destruction.

The disposal of used bonded abrasives adds to sustainability concerns. Most abrasives are not biodegradable, and improper disposal can lead to landfill accumulation. Residual materials, such as metal dust and synthetic resins, may pose risks of soil and water contamination.

While recycling options exist, they remain limited due to the complex composition of bonded abrasives, making the separation and reuse of materials challenging. These sustainability challenges have driven demand for eco-friendly alternatives, pushing manufacturers to develop abrasives with recyclable materials or reduced environmental footprints. However, the transition to sustainable solutions often comes with increased costs, potentially impacting market growth and adoption rates.

Market Concentration

Tier 1 companies comprise players with a revenue of above USD 1,000 million capturing a significant share of 40-45% in the global market. These players are characterized by high production capacity and a wide product portfolio. These leaders are distinguished by their extensive expertise in manufacturing and reconditioning across multiple bonded abrasives applications and a broad geographical reach, underpinned by a robust consumer base. Prominent companies within Tier 1 include Saint-Gobain, 3M, Carborundum Universal Limited, and other players.

Tier 2 companies include mid-size players with revenue of below USD 1,000 million having a presence in specific regions and highly influencing the local industry. These are characterized by a strong presence overseas and strong industry knowledge. These players have good technology and ensure regulatory compliance but may not have advanced technology and wide global reach. Prominent companies in tier 2 include United Abrasives, Empire Abrasives, Karbosan, SurfacePrep, and other player.

Country-wise Insights

The section below covers the industry analysis for bonded abrasives demand in different countries. The demand analysis on key countries in several regions of the globe, including North America, Latin America, East Asia, South Asia Pacific, Western Europe, Eastern Europe, Middle East, and Africa is provided.

China will hold 68.9% in East Asia due to easy access to critical raw materials such as aluminum oxide, silicon carbide, and zirconia, which are essential for manufacturing bonded abrasives. The USA will capture 80.1% in North America. The USA boasts a robust industrial sector, including automotive, aerospace, defense, and heavy machinery manufacturing. These industries require bonded abrasives for applications such as grinding, cutting, and polishing, driving significant demand within the country.

Germany will lead Western Europe with 31.6%. German industries are renowned for adopting advanced manufacturing technologies and automation. This drives the demand for high-quality and precision-engineered bonded abrasives, which are integral to achieving exacting manufacturing standards.
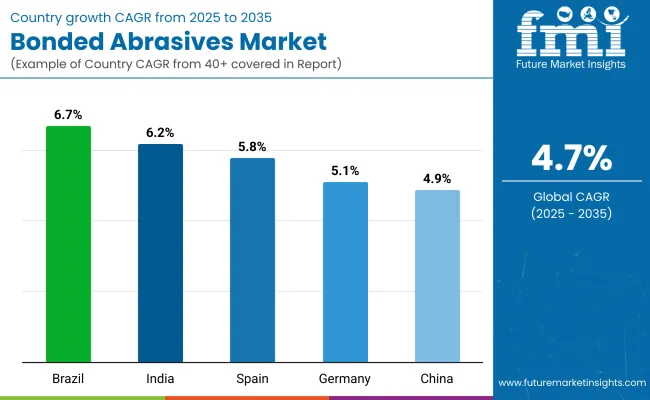
Countries Value CAGR (2025 to 2035)
Spain 5.8%
India 6.2%
Brazil 6.7%
Germany 5.1%
China 4.9%

Its vast network of factories and industries drives the demand for bonded abrasives used in cutting, grinding, and polishing

The sale of bonded abrasives in China is projected to reach USD 7,926.2 million and is estimated to grow at an 4.9% CAGR by 2035.

China's position as a global manufacturing hub is unparalleled, making it a cornerstone for the bonded abrasives market. The country boasts the largest network of factories and industrial production facilities, producing everything from consumer goods to heavy machinery.

This extensive manufacturing base fuels a continuous demand for bonded abrasives, which are integral in processes like cutting, grinding, polishing, and shaping materials. Whether in the production of precision components or large-scale industrial equipment, bonded abrasives play a critical role in ensuring quality and efficiency.

Increasing emphasis on sustainable manufacturing, USA companies have adopted environmentally friendly practices in bonded abrasives production

The sales of bonded abrasives in the USA are projected to reach USD 7,234.9 million by 2035.

In recent years, USA companies in the bonded abrasives industry have placed a strong emphasis on sustainability, driven by both regulatory requirements and growing consumer demand for environmentally friendly products. As environmental concerns rise globally, there has been a shift toward adopting green manufacturing practices, such as reducing energy consumption, minimizing waste, and using eco-friendly raw materials in the production of bonded abrasives. This commitment to sustainability not only helps meet stricter environmental regulations but also resonates with consumers who increasingly prioritize sustainable practices in the products they use.

Germany is often regarded as the "industrial powerhouse" of Europe, with well-established sectors such as automotive, aerospace, heavy machinery, and precision engineering

The sale of bonded abrasives in Germany is projected to reach USD 2,215.2 million and grow at a CAGR of 5.1% by 2035.

Germany’s commitment to innovation and quality in manufacturing has positioned the country as a leader in these sectors. The country’s automotive giants, aerospace firms, and precision engineering companies demand high-performance bonded abrasives that ensure the accuracy and durability of parts and components. This continuous demand for quality abrasives drives the growth of the bonded abrasives market in Germany, making it a dominant player in the European region. The synergy between Germany’s industrial capabilities and the performance of bonded abrasives is a key factor in the country’s leadership in the market.

Competitive Landscape

The bonded abrasives market is evolving with key players focusing on advanced technologies to meet the precision demands of industries like automotive, aerospace, and manufacturing. Innovations such as gear grinding abrasives, offering superior form holding and reduced burn risk, are positioning companies to deliver high-quality solutions.

Additionally, expedited delivery services for custom-engineered grinding wheels are addressing the growing need for faster lead times, improving customer satisfaction. The development of high-performance materials, such as alumina-based grains, is also helping companies enhance cutting performance, thermal stability, and durability, ensuring they stay competitive in an increasingly demanding market.

  • In April 2024, Weiler Abrasives was reported to have introduced a new gear grinding abrasive technology alongside the launch of its Precision Express service program. The gear grinding products were designed to deliver superior form holding, reduced burn risk, and consistent part quality in high-precision applications. The Precision Express program was developed to provide expedited delivery of custom-engineered vitrified grinding wheels, enabling faster lead times for customers in the automotive, aerospace, and general manufacturing sectors.
  • In January 2024, Saint-Gobain Specialty Grains and Powders was reported to have launched Lumeos™, a new platform of high-performance alumina-based grains for bonded abrasive applications. The materials were engineered to deliver improved cutting performance, thermal stability, and durability across precision grinding and heavy-duty material removal operations. It was stated that Lumeos™ supports next-generation bonded abrasive formulations and meets the evolving demands of advanced machining and finishing technologies.

Companies

  • 3M
  • Saint‑Gobain (Norton)
  • Tyrolit
  • Bosch
  • Klingspor
  • SAK Abrasives
  • Nippon Resibon
  • CUMI
  • ARTIFEX Dr. Lohmann
  • Fujimi Inc.

Key Segmentation

By Product Type:

The Product Type segment is further categorized into Cone Bonded Abrasives, Mounted Point Bonded Abrasives, Chop Saw Blade Bonded Abrasives, Grinding Disc Bonded Abrasives, and Others.

By Grain Type:

The Grain Type segment is classified into cBN, Silicon Carbide, Diamonds, Ceramics, Aluminum Oxide, Zirconia, and Combination Grains.

By End Use:

The End Use segment is classified into Automotive, Metal Working, Aerospace, Marine, Construction, and Other Industries.

By Region:

Regions considered in the study include North America, Latin America, Western Europe, Eastern Europe, East Asia, South Asia & Pacific, and the Middle East and Africa.

Table of Content

  1. Executive Summary
  2. Industry Introduction, including Taxonomy and Market Definition
  3. Market Trends and Success Factors, including Macro-economic Factors, Market Dynamics, and Recent Industry Developments
  4. Global Market Demand Analysis 2020 to 2024 and Forecast 2025 to 2035, including Historical Analysis and Future Projections
  5. Pricing Analysis
  6. Global Market Analysis 2020 to 2024 and Forecast 2025 to 2035
    • Product Type
    • Grain Type
    • End Use
  7. Global Market Analysis 2020 to 2024 and Forecast 2025 to 2035, By Product Type
    • Cone Bonded Abrasives
    • Mounted Point Bonded Abrasives
    • Chop Saw Blade Bonded Abrasives
    • Grinding Disc Bonded Abrasives
    • Others
  8. Global Market Analysis 2020 to 2024 and Forecast 2025 to 2035, By Grain Type
    • cBN
    • Silicon Carbide
    • Diamonds
    • Ceramics
    • Aluminum Oxide
    • Zirconia
    • Combination Grains
  9. Global Market Analysis 2020 to 2024 and Forecast 2025 to 2035, By End Use
    • Automotive
      • Polishing
      • Cutting
      • Grinding
      • Others
    • Metal Working
      • Polishing
      • Cutting
      • Grinding
      • Others
    • Aerospace
      • Polishing
      • Cutting
      • Grinding
      • Others
    • Marine
      • Polishing
      • Cutting
      • Grinding
      • Others
    • Construction
      • Polishing
      • Cutting
      • Grinding
      • Others
    • Other Industries
  10. Global Market Analysis 2020 to 2024 and Forecast 2025 to 2035, By Region
    • North America
    • Latin America
    • Western Europe
    • South Asia
    • East Asia
    • Eastern Europe
    • Middle East & Africa
  11. North America Sales Analysis 2020 to 2024 and Forecast 2025 to 2035, by Key Segments and Countries
  12. Latin America Sales Analysis 2020 to 2024 and Forecast 2025 to 2035, by Key Segments and Countries
  13. Western Europe Sales Analysis 2020 to 2024 and Forecast 2025 to 2035, by Key Segments and Countries
  14. South Asia Sales Analysis 2020 to 2024 and Forecast 2025 to 2035, by Key Segments and Countries
  15. East Asia Sales Analysis 2020 to 2024 and Forecast 2025 to 2035, by Key Segments and Countries
  16. Eastern Europe Sales Analysis 2020 to 2024 and Forecast 2025 to 2035, by Key Segments and Countries
  17. Middle East & Africa Sales Analysis 2020 to 2024 and Forecast 2025 to 2035, by Key Segments and Countries
  18. Sales Forecast 2025 to 2035 by Product Type, Grain Type, and End Use for 30 Countries
  19. Competition Outlook, including Market Structure Analysis, Company Share Analysis by Key Players, and Competition Dashboard
  20. Company Profile
    • United Abrasives
    • Saint-Gobain
    • Empire Abrasives
    • Karbosan
    • SurfacePrep
    • 3M
    • Carborundum Universal Limited
    • Andre Abrasive Articles
    • Imerys
    • Weiler Abrasives
    • Other Key Players

List of Tables

  • Table 1: Global Market Value (USD Million) Forecast by Region, 2020 to 2035
  • Table 2: Global Market Volume (000 Tons) Forecast by Region, 2020 to 2035
  • Table 3: Global Market Value (USD Million) Forecast by Product Type, 2020 to 2035
  • Table 4: Global Market Volume (000 Tons) Forecast by Product Type, 2020 to 2035
  • Table 5: Global Market Value (USD Million) Forecast by Bonding Agent, 2020 to 2035
  • Table 6: Global Market Volume (000 Tons) Forecast by Bonding Agent, 2020 to 2035
  • Table 7: Global Market Value (USD Million) Forecast by Applications, 2020 to 2035
  • Table 8: Global Market Volume (000 Tons) Forecast by Applications, 2020 to 2035
  • Table 9: Global Market Value (USD Million) Forecast by End-Use Industry, 2020 to 2035
  • Table 10: Global Market Volume (000 Tons) Forecast by End-Use Industry, 2020 to 2035
  • Table 11: North America Market Value (USD Million) Forecast by Country, 2020 to 2035
  • Table 12: North America Market Volume (000 Tons) Forecast by Country, 2020 to 2035
  • Table 13: North America Market Value (USD Million) Forecast by Product Type, 2020 to 2035
  • Table 14: North America Market Volume (000 Tons) Forecast by Product Type, 2020 to 2035
  • Table 15: North America Market Value (USD Million) Forecast by Bonding Agent, 2020 to 2035
  • Table 16: North America Market Volume (000 Tons) Forecast by Bonding Agent, 2020 to 2035
  • Table 17: North America Market Value (USD Million) Forecast by Applications, 2020 to 2035
  • Table 18: North America Market Volume (000 Tons) Forecast by Applications, 2020 to 2035
  • Table 19: North America Market Value (USD Million) Forecast by End-Use Industry, 2020 to 2035
  • Table 20: North America Market Volume (000 Tons) Forecast by End-Use Industry, 2020 to 2035
  • Table 21: Latin America Market Value (USD Million) Forecast by Country, 2020 to 2035
  • Table 22: Latin America Market Volume (000 Tons) Forecast by Country, 2020 to 2035
  • Table 23: Latin America Market Value (USD Million) Forecast by Product Type, 2020 to 2035
  • Table 24: Latin America Market Volume (000 Tons) Forecast by Product Type, 2020 to 2035
  • Table 25: Latin America Market Value (USD Million) Forecast by Bonding Agent, 2020 to 2035
  • Table 26: Latin America Market Volume (000 Tons) Forecast by Bonding Agent, 2020 to 2035
  • Table 27: Latin America Market Value (USD Million) Forecast by Applications, 2020 to 2035
  • Table 28: Latin America Market Volume (000 Tons) Forecast by Applications, 2020 to 2035
  • Table 29: Latin America Market Value (USD Million) Forecast by End-Use Industry, 2020 to 2035
  • Table 30: Latin America Market Volume (000 Tons) Forecast by End-Use Industry, 2020 to 2035
  • Table 31: Europe Market Value (USD Million) Forecast by Country, 2020 to 2035
  • Table 32: Europe Market Volume (000 Tons) Forecast by Country, 2020 to 2035
  • Table 33: Europe Market Value (USD Million) Forecast by Product Type, 2020 to 2035
  • Table 34: Europe Market Volume (000 Tons) Forecast by Product Type, 2020 to 2035
  • Table 35: Europe Market Value (USD Million) Forecast by Bonding Agent, 2020 to 2035
  • Table 36: Europe Market Volume (000 Tons) Forecast by Bonding Agent, 2020 to 2035
  • Table 37: Europe Market Value (USD Million) Forecast by Applications, 2020 to 2035
  • Table 38: Europe Market Volume (000 Tons) Forecast by Applications, 2020 to 2035
  • Table 39: Europe Market Value (USD Million) Forecast by End-Use Industry, 2020 to 2035
  • Table 40: Europe Market Volume (000 Tons) Forecast by End-Use Industry, 2020 to 2035
  • Table 41: East Asia Market Value (USD Million) Forecast by Country, 2020 to 2035
  • Table 42: East Asia Market Volume (000 Tons) Forecast by Country, 2020 to 2035
  • Table 43: East Asia Market Value (USD Million) Forecast by Product Type, 2020 to 2035
  • Table 44: East Asia Market Volume (000 Tons) Forecast by Product Type, 2020 to 2035
  • Table 45: East Asia Market Value (USD Million) Forecast by Bonding Agent, 2020 to 2035
  • Table 46: East Asia Market Volume (000 Tons) Forecast by Bonding Agent, 2020 to 2035
  • Table 47: East Asia Market Value (USD Million) Forecast by Applications, 2020 to 2035
  • Table 48: East Asia Market Volume (000 Tons) Forecast by Applications, 2020 to 2035
  • Table 49: East Asia Market Value (USD Million) Forecast by End-Use Industry, 2020 to 2035
  • Table 50: East Asia Market Volume (000 Tons) Forecast by End-Use Industry, 2020 to 2035
  • Table 51: South Asia & Pacific Market Value (USD Million) Forecast by Country, 2020 to 2035
  • Table 52: South Asia & Pacific Market Volume (000 Tons) Forecast by Country, 2020 to 2035
  • Table 53: South Asia & Pacific Market Value (USD Million) Forecast by Product Type, 2020 to 2035
  • Table 54: South Asia & Pacific Market Volume (000 Tons) Forecast by Product Type, 2020 to 2035
  • Table 55: South Asia & Pacific Market Value (USD Million) Forecast by Bonding Agent, 2020 to 2035
  • Table 56: South Asia & Pacific Market Volume (000 Tons) Forecast by Bonding Agent, 2020 to 2035
  • Table 57: South Asia & Pacific Market Value (USD Million) Forecast by Applications, 2020 to 2035
  • Table 58: South Asia & Pacific Market Volume (000 Tons) Forecast by Applications, 2020 to 2035
  • Table 59: South Asia & Pacific Market Value (USD Million) Forecast by End-Use Industry, 2020 to 2035
  • Table 60: South Asia & Pacific Market Volume (000 Tons) Forecast by End-Use Industry, 2020 to 2035
  • Table 61: MEA Market Value (USD Million) Forecast by Country, 2020 to 2035
  • Table 62: MEA Market Volume (000 Tons) Forecast by Country, 2020 to 2035
  • Table 63: MEA Market Value (USD Million) Forecast by Product Type, 2020 to 2035
  • Table 64: MEA Market Volume (000 Tons) Forecast by Product Type, 2020 to 2035
  • Table 65: MEA Market Value (USD Million) Forecast by Bonding Agent, 2020 to 2035
  • Table 66: MEA Market Volume (000 Tons) Forecast by Bonding Agent, 2020 to 2035
  • Table 67: MEA Market Value (USD Million) Forecast by Applications, 2020 to 2035
  • Table 68: MEA Market Volume (000 Tons) Forecast by Applications, 2020 to 2035
  • Table 69: MEA Market Value (USD Million) Forecast by End-Use Industry, 2020 to 2035
  • Table 70: MEA Market Volume (000 Tons) Forecast by End-Use Industry, 2020 to 2035

List of Figures

  • Figure 1: Global Market Value (USD Million) by Product Type, 2025 to 2035
  • Figure 2: Global Market Value (USD Million) by Bonding Agent, 2025 to 2035
  • Figure 3: Global Market Value (USD Million) by Applications, 2025 to 2035
  • Figure 4: Global Market Value (USD Million) by End-Use Industry, 2025 to 2035
  • Figure 5: Global Market Value (USD Million) by Region, 2025 to 2035
  • Figure 6: Global Market Value (USD Million) Analysis by Region, 2020 to 2035
  • Figure 7: Global Market Volume (000 Tons) Analysis by Region, 2020 to 2035
  • Figure 8: Global Market Value Share (%) and BPS Analysis by Region, 2025 to 2035
  • Figure 9: Global Market Y-o-Y Growth (%) Projections by Region, 2025 to 2035
  • Figure 10: Global Market Value (USD Million) Analysis by Product Type, 2020 to 2035
  • Figure 11: Global Market Volume (000 Tons) Analysis by Product Type, 2020 to 2035
  • Figure 12: Global Market Value Share (%) and BPS Analysis by Product Type, 2025 to 2035
  • Figure 13: Global Market Y-o-Y Growth (%) Projections by Product Type, 2025 to 2035
  • Figure 14: Global Market Value (USD Million) Analysis by Bonding Agent, 2020 to 2035
  • Figure 15: Global Market Volume (000 Tons) Analysis by Bonding Agent, 2020 to 2035
  • Figure 16: Global Market Value Share (%) and BPS Analysis by Bonding Agent, 2025 to 2035
  • Figure 17: Global Market Y-o-Y Growth (%) Projections by Bonding Agent, 2025 to 2035
  • Figure 18: Global Market Value (USD Million) Analysis by Applications, 2020 to 2035
  • Figure 19: Global Market Volume (000 Tons) Analysis by Applications, 2020 to 2035
  • Figure 20: Global Market Value Share (%) and BPS Analysis by Applications, 2025 to 2035
  • Figure 21: Global Market Y-o-Y Growth (%) Projections by Applications, 2025 to 2035
  • Figure 22: Global Market Value (USD Million) Analysis by End-Use Industry, 2020 to 2035
  • Figure 23: Global Market Volume (000 Tons) Analysis by End-Use Industry, 2020 to 2035
  • Figure 24: Global Market Value Share (%) and BPS Analysis by End-Use Industry, 2025 to 2035
  • Figure 25: Global Market Y-o-Y Growth (%) Projections by End-Use Industry, 2025 to 2035
  • Figure 26: Global Market Attractiveness by Product Type, 2025 to 2035
  • Figure 27: Global Market Attractiveness by Bonding Agent, 2025 to 2035
  • Figure 28: Global Market Attractiveness by Applications, 2025 to 2035
  • Figure 29: Global Market Attractiveness by End-Use Industry, 2025 to 2035
  • Figure 30: Global Market Attractiveness by Region, 2025 to 2035
  • Figure 31: North America Market Value (USD Million) by Product Type, 2025 to 2035
  • Figure 32: North America Market Value (USD Million) by Bonding Agent, 2025 to 2035
  • Figure 33: North America Market Value (USD Million) by Applications, 2025 to 2035
  • Figure 34: North America Market Value (USD Million) by End-Use Industry, 2025 to 2035
  • Figure 35: North America Market Value (USD Million) by Country, 2025 to 2035
  • Figure 36: North America Market Value (USD Million) Analysis by Country, 2020 to 2035
  • Figure 37: North America Market Volume (000 Tons) Analysis by Country, 2020 to 2035
  • Figure 38: North America Market Value Share (%) and BPS Analysis by Country, 2025 to 2035
  • Figure 39: North America Market Y-o-Y Growth (%) Projections by Country, 2025 to 2035
  • Figure 40: North America Market Value (USD Million) Analysis by Product Type, 2020 to 2035
  • Figure 41: North America Market Volume (000 Tons) Analysis by Product Type, 2020 to 2035
  • Figure 42: North America Market Value Share (%) and BPS Analysis by Product Type, 2025 to 2035
  • Figure 43: North America Market Y-o-Y Growth (%) Projections by Product Type, 2025 to 2035
  • Figure 44: North America Market Value (USD Million) Analysis by Bonding Agent, 2020 to 2035
  • Figure 45: North America Market Volume (000 Tons) Analysis by Bonding Agent, 2020 to 2035
  • Figure 46: North America Market Value Share (%) and BPS Analysis by Bonding Agent, 2025 to 2035
  • Figure 47: North America Market Y-o-Y Growth (%) Projections by Bonding Agent, 2025 to 2035
  • Figure 48: North America Market Value (USD Million) Analysis by Applications, 2020 to 2035
  • Figure 49: North America Market Volume (000 Tons) Analysis by Applications, 2020 to 2035
  • Figure 50: North America Market Value Share (%) and BPS Analysis by Applications, 2025 to 2035
  • Figure 51: North America Market Y-o-Y Growth (%) Projections by Applications, 2025 to 2035
  • Figure 52: North America Market Value (USD Million) Analysis by End-Use Industry, 2020 to 2035
  • Figure 53: North America Market Volume (000 Tons) Analysis by End-Use Industry, 2020 to 2035
  • Figure 54: North America Market Value Share (%) and BPS Analysis by End-Use Industry, 2025 to 2035
  • Figure 55: North America Market Y-o-Y Growth (%) Projections by End-Use Industry, 2025 to 2035
  • Figure 56: North America Market Attractiveness by Product Type, 2025 to 2035
  • Figure 57: North America Market Attractiveness by Bonding Agent, 2025 to 2035
  • Figure 58: North America Market Attractiveness by Applications, 2025 to 2035
  • Figure 59: North America Market Attractiveness by End-Use Industry, 2025 to 2035
  • Figure 60: North America Market Attractiveness by Country, 2025 to 2035
  • Figure 61: Latin America Market Value (USD Million) by Product Type, 2025 to 2035
  • Figure 62: Latin America Market Value (USD Million) by Bonding Agent, 2025 to 2035
  • Figure 63: Latin America Market Value (USD Million) by Applications, 2025 to 2035
  • Figure 64: Latin America Market Value (USD Million) by End-Use Industry, 2025 to 2035
  • Figure 65: Latin America Market Value (USD Million) by Country, 2025 to 2035
  • Figure 66: Latin America Market Value (USD Million) Analysis by Country, 2020 to 2035
  • Figure 67: Latin America Market Volume (000 Tons) Analysis by Country, 2020 to 2035
  • Figure 68: Latin America Market Value Share (%) and BPS Analysis by Country, 2025 to 2035
  • Figure 69: Latin America Market Y-o-Y Growth (%) Projections by Country, 2025 to 2035
  • Figure 70: Latin America Market Value (USD Million) Analysis by Product Type, 2020 to 2035
  • Figure 71: Latin America Market Volume (000 Tons) Analysis by Product Type, 2020 to 2035
  • Figure 72: Latin America Market Value Share (%) and BPS Analysis by Product Type, 2025 to 2035
  • Figure 73: Latin America Market Y-o-Y Growth (%) Projections by Product Type, 2025 to 2035
  • Figure 74: Latin America Market Value (USD Million) Analysis by Bonding Agent, 2020 to 2035
  • Figure 75: Latin America Market Volume (000 Tons) Analysis by Bonding Agent, 2020 to 2035
  • Figure 76: Latin America Market Value Share (%) and BPS Analysis by Bonding Agent, 2025 to 2035
  • Figure 77: Latin America Market Y-o-Y Growth (%) Projections by Bonding Agent, 2025 to 2035
  • Figure 78: Latin America Market Value (USD Million) Analysis by Applications, 2020 to 2035
  • Figure 79: Latin America Market Volume (000 Tons) Analysis by Applications, 2020 to 2035
  • Figure 80: Latin America Market Value Share (%) and BPS Analysis by Applications, 2025 to 2035
  • Figure 81: Latin America Market Y-o-Y Growth (%) Projections by Applications, 2025 to 2035
  • Figure 82: Latin America Market Value (USD Million) Analysis by End-Use Industry, 2020 to 2035
  • Figure 83: Latin America Market Volume (000 Tons) Analysis by End-Use Industry, 2020 to 2035
  • Figure 84: Latin America Market Value Share (%) and BPS Analysis by End-Use Industry, 2025 to 2035
  • Figure 85: Latin America Market Y-o-Y Growth (%) Projections by End-Use Industry, 2025 to 2035
  • Figure 86: Latin America Market Attractiveness by Product Type, 2025 to 2035
  • Figure 87: Latin America Market Attractiveness by Bonding Agent, 2025 to 2035
  • Figure 88: Latin America Market Attractiveness by Applications, 2025 to 2035
  • Figure 89: Latin America Market Attractiveness by End-Use Industry, 2025 to 2035
  • Figure 90: Latin America Market Attractiveness by Country, 2025 to 2035
  • Figure 91: Europe Market Value (USD Million) by Product Type, 2025 to 2035
  • Figure 92: Europe Market Value (USD Million) by Bonding Agent, 2025 to 2035
  • Figure 93: Europe Market Value (USD Million) by Applications, 2025 to 2035
  • Figure 94: Europe Market Value (USD Million) by End-Use Industry, 2025 to 2035
  • Figure 95: Europe Market Value (USD Million) by Country, 2025 to 2035
  • Figure 96: Europe Market Value (USD Million) Analysis by Country, 2020 to 2035
  • Figure 97: Europe Market Volume (000 Tons) Analysis by Country, 2020 to 2035
  • Figure 98: Europe Market Value Share (%) and BPS Analysis by Country, 2025 to 2035
  • Figure 99: Europe Market Y-o-Y Growth (%) Projections by Country, 2025 to 2035
  • Figure 100: Europe Market Value (USD Million) Analysis by Product Type, 2020 to 2035
  • Figure 101: Europe Market Volume (000 Tons) Analysis by Product Type, 2020 to 2035
  • Figure 102: Europe Market Value Share (%) and BPS Analysis by Product Type, 2025 to 2035
  • Figure 103: Europe Market Y-o-Y Growth (%) Projections by Product Type, 2025 to 2035
  • Figure 104: Europe Market Value (USD Million) Analysis by Bonding Agent, 2020 to 2035
  • Figure 105: Europe Market Volume (000 Tons) Analysis by Bonding Agent, 2020 to 2035
  • Figure 106: Europe Market Value Share (%) and BPS Analysis by Bonding Agent, 2025 to 2035
  • Figure 107: Europe Market Y-o-Y Growth (%) Projections by Bonding Agent, 2025 to 2035
  • Figure 108: Europe Market Value (USD Million) Analysis by Applications, 2020 to 2035
  • Figure 109: Europe Market Volume (000 Tons) Analysis by Applications, 2020 to 2035
  • Figure 110: Europe Market Value Share (%) and BPS Analysis by Applications, 2025 to 2035
  • Figure 111: Europe Market Y-o-Y Growth (%) Projections by Applications, 2025 to 2035
  • Figure 112: Europe Market Value (USD Million) Analysis by End-Use Industry, 2020 to 2035
  • Figure 113: Europe Market Volume (000 Tons) Analysis by End-Use Industry, 2020 to 2035
  • Figure 114: Europe Market Value Share (%) and BPS Analysis by End-Use Industry, 2025 to 2035
  • Figure 115: Europe Market Y-o-Y Growth (%) Projections by End-Use Industry, 2025 to 2035
  • Figure 116: Europe Market Attractiveness by Product Type, 2025 to 2035
  • Figure 117: Europe Market Attractiveness by Bonding Agent, 2025 to 2035
  • Figure 118: Europe Market Attractiveness by Applications, 2025 to 2035
  • Figure 119: Europe Market Attractiveness by End-Use Industry, 2025 to 2035
  • Figure 120: Europe Market Attractiveness by Country, 2025 to 2035
  • Figure 121: East Asia Market Value (USD Million) by Product Type, 2025 to 2035
  • Figure 122: East Asia Market Value (USD Million) by Bonding Agent, 2025 to 2035
  • Figure 123: East Asia Market Value (USD Million) by Applications, 2025 to 2035
  • Figure 124: East Asia Market Value (USD Million) by End-Use Industry, 2025 to 2035
  • Figure 125: East Asia Market Value (USD Million) by Country, 2025 to 2035
  • Figure 126: East Asia Market Value (USD Million) Analysis by Country, 2020 to 2035
  • Figure 127: East Asia Market Volume (000 Tons) Analysis by Country, 2020 to 2035
  • Figure 128: East Asia Market Value Share (%) and BPS Analysis by Country, 2025 to 2035
  • Figure 129: East Asia Market Y-o-Y Growth (%) Projections by Country, 2025 to 2035
  • Figure 130: East Asia Market Value (USD Million) Analysis by Product Type, 2020 to 2035
  • Figure 131: East Asia Market Volume (000 Tons) Analysis by Product Type, 2020 to 2035
  • Figure 132: East Asia Market Value Share (%) and BPS Analysis by Product Type, 2025 to 2035
  • Figure 133: East Asia Market Y-o-Y Growth (%) Projections by Product Type, 2025 to 2035
  • Figure 134: East Asia Market Value (USD Million) Analysis by Bonding Agent, 2020 to 2035
  • Figure 135: East Asia Market Volume (000 Tons) Analysis by Bonding Agent, 2020 to 2035
  • Figure 136: East Asia Market Value Share (%) and BPS Analysis by Bonding Agent, 2025 to 2035
  • Figure 137: East Asia Market Y-o-Y Growth (%) Projections by Bonding Agent, 2025 to 2035
  • Figure 138: East Asia Market Value (USD Million) Analysis by Applications, 2020 to 2035
  • Figure 139: East Asia Market Volume (000 Tons) Analysis by Applications, 2020 to 2035
  • Figure 140: East Asia Market Value Share (%) and BPS Analysis by Applications, 2025 to 2035
  • Figure 141: East Asia Market Y-o-Y Growth (%) Projections by Applications, 2025 to 2035
  • Figure 142: East Asia Market Value (USD Million) Analysis by End-Use Industry, 2020 to 2035
  • Figure 143: East Asia Market Volume (000 Tons) Analysis by End-Use Industry, 2020 to 2035
  • Figure 144: East Asia Market Value Share (%) and BPS Analysis by End-Use Industry, 2025 to 2035
  • Figure 145: East Asia Market Y-o-Y Growth (%) Projections by End-Use Industry, 2025 to 2035
  • Figure 146: East Asia Market Attractiveness by Product Type, 2025 to 2035
  • Figure 147: East Asia Market Attractiveness by Bonding Agent, 2025 to 2035
  • Figure 148: East Asia Market Attractiveness by Applications, 2025 to 2035
  • Figure 149: East Asia Market Attractiveness by End-Use Industry, 2025 to 2035
  • Figure 150: East Asia Market Attractiveness by Country, 2025 to 2035
  • Figure 151: South Asia & Pacific Market Value (USD Million) by Product Type, 2025 to 2035
  • Figure 152: South Asia & Pacific Market Value (USD Million) by Bonding Agent, 2025 to 2035
  • Figure 153: South Asia & Pacific Market Value (USD Million) by Applications, 2025 to 2035
  • Figure 154: South Asia & Pacific Market Value (USD Million) by End-Use Industry, 2025 to 2035
  • Figure 155: South Asia & Pacific Market Value (USD Million) by Country, 2025 to 2035
  • Figure 156: South Asia & Pacific Market Value (USD Million) Analysis by Country, 2020 to 2035
  • Figure 157: South Asia & Pacific Market Volume (000 Tons) Analysis by Country, 2020 to 2035
  • Figure 158: South Asia & Pacific Market Value Share (%) and BPS Analysis by Country, 2025 to 2035
  • Figure 159: South Asia & Pacific Market Y-o-Y Growth (%) Projections by Country, 2025 to 2035
  • Figure 160: South Asia & Pacific Market Value (USD Million) Analysis by Product Type, 2020 to 2035
  • Figure 161: South Asia & Pacific Market Volume (000 Tons) Analysis by Product Type, 2020 to 2035
  • Figure 162: South Asia & Pacific Market Value Share (%) and BPS Analysis by Product Type, 2025 to 2035
  • Figure 163: South Asia & Pacific Market Y-o-Y Growth (%) Projections by Product Type, 2025 to 2035
  • Figure 164: South Asia & Pacific Market Value (USD Million) Analysis by Bonding Agent, 2020 to 2035
  • Figure 165: South Asia & Pacific Market Volume (000 Tons) Analysis by Bonding Agent, 2020 to 2035
  • Figure 166: South Asia & Pacific Market Value Share (%) and BPS Analysis by Bonding Agent, 2025 to 2035
  • Figure 167: South Asia & Pacific Market Y-o-Y Growth (%) Projections by Bonding Agent, 2025 to 2035
  • Figure 168: South Asia & Pacific Market Value (USD Million) Analysis by Applications, 2020 to 2035
  • Figure 169: South Asia & Pacific Market Volume (000 Tons) Analysis by Applications, 2020 to 2035
  • Figure 170: South Asia & Pacific Market Value Share (%) and BPS Analysis by Applications, 2025 to 2035
  • Figure 171: South Asia & Pacific Market Y-o-Y Growth (%) Projections by Applications, 2025 to 2035
  • Figure 172: South Asia & Pacific Market Value (USD Million) Analysis by End-Use Industry, 2020 to 2035
  • Figure 173: South Asia & Pacific Market Volume (000 Tons) Analysis by End-Use Industry, 2020 to 2035
  • Figure 174: South Asia & Pacific Market Value Share (%) and BPS Analysis by End-Use Industry, 2025 to 2035
  • Figure 175: South Asia & Pacific Market Y-o-Y Growth (%) Projections by End-Use Industry, 2025 to 2035
  • Figure 176: South Asia & Pacific Market Attractiveness by Product Type, 2025 to 2035
  • Figure 177: South Asia & Pacific Market Attractiveness by Bonding Agent, 2025 to 2035
  • Figure 178: South Asia & Pacific Market Attractiveness by Applications, 2025 to 2035
  • Figure 179: South Asia & Pacific Market Attractiveness by End-Use Industry, 2025 to 2035
  • Figure 180: South Asia & Pacific Market Attractiveness by Country, 2025 to 2035
  • Figure 181: MEA Market Value (USD Million) by Product Type, 2025 to 2035
  • Figure 182: MEA Market Value (USD Million) by Bonding Agent, 2025 to 2035
  • Figure 183: MEA Market Value (USD Million) by Applications, 2025 to 2035
  • Figure 184: MEA Market Value (USD Million) by End-Use Industry, 2025 to 2035
  • Figure 185: MEA Market Value (USD Million) by Country, 2025 to 2035
  • Figure 186: MEA Market Value (USD Million) Analysis by Country, 2020 to 2035
  • Figure 187: MEA Market Volume (000 Tons) Analysis by Country, 2020 to 2035
  • Figure 188: MEA Market Value Share (%) and BPS Analysis by Country, 2025 to 2035
  • Figure 189: MEA Market Y-o-Y Growth (%) Projections by Country, 2025 to 2035
  • Figure 190: MEA Market Value (USD Million) Analysis by Product Type, 2020 to 2035
  • Figure 191: MEA Market Volume (000 Tons) Analysis by Product Type, 2020 to 2035
  • Figure 192: MEA Market Value Share (%) and BPS Analysis by Product Type, 2025 to 2035
  • Figure 193: MEA Market Y-o-Y Growth (%) Projections by Product Type, 2025 to 2035
  • Figure 194: MEA Market Value (USD Million) Analysis by Bonding Agent, 2020 to 2035
  • Figure 195: MEA Market Volume (000 Tons) Analysis by Bonding Agent, 2020 to 2035
  • Figure 196: MEA Market Value Share (%) and BPS Analysis by Bonding Agent, 2025 to 2035
  • Figure 197: MEA Market Y-o-Y Growth (%) Projections by Bonding Agent, 2025 to 2035
  • Figure 198: MEA Market Value (USD Million) Analysis by Applications, 2020 to 2035
  • Figure 199: MEA Market Volume (000 Tons) Analysis by Applications, 2020 to 2035
  • Figure 200: MEA Market Value Share (%) and BPS Analysis by Applications, 2025 to 2035
  • Figure 201: MEA Market Y-o-Y Growth (%) Projections by Applications, 2025 to 2035
  • Figure 202: MEA Market Value (USD Million) Analysis by End-Use Industry, 2020 to 2035
  • Figure 203: MEA Market Volume (000 Tons) Analysis by End-Use Industry, 2020 to 2035
  • Figure 204: MEA Market Value Share (%) and BPS Analysis by End-Use Industry, 2025 to 2035
  • Figure 205: MEA Market Y-o-Y Growth (%) Projections by End-Use Industry, 2025 to 2035
  • Figure 206: MEA Market Attractiveness by Product Type, 2025 to 2035
  • Figure 207: MEA Market Attractiveness by Bonding Agent, 2025 to 2035
  • Figure 208: MEA Market Attractiveness by Applications, 2025 to 2035
  • Figure 209: MEA Market Attractiveness by End-Use Industry, 2025 to 2035
  • Figure 210: MEA Market Attractiveness by Country, 2025 to 2035

Frequently Asked Questions

What was the market size of the bonded abrasives in aluminum oxide grain type in 2025?

The global bonded abrasives market for aluminum oxide grain type was valued at USD 28,295.9 million in 2025.

How big is the bonded abrasives industry expected in 2035?

The demand for bonded abrasives industry is set to reach USD 44,937.1 million in 2035.

What will drive the demand for bonded abrasives industry during the forecast period?

Bonded abrasives are extensively used in precision grinding applications, especially in industries such as automotive, aerospace, and heavy machinery, where high-quality finishes are required for components.

What is the projected demand for bonded abrasives during the forecast period?

The bonded abrasives demand was valued at USD 23,657.1 million in 2020 and is projected to reach USD 44,937.1 million by 2035 growing at CAGR of 4.7% in the forecast period.

Which segment in end use is expected to lead in bonded abrasives production?

Automotive end use is expected to lead during the forecast period.

Explore Similar Insights

Future Market Insights

Bonded Abrasives Market

Chat With

MaRIA

Hi There, I am MaRIA, Your Market Research Intelligence Assistant. How may I help you?