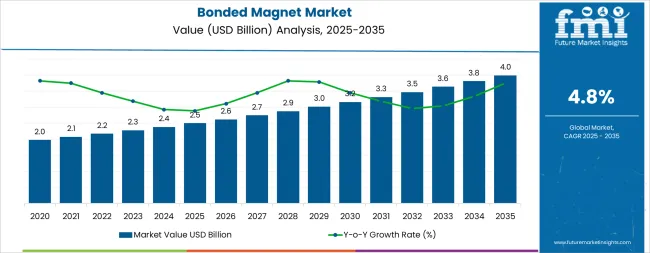
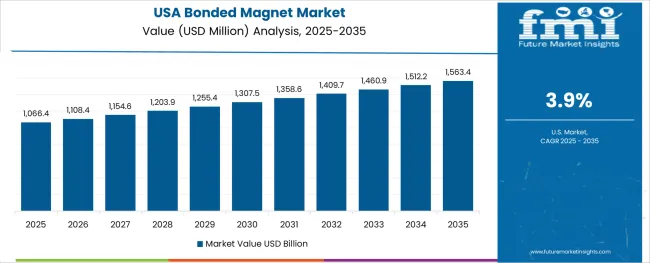
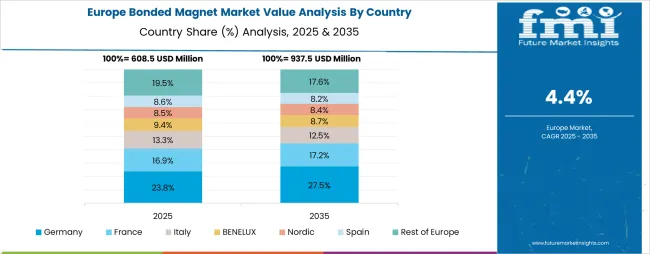
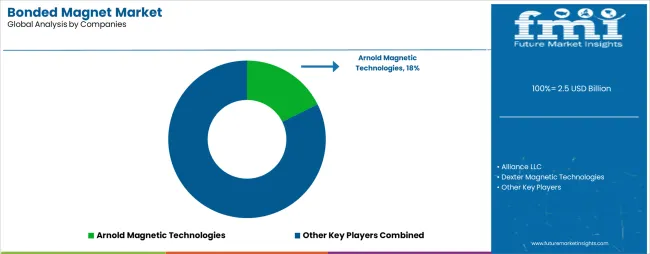
The bonded magnet market size is estimated to be worth USD 2.5 Billion in 2024. The sales of bonded magnets are likely to rise at a CAGR of 4.80% through 2034. The demand for bonded magnets is driven by the increasing demand for miniaturized and lightweight components in consumer electronics, automotive, and industrial applications.
The bonded magnet industry is projected to surpass USD 4.1 Billion by 2034. The versatility of bonded magnets allows for customization and integration into complex shapes and configurations, offering design flexibility to manufacturers. This ability to tailor magnets to specific application requirements has fueled their demand in industries like automotive, where they are used in sensors, actuators, and electric motors.
Attributes | Details |
---|---|
Bonded Magnet Market Value for 2024 | USD 2.5 Billion |
Bonded Magnet Market Value for 2034 | USD 4.1 Billion |
Bonded Magnet Market Forecast CAGR for 2024 to 2034 | 4.80% |
Historical CAGR | 3.90% |
---|---|
Forecast CAGR | 4.80% |
The historical performance and future growth projections of the bonded magnet market indicate a moderate but steady increase in demand over time. The historical CAGR stood at 3.90%, reflecting a consistent yet relatively modest expansion in market size. However, the forecasted CAGR shows a notable improvement, which is expected to rise to 4.80% in the coming years.
Several factors contribute to the increase in forecasted CAGR compared to historical performance. Technological advancements in manufacturing processes have led to the development of more efficient and cost-effective bonded magnet materials. These innovations have expanded the application scope of bonded magnets across various industries, driving higher demand for these products.
The growing emphasis on sustainability and environmental consciousness has spurred the adoption of bonded magnets as eco-friendly alternatives to traditional magnet materials. As companies seek to reduce their carbon footprint and comply with stringent regulations, the demand for sustainable magnet solutions is expected to rise, contributing to the projected increase in CAGR.
Shift Towards Electric Mobility
The global shift towards electric vehicles (EVs) and the electrification of transportation infrastructure are creating significant opportunities for bonded magnets, particularly in electric motor applications for EV drivetrains.
Increasing Demand from the Healthcare Industry
Bonded magnets are finding growing applications in medical devices, including MRI machines, diagnostic equipment, and wearable health monitors, driven by advancements in healthcare technology and an aging population.
Expansion in Aerospace Applications
The aerospace industry's growing focus on lightweight materials and advanced propulsion systems is driving the adoption of bonded magnets in aerospace applications such as actuators, sensors, and avionics systems.
Emerging Market in Asia Pacific
Rapid industrialization and infrastructure development in countries like China, India, and Southeast Asian nations are creating significant opportunities for bonded magnets in sectors such as automotive, consumer electronics, and renewable energy.
This section provides detailed insights into specific segments in the bonded magnet industry.
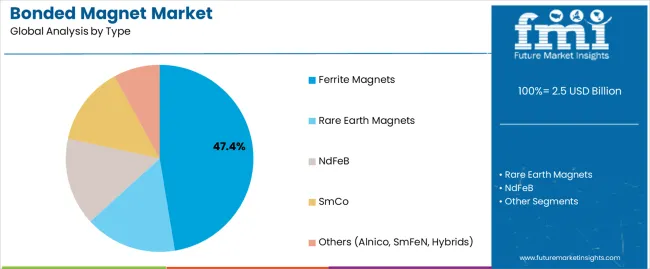
Top Product Type | Ferrite Magnets |
---|---|
Market Share in 2024 | 47% |
The key factors behind the dominance of the segment include,
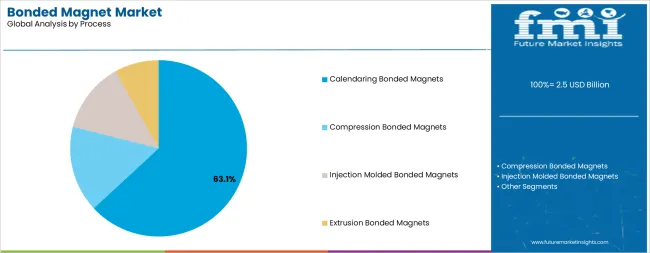
Dominating Process Type | Calendering Bonded Magnets |
---|---|
Market Share in 2024 | 63.10% |
Some crucial factors responsible for dominating market share include,
The section analyzes the bonded magnet market across key countries, including the United States, Australia, China, India, and Germany. The analysis delves into the specific factors driving the demand for bonded magnets in these countries.
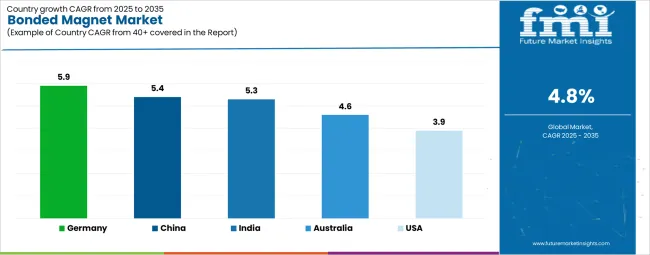
Countries | CAGR |
---|---|
United States | 3.9% |
Australia | 4.6% |
China | 5.4% |
India | 5.3% |
Germany | 5.9% |
The bonded magnet industry in the United States is anticipated to rise at a CAGR of 3.9% through 2034.
The bonded magnet industry in Australia is projected to rise at a CAGR of 4.6% through 2034.
China’s bonded magnet industry is likely to witness expansion at a CAGR of 5.4% through 2034.
India's bonded magnet industry is projected to rise at a CAGR of 5.3% through 2034.
Germany's bonded magnet market is expected to rise at a 5.9% CAGR through 2034.
The competition in the bonded magnet industry reflects a blend of established players and emerging challengers vying for market share. Leading companies dominate with their extensive product portfolios and strong market presence. Innovative startups are disrupting the market with novel bonding techniques, material compositions, and application-specific solutions, challenging traditional players.
A focus on research and development initiatives, along with investments in advanced manufacturing technologies, underscores the industry's commitment to staying ahead in a rapidly evolving market. Companies are investing in automation, process optimization, and quality control measures to improve production efficiency, reduce costs, and meet stringent quality standards, thus gaining a competitive edge.
Recent Developments in the Bonded Magnet Industry:
Report Attributes | Details |
---|---|
Current Total Market Size (2024) | USD 2.5 Billion |
Projected Market Size (2034) | USD 4.1 Billion |
CAGR | 4.8% |
Base Year for Estimation | 2023 |
Historical Period | 2020 to 2023 |
Projections Period | 2024 to 2034 |
Report Parameter | Revenue in USD Billion/Volume in Million Units |
Product Analyzed | Rare Earth Magnets (NdFeB, SmCo), Ferrite Magnets, Others (Alnico, SmFeN, Hybrids) |
Process Types Analyzed | Injection Molded, Compression, Calendaring, Extrusion Bonded Magnets |
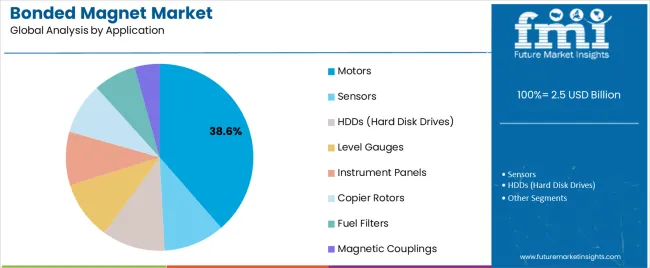
Application Analyzed | Sensors, Motors, HDDs, Level Gauges, Instrument Panels, Copier Rotors, Fuel Filters, Magnetic Couplings |
End Use Analyzed | Automotive, HVAC Equipment, Medical Devices, Cameras, Consumer Electronic Appliances, Computers and Magnetic Storage Devices, Electrical Equipment, Measurement Instruments, Printers and Copiers |
Regions Covered | North America, Latin America, Europe, East Asia, South Asia, Oceania, Middle East & Africa |
Countries Covered | United States, Canada, Germany, France, United Kingdom, Italy, Spain, China, India, Japan, South Korea, Australia, Brazil, Mexico, South Africa |
Key Players | Arnold Magnetic Technologies, Alliance LLC, Dexter Magnetic Technologies, TDK Corporation, Adams Magnetic Products, SDM Magnetics Co., Ltd., Ningbo Yunsheng Co. Ltd., Advanced Technology Materials Co. Ltd., MMC Magnetics Corp, Dura Magnetics, Inc., National Imports, LLC, Super Magnet Co., Ltd., MP Material |
Additional Attributes | Market share by company, product type performance, regional demand shifts, application-level insights, company benchmarking, annual dollar sales breakdown by region and segment |
Customization and Pricing | Available upon request |
Table 1: Global Market Value (US$ Million) Forecast by Region, 2019 to 2034
Table 2: Global Market Volume (Units) Forecast by Region, 2019 to 2034
Table 3: Global Market Value (US$ Million) Forecast by Product, 2019 to 2034
Table 4: Global Market Volume (Units) Forecast by Product, 2019 to 2034
Table 5: Global Market Value (US$ Million) Forecast by Process, 2019 to 2034
Table 6: Global Market Volume (Units) Forecast by Process, 2019 to 2034
Table 7: Global Market Value (US$ Million) Forecast by Application, 2019 to 2034
Table 8: Global Market Volume (Units) Forecast by Application, 2019 to 2034
Table 9: Global Market Value (US$ Million) Forecast by End Use, 2019 to 2034
Table 10: Global Market Volume (Units) Forecast by End Use, 2019 to 2034
Table 11: North America Market Value (US$ Million) Forecast by Country, 2019 to 2034
Table 12: North America Market Volume (Units) Forecast by Country, 2019 to 2034
Table 13: North America Market Value (US$ Million) Forecast by Product, 2019 to 2034
Table 14: North America Market Volume (Units) Forecast by Product, 2019 to 2034
Table 15: North America Market Value (US$ Million) Forecast by Process, 2019 to 2034
Table 16: North America Market Volume (Units) Forecast by Process, 2019 to 2034
Table 17: North America Market Value (US$ Million) Forecast by Application, 2019 to 2034
Table 18: North America Market Volume (Units) Forecast by Application, 2019 to 2034
Table 19: North America Market Value (US$ Million) Forecast by End Use, 2019 to 2034
Table 20: North America Market Volume (Units) Forecast by End Use, 2019 to 2034
Table 21: Latin America Market Value (US$ Million) Forecast by Country, 2019 to 2034
Table 22: Latin America Market Volume (Units) Forecast by Country, 2019 to 2034
Table 23: Latin America Market Value (US$ Million) Forecast by Product, 2019 to 2034
Table 24: Latin America Market Volume (Units) Forecast by Product, 2019 to 2034
Table 25: Latin America Market Value (US$ Million) Forecast by Process, 2019 to 2034
Table 26: Latin America Market Volume (Units) Forecast by Process, 2019 to 2034
Table 27: Latin America Market Value (US$ Million) Forecast by Application, 2019 to 2034
Table 28: Latin America Market Volume (Units) Forecast by Application, 2019 to 2034
Table 29: Latin America Market Value (US$ Million) Forecast by End Use, 2019 to 2034
Table 30: Latin America Market Volume (Units) Forecast by End Use, 2019 to 2034
Table 31: Western Europe Market Value (US$ Million) Forecast by Country, 2019 to 2034
Table 32: Western Europe Market Volume (Units) Forecast by Country, 2019 to 2034
Table 33: Western Europe Market Value (US$ Million) Forecast by Product, 2019 to 2034
Table 34: Western Europe Market Volume (Units) Forecast by Product, 2019 to 2034
Table 35: Western Europe Market Value (US$ Million) Forecast by Process, 2019 to 2034
Table 36: Western Europe Market Volume (Units) Forecast by Process, 2019 to 2034
Table 37: Western Europe Market Value (US$ Million) Forecast by Application, 2019 to 2034
Table 38: Western Europe Market Volume (Units) Forecast by Application, 2019 to 2034
Table 39: Western Europe Market Value (US$ Million) Forecast by End Use, 2019 to 2034
Table 40: Western Europe Market Volume (Units) Forecast by End Use, 2019 to 2034
Table 41: Eastern Europe Market Value (US$ Million) Forecast by Country, 2019 to 2034
Table 42: Eastern Europe Market Volume (Units) Forecast by Country, 2019 to 2034
Table 43: Eastern Europe Market Value (US$ Million) Forecast by Product, 2019 to 2034
Table 44: Eastern Europe Market Volume (Units) Forecast by Product, 2019 to 2034
Table 45: Eastern Europe Market Value (US$ Million) Forecast by Process, 2019 to 2034
Table 46: Eastern Europe Market Volume (Units) Forecast by Process, 2019 to 2034
Table 47: Eastern Europe Market Value (US$ Million) Forecast by Application, 2019 to 2034
Table 48: Eastern Europe Market Volume (Units) Forecast by Application, 2019 to 2034
Table 49: Eastern Europe Market Value (US$ Million) Forecast by End Use, 2019 to 2034
Table 50: Eastern Europe Market Volume (Units) Forecast by End Use, 2019 to 2034
Table 51: South Asia and Pacific Market Value (US$ Million) Forecast by Country, 2019 to 2034
Table 52: South Asia and Pacific Market Volume (Units) Forecast by Country, 2019 to 2034
Table 53: South Asia and Pacific Market Value (US$ Million) Forecast by Product, 2019 to 2034
Table 54: South Asia and Pacific Market Volume (Units) Forecast by Product, 2019 to 2034
Table 55: South Asia and Pacific Market Value (US$ Million) Forecast by Process, 2019 to 2034
Table 56: South Asia and Pacific Market Volume (Units) Forecast by Process, 2019 to 2034
Table 57: South Asia and Pacific Market Value (US$ Million) Forecast by Application, 2019 to 2034
Table 58: South Asia and Pacific Market Volume (Units) Forecast by Application, 2019 to 2034
Table 59: South Asia and Pacific Market Value (US$ Million) Forecast by End Use, 2019 to 2034
Table 60: South Asia and Pacific Market Volume (Units) Forecast by End Use, 2019 to 2034
Table 61: East Asia Market Value (US$ Million) Forecast by Country, 2019 to 2034
Table 62: East Asia Market Volume (Units) Forecast by Country, 2019 to 2034
Table 63: East Asia Market Value (US$ Million) Forecast by Product, 2019 to 2034
Table 64: East Asia Market Volume (Units) Forecast by Product, 2019 to 2034
Table 65: East Asia Market Value (US$ Million) Forecast by Process, 2019 to 2034
Table 66: East Asia Market Volume (Units) Forecast by Process, 2019 to 2034
Table 67: East Asia Market Value (US$ Million) Forecast by Application, 2019 to 2034
Table 68: East Asia Market Volume (Units) Forecast by Application, 2019 to 2034
Table 69: East Asia Market Value (US$ Million) Forecast by End Use, 2019 to 2034
Table 70: East Asia Market Volume (Units) Forecast by End Use, 2019 to 2034
Table 71: Middle East and Africa Market Value (US$ Million) Forecast by Country, 2019 to 2034
Table 72: Middle East and Africa Market Volume (Units) Forecast by Country, 2019 to 2034
Table 73: Middle East and Africa Market Value (US$ Million) Forecast by Product, 2019 to 2034
Table 74: Middle East and Africa Market Volume (Units) Forecast by Product, 2019 to 2034
Table 75: Middle East and Africa Market Value (US$ Million) Forecast by Process, 2019 to 2034
Table 76: Middle East and Africa Market Volume (Units) Forecast by Process, 2019 to 2034
Table 77: Middle East and Africa Market Value (US$ Million) Forecast by Application, 2019 to 2034
Table 78: Middle East and Africa Market Volume (Units) Forecast by Application, 2019 to 2034
Table 79: Middle East and Africa Market Value (US$ Million) Forecast by End Use, 2019 to 2034
Table 80: Middle East and Africa Market Volume (Units) Forecast by End Use, 2019 to 2034
Figure 1: Global Market Value (US$ Million) by Product, 2024 to 2034
Figure 2: Global Market Value (US$ Million) by Process, 2024 to 2034
Figure 3: Global Market Value (US$ Million) by Application, 2024 to 2034
Figure 4: Global Market Value (US$ Million) by End Use, 2024 to 2034
Figure 5: Global Market Value (US$ Million) by Region, 2024 to 2034
Figure 6: Global Market Value (US$ Million) Analysis by Region, 2019 to 2034
Figure 7: Global Market Volume (Units) Analysis by Region, 2019 to 2034
Figure 8: Global Market Value Share (%) and BPS Analysis by Region, 2024 to 2034
Figure 9: Global Market Y-o-Y Growth (%) Projections by Region, 2024 to 2034
Figure 10: Global Market Value (US$ Million) Analysis by Product, 2019 to 2034
Figure 11: Global Market Volume (Units) Analysis by Product, 2019 to 2034
Figure 12: Global Market Value Share (%) and BPS Analysis by Product, 2024 to 2034
Figure 13: Global Market Y-o-Y Growth (%) Projections by Product, 2024 to 2034
Figure 14: Global Market Value (US$ Million) Analysis by Process, 2019 to 2034
Figure 15: Global Market Volume (Units) Analysis by Process, 2019 to 2034
Figure 16: Global Market Value Share (%) and BPS Analysis by Process, 2024 to 2034
Figure 17: Global Market Y-o-Y Growth (%) Projections by Process, 2024 to 2034
Figure 18: Global Market Value (US$ Million) Analysis by Application, 2019 to 2034
Figure 19: Global Market Volume (Units) Analysis by Application, 2019 to 2034
Figure 20: Global Market Value Share (%) and BPS Analysis by Application, 2024 to 2034
Figure 21: Global Market Y-o-Y Growth (%) Projections by Application, 2024 to 2034
Figure 22: Global Market Value (US$ Million) Analysis by End Use, 2019 to 2034
Figure 23: Global Market Volume (Units) Analysis by End Use, 2019 to 2034
Figure 24: Global Market Value Share (%) and BPS Analysis by End Use, 2024 to 2034
Figure 25: Global Market Y-o-Y Growth (%) Projections by End Use, 2024 to 2034
Figure 26: Global Market Attractiveness by Product, 2024 to 2034
Figure 27: Global Market Attractiveness by Process, 2024 to 2034
Figure 28: Global Market Attractiveness by Application, 2024 to 2034
Figure 29: Global Market Attractiveness by End Use, 2024 to 2034
Figure 30: Global Market Attractiveness by Region, 2024 to 2034
Figure 31: North America Market Value (US$ Million) by Product, 2024 to 2034
Figure 32: North America Market Value (US$ Million) by Process, 2024 to 2034
Figure 33: North America Market Value (US$ Million) by Application, 2024 to 2034
Figure 34: North America Market Value (US$ Million) by End Use, 2024 to 2034
Figure 35: North America Market Value (US$ Million) by Country, 2024 to 2034
Figure 36: North America Market Value (US$ Million) Analysis by Country, 2019 to 2034
Figure 37: North America Market Volume (Units) Analysis by Country, 2019 to 2034
Figure 38: North America Market Value Share (%) and BPS Analysis by Country, 2024 to 2034
Figure 39: North America Market Y-o-Y Growth (%) Projections by Country, 2024 to 2034
Figure 40: North America Market Value (US$ Million) Analysis by Product, 2019 to 2034
Figure 41: North America Market Volume (Units) Analysis by Product, 2019 to 2034
Figure 42: North America Market Value Share (%) and BPS Analysis by Product, 2024 to 2034
Figure 43: North America Market Y-o-Y Growth (%) Projections by Product, 2024 to 2034
Figure 44: North America Market Value (US$ Million) Analysis by Process, 2019 to 2034
Figure 45: North America Market Volume (Units) Analysis by Process, 2019 to 2034
Figure 46: North America Market Value Share (%) and BPS Analysis by Process, 2024 to 2034
Figure 47: North America Market Y-o-Y Growth (%) Projections by Process, 2024 to 2034
Figure 48: North America Market Value (US$ Million) Analysis by Application, 2019 to 2034
Figure 49: North America Market Volume (Units) Analysis by Application, 2019 to 2034
Figure 50: North America Market Value Share (%) and BPS Analysis by Application, 2024 to 2034
Figure 51: North America Market Y-o-Y Growth (%) Projections by Application, 2024 to 2034
Figure 52: North America Market Value (US$ Million) Analysis by End Use, 2019 to 2034
Figure 53: North America Market Volume (Units) Analysis by End Use, 2019 to 2034
Figure 54: North America Market Value Share (%) and BPS Analysis by End Use, 2024 to 2034
Figure 55: North America Market Y-o-Y Growth (%) Projections by End Use, 2024 to 2034
Figure 56: North America Market Attractiveness by Product, 2024 to 2034
Figure 57: North America Market Attractiveness by Process, 2024 to 2034
Figure 58: North America Market Attractiveness by Application, 2024 to 2034
Figure 59: North America Market Attractiveness by End Use, 2024 to 2034
Figure 60: North America Market Attractiveness by Country, 2024 to 2034
Figure 61: Latin America Market Value (US$ Million) by Product, 2024 to 2034
Figure 62: Latin America Market Value (US$ Million) by Process, 2024 to 2034
Figure 63: Latin America Market Value (US$ Million) by Application, 2024 to 2034
Figure 64: Latin America Market Value (US$ Million) by End Use, 2024 to 2034
Figure 65: Latin America Market Value (US$ Million) by Country, 2024 to 2034
Figure 66: Latin America Market Value (US$ Million) Analysis by Country, 2019 to 2034
Figure 67: Latin America Market Volume (Units) Analysis by Country, 2019 to 2034
Figure 68: Latin America Market Value Share (%) and BPS Analysis by Country, 2024 to 2034
Figure 69: Latin America Market Y-o-Y Growth (%) Projections by Country, 2024 to 2034
Figure 70: Latin America Market Value (US$ Million) Analysis by Product, 2019 to 2034
Figure 71: Latin America Market Volume (Units) Analysis by Product, 2019 to 2034
Figure 72: Latin America Market Value Share (%) and BPS Analysis by Product, 2024 to 2034
Figure 73: Latin America Market Y-o-Y Growth (%) Projections by Product, 2024 to 2034
Figure 74: Latin America Market Value (US$ Million) Analysis by Process, 2019 to 2034
Figure 75: Latin America Market Volume (Units) Analysis by Process, 2019 to 2034
Figure 76: Latin America Market Value Share (%) and BPS Analysis by Process, 2024 to 2034
Figure 77: Latin America Market Y-o-Y Growth (%) Projections by Process, 2024 to 2034
Figure 78: Latin America Market Value (US$ Million) Analysis by Application, 2019 to 2034
Figure 79: Latin America Market Volume (Units) Analysis by Application, 2019 to 2034
Figure 80: Latin America Market Value Share (%) and BPS Analysis by Application, 2024 to 2034
Figure 81: Latin America Market Y-o-Y Growth (%) Projections by Application, 2024 to 2034
Figure 82: Latin America Market Value (US$ Million) Analysis by End Use, 2019 to 2034
Figure 83: Latin America Market Volume (Units) Analysis by End Use, 2019 to 2034
Figure 84: Latin America Market Value Share (%) and BPS Analysis by End Use, 2024 to 2034
Figure 85: Latin America Market Y-o-Y Growth (%) Projections by End Use, 2024 to 2034
Figure 86: Latin America Market Attractiveness by Product, 2024 to 2034
Figure 87: Latin America Market Attractiveness by Process, 2024 to 2034
Figure 88: Latin America Market Attractiveness by Application, 2024 to 2034
Figure 89: Latin America Market Attractiveness by End Use, 2024 to 2034
Figure 90: Latin America Market Attractiveness by Country, 2024 to 2034
Figure 91: Western Europe Market Value (US$ Million) by Product, 2024 to 2034
Figure 92: Western Europe Market Value (US$ Million) by Process, 2024 to 2034
Figure 93: Western Europe Market Value (US$ Million) by Application, 2024 to 2034
Figure 94: Western Europe Market Value (US$ Million) by End Use, 2024 to 2034
Figure 95: Western Europe Market Value (US$ Million) by Country, 2024 to 2034
Figure 96: Western Europe Market Value (US$ Million) Analysis by Country, 2019 to 2034
Figure 97: Western Europe Market Volume (Units) Analysis by Country, 2019 to 2034
Figure 98: Western Europe Market Value Share (%) and BPS Analysis by Country, 2024 to 2034
Figure 99: Western Europe Market Y-o-Y Growth (%) Projections by Country, 2024 to 2034
Figure 100: Western Europe Market Value (US$ Million) Analysis by Product, 2019 to 2034
Figure 101: Western Europe Market Volume (Units) Analysis by Product, 2019 to 2034
Figure 102: Western Europe Market Value Share (%) and BPS Analysis by Product, 2024 to 2034
Figure 103: Western Europe Market Y-o-Y Growth (%) Projections by Product, 2024 to 2034
Figure 104: Western Europe Market Value (US$ Million) Analysis by Process, 2019 to 2034
Figure 105: Western Europe Market Volume (Units) Analysis by Process, 2019 to 2034
Figure 106: Western Europe Market Value Share (%) and BPS Analysis by Process, 2024 to 2034
Figure 107: Western Europe Market Y-o-Y Growth (%) Projections by Process, 2024 to 2034
Figure 108: Western Europe Market Value (US$ Million) Analysis by Application, 2019 to 2034
Figure 109: Western Europe Market Volume (Units) Analysis by Application, 2019 to 2034
Figure 110: Western Europe Market Value Share (%) and BPS Analysis by Application, 2024 to 2034
Figure 111: Western Europe Market Y-o-Y Growth (%) Projections by Application, 2024 to 2034
Figure 112: Western Europe Market Value (US$ Million) Analysis by End Use, 2019 to 2034
Figure 113: Western Europe Market Volume (Units) Analysis by End Use, 2019 to 2034
Figure 114: Western Europe Market Value Share (%) and BPS Analysis by End Use, 2024 to 2034
Figure 115: Western Europe Market Y-o-Y Growth (%) Projections by End Use, 2024 to 2034
Figure 116: Western Europe Market Attractiveness by Product, 2024 to 2034
Figure 117: Western Europe Market Attractiveness by Process, 2024 to 2034
Figure 118: Western Europe Market Attractiveness by Application, 2024 to 2034
Figure 119: Western Europe Market Attractiveness by End Use, 2024 to 2034
Figure 120: Western Europe Market Attractiveness by Country, 2024 to 2034
Figure 121: Eastern Europe Market Value (US$ Million) by Product, 2024 to 2034
Figure 122: Eastern Europe Market Value (US$ Million) by Process, 2024 to 2034
Figure 123: Eastern Europe Market Value (US$ Million) by Application, 2024 to 2034
Figure 124: Eastern Europe Market Value (US$ Million) by End Use, 2024 to 2034
Figure 125: Eastern Europe Market Value (US$ Million) by Country, 2024 to 2034
Figure 126: Eastern Europe Market Value (US$ Million) Analysis by Country, 2019 to 2034
Figure 127: Eastern Europe Market Volume (Units) Analysis by Country, 2019 to 2034
Figure 128: Eastern Europe Market Value Share (%) and BPS Analysis by Country, 2024 to 2034
Figure 129: Eastern Europe Market Y-o-Y Growth (%) Projections by Country, 2024 to 2034
Figure 130: Eastern Europe Market Value (US$ Million) Analysis by Product, 2019 to 2034
Figure 131: Eastern Europe Market Volume (Units) Analysis by Product, 2019 to 2034
Figure 132: Eastern Europe Market Value Share (%) and BPS Analysis by Product, 2024 to 2034
Figure 133: Eastern Europe Market Y-o-Y Growth (%) Projections by Product, 2024 to 2034
Figure 134: Eastern Europe Market Value (US$ Million) Analysis by Process, 2019 to 2034
Figure 135: Eastern Europe Market Volume (Units) Analysis by Process, 2019 to 2034
Figure 136: Eastern Europe Market Value Share (%) and BPS Analysis by Process, 2024 to 2034
Figure 137: Eastern Europe Market Y-o-Y Growth (%) Projections by Process, 2024 to 2034
Figure 138: Eastern Europe Market Value (US$ Million) Analysis by Application, 2019 to 2034
Figure 139: Eastern Europe Market Volume (Units) Analysis by Application, 2019 to 2034
Figure 140: Eastern Europe Market Value Share (%) and BPS Analysis by Application, 2024 to 2034
Figure 141: Eastern Europe Market Y-o-Y Growth (%) Projections by Application, 2024 to 2034
Figure 142: Eastern Europe Market Value (US$ Million) Analysis by End Use, 2019 to 2034
Figure 143: Eastern Europe Market Volume (Units) Analysis by End Use, 2019 to 2034
Figure 144: Eastern Europe Market Value Share (%) and BPS Analysis by End Use, 2024 to 2034
Figure 145: Eastern Europe Market Y-o-Y Growth (%) Projections by End Use, 2024 to 2034
Figure 146: Eastern Europe Market Attractiveness by Product, 2024 to 2034
Figure 147: Eastern Europe Market Attractiveness by Process, 2024 to 2034
Figure 148: Eastern Europe Market Attractiveness by Application, 2024 to 2034
Figure 149: Eastern Europe Market Attractiveness by End Use, 2024 to 2034
Figure 150: Eastern Europe Market Attractiveness by Country, 2024 to 2034
Figure 151: South Asia and Pacific Market Value (US$ Million) by Product, 2024 to 2034
Figure 152: South Asia and Pacific Market Value (US$ Million) by Process, 2024 to 2034
Figure 153: South Asia and Pacific Market Value (US$ Million) by Application, 2024 to 2034
Figure 154: South Asia and Pacific Market Value (US$ Million) by End Use, 2024 to 2034
Figure 155: South Asia and Pacific Market Value (US$ Million) by Country, 2024 to 2034
Figure 156: South Asia and Pacific Market Value (US$ Million) Analysis by Country, 2019 to 2034
Figure 157: South Asia and Pacific Market Volume (Units) Analysis by Country, 2019 to 2034
Figure 158: South Asia and Pacific Market Value Share (%) and BPS Analysis by Country, 2024 to 2034
Figure 159: South Asia and Pacific Market Y-o-Y Growth (%) Projections by Country, 2024 to 2034
Figure 160: South Asia and Pacific Market Value (US$ Million) Analysis by Product, 2019 to 2034
Figure 161: South Asia and Pacific Market Volume (Units) Analysis by Product, 2019 to 2034
Figure 162: South Asia and Pacific Market Value Share (%) and BPS Analysis by Product, 2024 to 2034
Figure 163: South Asia and Pacific Market Y-o-Y Growth (%) Projections by Product, 2024 to 2034
Figure 164: South Asia and Pacific Market Value (US$ Million) Analysis by Process, 2019 to 2034
Figure 165: South Asia and Pacific Market Volume (Units) Analysis by Process, 2019 to 2034
Figure 166: South Asia and Pacific Market Value Share (%) and BPS Analysis by Process, 2024 to 2034
Figure 167: South Asia and Pacific Market Y-o-Y Growth (%) Projections by Process, 2024 to 2034
Figure 168: South Asia and Pacific Market Value (US$ Million) Analysis by Application, 2019 to 2034
Figure 169: South Asia and Pacific Market Volume (Units) Analysis by Application, 2019 to 2034
Figure 170: South Asia and Pacific Market Value Share (%) and BPS Analysis by Application, 2024 to 2034
Figure 171: South Asia and Pacific Market Y-o-Y Growth (%) Projections by Application, 2024 to 2034
Figure 172: South Asia and Pacific Market Value (US$ Million) Analysis by End Use, 2019 to 2034
Figure 173: South Asia and Pacific Market Volume (Units) Analysis by End Use, 2019 to 2034
Figure 174: South Asia and Pacific Market Value Share (%) and BPS Analysis by End Use, 2024 to 2034
Figure 175: South Asia and Pacific Market Y-o-Y Growth (%) Projections by End Use, 2024 to 2034
Figure 176: South Asia and Pacific Market Attractiveness by Product, 2024 to 2034
Figure 177: South Asia and Pacific Market Attractiveness by Process, 2024 to 2034
Figure 178: South Asia and Pacific Market Attractiveness by Application, 2024 to 2034
Figure 179: South Asia and Pacific Market Attractiveness by End Use, 2024 to 2034
Figure 180: South Asia and Pacific Market Attractiveness by Country, 2024 to 2034
Figure 181: East Asia Market Value (US$ Million) by Product, 2024 to 2034
Figure 182: East Asia Market Value (US$ Million) by Process, 2024 to 2034
Figure 183: East Asia Market Value (US$ Million) by Application, 2024 to 2034
Figure 184: East Asia Market Value (US$ Million) by End Use, 2024 to 2034
Figure 185: East Asia Market Value (US$ Million) by Country, 2024 to 2034
Figure 186: East Asia Market Value (US$ Million) Analysis by Country, 2019 to 2034
Figure 187: East Asia Market Volume (Units) Analysis by Country, 2019 to 2034
Figure 188: East Asia Market Value Share (%) and BPS Analysis by Country, 2024 to 2034
Figure 189: East Asia Market Y-o-Y Growth (%) Projections by Country, 2024 to 2034
Figure 190: East Asia Market Value (US$ Million) Analysis by Product, 2019 to 2034
Figure 191: East Asia Market Volume (Units) Analysis by Product, 2019 to 2034
Figure 192: East Asia Market Value Share (%) and BPS Analysis by Product, 2024 to 2034
Figure 193: East Asia Market Y-o-Y Growth (%) Projections by Product, 2024 to 2034
Figure 194: East Asia Market Value (US$ Million) Analysis by Process, 2019 to 2034
Figure 195: East Asia Market Volume (Units) Analysis by Process, 2019 to 2034
Figure 196: East Asia Market Value Share (%) and BPS Analysis by Process, 2024 to 2034
Figure 197: East Asia Market Y-o-Y Growth (%) Projections by Process, 2024 to 2034
Figure 198: East Asia Market Value (US$ Million) Analysis by Application, 2019 to 2034
Figure 199: East Asia Market Volume (Units) Analysis by Application, 2019 to 2034
Figure 200: East Asia Market Value Share (%) and BPS Analysis by Application, 2024 to 2034
Figure 201: East Asia Market Y-o-Y Growth (%) Projections by Application, 2024 to 2034
Figure 202: East Asia Market Value (US$ Million) Analysis by End Use, 2019 to 2034
Figure 203: East Asia Market Volume (Units) Analysis by End Use, 2019 to 2034
Figure 204: East Asia Market Value Share (%) and BPS Analysis by End Use, 2024 to 2034
Figure 205: East Asia Market Y-o-Y Growth (%) Projections by End Use, 2024 to 2034
Figure 206: East Asia Market Attractiveness by Product, 2024 to 2034
Figure 207: East Asia Market Attractiveness by Process, 2024 to 2034
Figure 208: East Asia Market Attractiveness by Application, 2024 to 2034
Figure 209: East Asia Market Attractiveness by End Use, 2024 to 2034
Figure 210: East Asia Market Attractiveness by Country, 2024 to 2034
Figure 211: Middle East and Africa Market Value (US$ Million) by Product, 2024 to 2034
Figure 212: Middle East and Africa Market Value (US$ Million) by Process, 2024 to 2034
Figure 213: Middle East and Africa Market Value (US$ Million) by Application, 2024 to 2034
Figure 214: Middle East and Africa Market Value (US$ Million) by End Use, 2024 to 2034
Figure 215: Middle East and Africa Market Value (US$ Million) by Country, 2024 to 2034
Figure 216: Middle East and Africa Market Value (US$ Million) Analysis by Country, 2019 to 2034
Figure 217: Middle East and Africa Market Volume (Units) Analysis by Country, 2019 to 2034
Figure 218: Middle East and Africa Market Value Share (%) and BPS Analysis by Country, 2024 to 2034
Figure 219: Middle East and Africa Market Y-o-Y Growth (%) Projections by Country, 2024 to 2034
Figure 220: Middle East and Africa Market Value (US$ Million) Analysis by Product, 2019 to 2034
Figure 221: Middle East and Africa Market Volume (Units) Analysis by Product, 2019 to 2034
Figure 222: Middle East and Africa Market Value Share (%) and BPS Analysis by Product, 2024 to 2034
Figure 223: Middle East and Africa Market Y-o-Y Growth (%) Projections by Product, 2024 to 2034
Figure 224: Middle East and Africa Market Value (US$ Million) Analysis by Process, 2019 to 2034
Figure 225: Middle East and Africa Market Volume (Units) Analysis by Process, 2019 to 2034
Figure 226: Middle East and Africa Market Value Share (%) and BPS Analysis by Process, 2024 to 2034
Figure 227: Middle East and Africa Market Y-o-Y Growth (%) Projections by Process, 2024 to 2034
Figure 228: Middle East and Africa Market Value (US$ Million) Analysis by Application, 2019 to 2034
Figure 229: Middle East and Africa Market Volume (Units) Analysis by Application, 2019 to 2034
Figure 230: Middle East and Africa Market Value Share (%) and BPS Analysis by Application, 2024 to 2034
Figure 231: Middle East and Africa Market Y-o-Y Growth (%) Projections by Application, 2024 to 2034
Figure 232: Middle East and Africa Market Value (US$ Million) Analysis by End Use, 2019 to 2034
Figure 233: Middle East and Africa Market Volume (Units) Analysis by End Use, 2019 to 2034
Figure 234: Middle East and Africa Market Value Share (%) and BPS Analysis by End Use, 2024 to 2034
Figure 235: Middle East and Africa Market Y-o-Y Growth (%) Projections by End Use, 2024 to 2034
Figure 236: Middle East and Africa Market Attractiveness by Product, 2024 to 2034
Figure 237: Middle East and Africa Market Attractiveness by Process, 2024 to 2034
Figure 238: Middle East and Africa Market Attractiveness by Application, 2024 to 2034
Figure 239: Middle East and Africa Market Attractiveness by End Use, 2024 to 2034
Figure 240: Middle East and Africa Market Attractiveness by Country, 2024 to 2034
The bonded magnet market is projected to expand at a CAGR of 4.80% between 2024 and 2034.
The ferrite magnets segment dominates the industry.
The top 3 bonded magnet providers are Arnold Magnetic Technologies, Alliance LLC, and TDK Corporation.
The bonded magnet market is anticipated to surpass USD 4.1 Billion by 2034.
The growing automotive and electronics industries drive the demand for bonded magnets.
Explore Similar Insights
Thank you!
You will receive an email from our Business Development Manager. Please be sure to check your SPAM/JUNK folder too.