The magnetic drive pump market is valued at USD 987.2 million in 2025 and is projected to reach USD 1,533.1 million by 2035, growing at a 4.5% CAGR, with steady expansion driven by increased demand for leak-free, seal-less pumping solutions in chemical, pharmaceutical, and industrial fluid handling applications. The rise in environmental regulations and safety standards is propelling this shift, as industries seek enhanced leak prevention and operational safety. Magnetic drive pumps are particularly favored due to their ability to prevent mechanical seal failures, with up to 80 m³/hr pumps dominating the market, capturing approximately 52.3% of the market share due to their versatility and cost-effectiveness in medium-scale applications.
The market is the growing demand for leak-free solutions in industries that handle hazardous, corrosive, or toxic fluids. In chemical processing, pharmaceuticals, and oil and gas industries, the need for safe and reliable fluid handling is critical. Magnetic drive pumps are ideal for these applications because they eliminate the need for mechanical seals, which are prone to wear and can cause fluid leakage. With no direct contact between the drive and the pump impeller, magnetic drive pumps offer enhanced safety, reliability, and reduced risk of contamination, making them highly suited for applications that require the secure transfer of dangerous or sensitive fluids.
The growing adoption of automation and digital technologies in industrial operations is another factor driving the market. Magnetic drive pumps are increasingly integrated with smart technologies that allow for real-time monitoring, predictive maintenance, and performance optimization. This integration helps companies reduce downtime, improve operational efficiency, and extend the lifespan of the pumps. The rise of Industry 4.0 and the increasing use of Internet of Things (IoT) technologies in industrial systems are creating new opportunities for manufacturers to develop magnetic drive pumps that offer enhanced control, remote monitoring, and diagnostics.
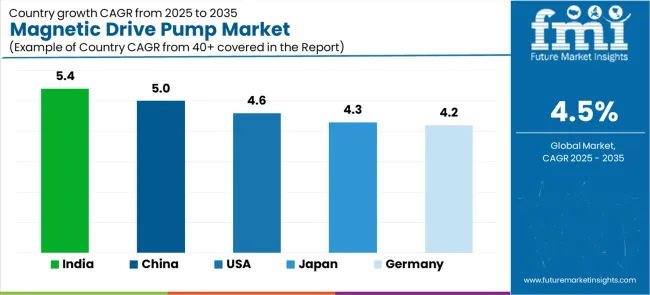
China and India lead the market expansion, with a 5.0% CAGR and 5.4% CAGR, respectively, driven by industrial growth and increasingly stringent environmental regulations in these regions. The United States follows with a 4.6% CAGR, supported by robust safety regulations and expanding chemical processing sectors. The competition in the magnetic drive pump market is not primarily price-driven, but rather revolves around advanced magnetic coupling technologies, reliability, and integration with smart monitoring systems. Leading companies like Flowserve Corporation, Iwaki Co. Ltd., and ITT Goulds Pumps are positioned to benefit from technological innovation, offering reliable, high-performance pumps with superior operational efficiency.
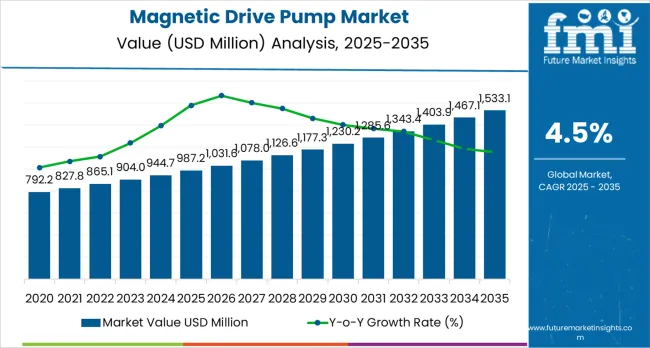
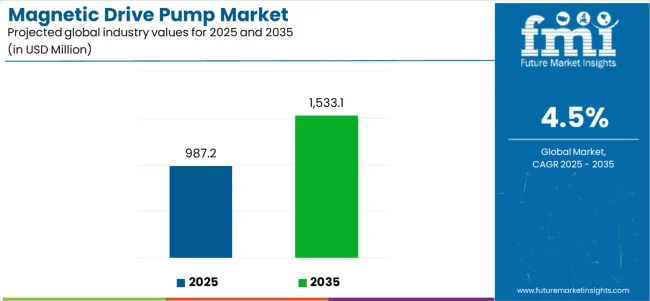
Between 2025 and 2030, the magnetic drive pump market is projected to expand from USD 987.2 million to USD 1.23 billion, resulting in a value increase of USD 242.8 million, which represents 45.6% of the total forecast growth for the decade. This phase of development will be shaped by rising demand for chemical processing and leak prevention applications, product innovation in magnetic coupling technologies and corrosion-resistant materials, as well as expanding integration with smart monitoring systems and IoT-enabled diagnostics. Companies are establishing competitive positions through investment in advanced seal-less technologies, magnetic drive solutions, and strategic market expansion across chemical manufacturing, pharmaceutical processing, and industrial fluid handling applications.
From 2030 to 2035, the market is forecast to grow from USD 1.23 billion to USD 1,533.1 million, adding another USD 290.0 million, which constitutes 54.4% of the ten-year expansion. This period is expected to be characterized by the expansion of specialized pumping systems, including advanced high-efficiency formulations and integrated predictive maintenance solutions tailored for specific industry requirements, strategic collaborations between pump manufacturers and end-user industries, and an enhanced focus on operational efficiency and environmental compliance. The growing emphasis on industrial safety optimization and advanced fluid handling processes will drive demand for high-performance, reliable magnetic drive pump solutions across diverse chemical and process industry applications.
| Metric | Value |
|---|---|
| Market Value (2025) | USD 987.2 million |
| Market Forecast Value (2035) | USD 1,533.1 million |
| Forecast CAGR (2025 to 2035) | 4.5% |
The magnetic drive pump market grows by enabling industrial operators to achieve superior leak prevention and operational safety in fluid handling processes, ranging from small-scale chemical operations to large-scale industrial manufacturing facilities. Industrial operators face mounting pressure to improve environmental compliance and worker safety, with magnetic drive pump solutions typically providing 99%+ leak prevention compared to traditional sealed pumps, making advanced seal-less pumps essential for hazardous fluid handling operations. The chemical processing industry's need for maximum safety and contamination prevention creates demand for advanced pumping solutions that can eliminate mechanical seal failures, enhance operational reliability, and ensure consistent performance across diverse chemical processing environments. Government initiatives promoting industrial safety standards and environmental protection drive adoption in chemical manufacturing, pharmaceutical production, and process industries, where pump performance has a direct impact on operational safety and environmental compliance. = Higher capital costs compared to conventional pumps and the complexity of magnetic coupling technology may limit adoption rates among cost-sensitive operators and developing regions with limited technical expertise.
The market is segmented by flow rate, casting material, and region. By flow rate, the market is divided into up to 80 m³/hr and above 501 m³/hr categories. Based on casting material, the market is categorized into stainless steel and alloy materials. Regionally, the market is divided into North America, Latin America, Western Europe, Eastern Europe, East Asia, South Asia &Pacific, and Middle East &Africa.
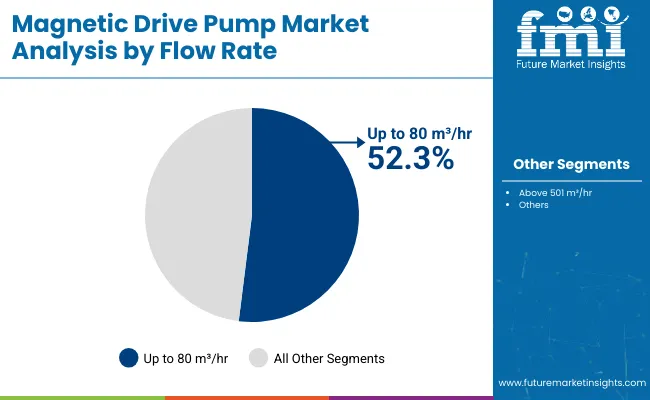
The up to 80 m³/hr segment represents the dominant force in the magnetic drive pump market, capturing approximately 52.3% of total market share in 2025. This flow rate category encompasses pump formulations featuring superior versatility characteristics, including enhanced operational flexibility and optimized performance combinations that enable superior application suitability and enhanced cost-effectiveness characteristics. The up to 80 m³/hr segment's market leadership stems from its exceptional adaptability in medium-scale industrial applications, with pumps capable of delivering consistent performance while maintaining optimal efficiency and operational reliability across diverse chemical processing and fluid handling conditions.
The above 501 m³/hr segment maintains a substantial market presence, serving applications that require high-capacity fluid handling for large-scale industrial operations. These pumps offer reliable performance for high-volume processing applications while providing sufficient flow capacity to meet demanding operational requirements in major chemical plants and industrial processing facilities.
Key technological advantages driving the up to 80 m³/hr segment include:
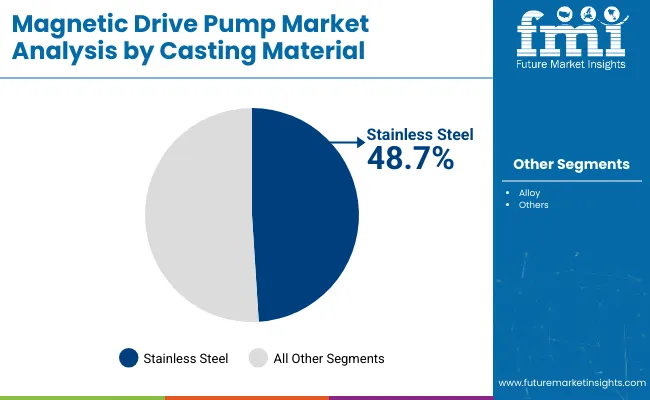
Stainless steel applications dominate the magnetic drive pump market with approximately 48.7% market share in 2025, reflecting the critical role of corrosion-resistant materials in serving chemical processing demand and supporting harsh operating environment applications. The stainless steel segment's market leadership is reinforced by superior corrosion resistance properties, established material reliability standards, and rising demand for durable pumping solutions that directly correlate with operational longevity and maintenance cost reduction.
The alloy segment represents a significant material category, capturing substantial market share through specialized requirements for extreme operating conditions, high-temperature applications, and specialized chemical compatibility operations. This segment benefits from growing demand for advanced material solutions that meet specific chemical resistance, temperature tolerance, and mechanical strength requirements in demanding industrial applications.
Key market dynamics supporting casting material growth include:
The market is driven by three concrete demand factors tied to industrial safety and environmental compliance outcomes. First, global environmental regulations and safety standards create increasing demand for leak-free pumping solutions, with industrial facilities increasingly required to prevent fugitive emissions and hazardous material leaks, requiring specialized seal-less pump systems for maximum safety compliance and environmental protection. Second, chemical processing industry expansion and pharmaceutical manufacturing growth drive the adoption of advanced magnetic drive technologies, with operators seeking complete elimination of mechanical seal failures and enhanced contamination prevention through proven magnetic coupling solutions. Third, technological advancements in magnetic coupling design and smart monitoring systems enable more reliable and efficient pumping solutions that reduce maintenance requirements while improving long-term operational performance and safety monitoring.
Market restraints include high initial investment costs that can impact adoption decisions and project economics, particularly for small-scale operations or developing regions where capital constraints may favor conventional pumping alternatives despite long-term operational benefits. Technical complexity and specialized maintenance requirements pose another significant challenge, as achieving optimal performance with magnetic drive systems requires specific technical knowledge and understanding of magnetic coupling principles, potentially causing implementation delays and increased training costs. Limited flow rate capabilities compared to some conventional pump designs create additional constraints in certain high-capacity applications, demanding careful application engineering and potentially requiring multiple pump installations for large-scale operations.
Key trends indicate accelerated adoption in emerging markets, particularly China, India, and Southeast Asia, where rapid industrialization and stricter environmental regulations drive comprehensive magnetic drive pump system development. Technology advancement trends toward IoT integration with enhanced predictive maintenance, real-time performance monitoring, and automated diagnostic capabilities enable next-generation pump development that addresses multiple operational requirements simultaneously. The market thesis could face disruption if alternative seal-less technologies or significant advances in conventional pump sealing systems reduce the competitive advantages of magnetic drive solutions.
| Country | CAGR (2025-2035) |
|---|---|
| India | 5.4% |
| China | 5.0% |
| United States | 4.6% |
| Japan | 4.3% |
| Germany | 4.2% |
The magnetic drive pump market is gaining momentum worldwide, with India taking the lead thanks to rapid industrialization and expanding chemical manufacturing sectors. Close behind, China benefits from growing chemical processing capacity and environmental regulation enforcement, positioning itself as a strategic growth hub in the East Asia region. The United States shows steady advancement, where stringent safety regulations and advanced chemical processing strengthen its role in the North American industrial equipment supply chains. Japan demonstrates consistent progress through precision manufacturing and quality-focused applications, signaling commitment to advanced pump technology adoption. Meanwhile, Germany maintains stable development through engineering excellence and environmental compliance requirements, recording steady progress in industrial pump technology advancement. Together, India and China anchor the global expansion story, while the United States, Japan, and Germany build technological leadership and quality standards into the market's growth path.
The report covers an in-depth analysis of 40+ countries, with top-performing countries highlighted below.
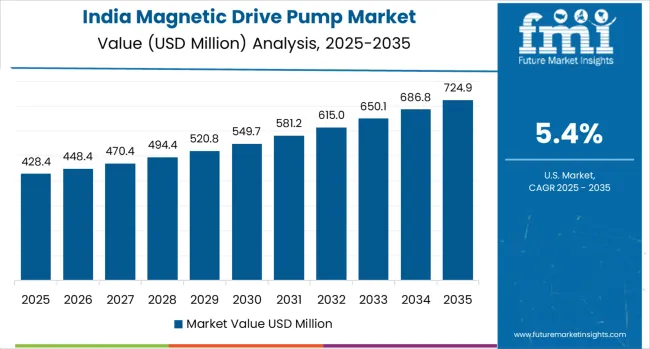
India demonstrates the strongest growth potential in the magnetic drive pump market with a CAGR of 5.4% through 2035. The country's leadership position stems from rapid industrialization projects, expanding chemical manufacturing capacity, and aggressive environmental compliance initiatives, driving the adoption of leak-free pumping systems. Growth is concentrated in major industrial regions, including Maharashtra, Gujarat, Tamil Nadu, and Karnataka, where chemical processing facilities and pharmaceutical companies are implementing advanced magnetic drive solutions for enhanced safety performance and regulatory compliance. Distribution channels through established industrial equipment suppliers and direct manufacturer relationships expand deployment across chemical plants, pharmaceutical facilities, and process industries. The country's industrial development strategy provides policy support for advanced pumping technology development, including seal-less pump system adoption.
Key market factors:
The magnetic drive pump market demonstrates strong growth momentum with a CAGR of 5.0% through 2035, linked to comprehensive industrial expansion and increasing focus on environmental compliance solutions. In Beijing, Shanghai, Guangzhou, and Tianjin, the adoption of magnetic drive pump systems is accelerating across chemical facilities and industrial processing centers, driven by environmental protection targets and government industrial safety initiatives. Chinese manufacturers are implementing advanced magnetic drive systems and smart monitoring platforms to enhance operational performance while meeting growing demand for safe chemical processing in domestic and industrial markets. The country's environmental protection programs create continued demand for leak-free pumping solutions, while increasing emphasis on industrial safety drives adoption of advanced seal-less technologies and monitoring systems.
The United States market expansion is driven by diverse industrial demand, including chemical processing in Texas and Louisiana regions, pharmaceutical manufacturing in the Northeast, and comprehensive industrial modernization across multiple processing centers. The country demonstrates strong growth potential with a CAGR of 4.6% through 2035, supported by federal safety regulations and regional industrial development initiatives. American operators face implementation challenges related to capital cost considerations and technical expertise requirements, requiring value demonstration approaches and technology support partnerships. The growing environmental compliance requirements and safety regulation enforcement create compelling business cases for magnetic drive pump adoption, particularly in chemical processing regions where leak prevention has direct impacts on regulatory compliance and operational safety.
Market characteristics:
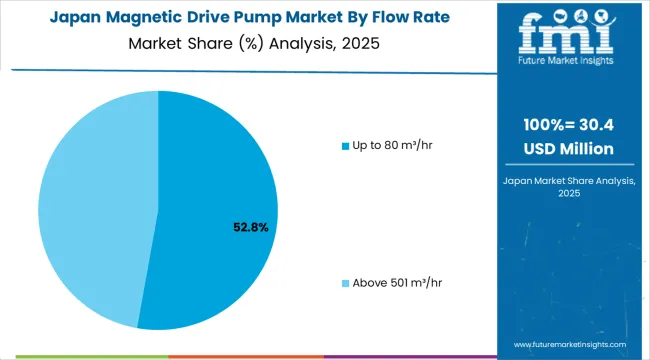
The magnetic drive pump market leads in precision pump manufacturing based on integration with advanced quality control systems and sophisticated reliability applications for enhanced operational characteristics. The country shows consistent potential with a CAGR of 4.3% through 2035, driven by quality-focused manufacturing programs and precision engineering initiatives across major industrial regions, including Kanto, Kansai, Chubu, and Kyushu. Japanese manufacturers are adopting advanced magnetic drive systems for operational optimization and quality enhancement, particularly in regions with precision chemical processing requirements and advanced manufacturing facilities requiring superior reliability performance. Technology deployment channels through established equipment distributors and direct manufacturer relationships expand coverage across precision manufacturing facilities and chemical processing centers.
Leading market segments:
The magnetic drive pump market in Germany demonstrates advanced engineering capabilities based on integration with environmental compliance technologies and sophisticated industrial applications for enhanced safety characteristics. The country shows steady potential with a CAGR of 4.2% through 2035, driven by environmental protection programs and engineering excellence initiatives across major industrial regions, including North Rhine-Westphalia, Bavaria, Baden-Württemberg, and Lower Saxony. German manufacturers are adopting advanced magnetic drive systems for environmental optimization and regulatory compliance, particularly in regions with strict environmental requirements and advanced processing facilities requiring superior leak prevention performance. Technology deployment channels through established engineering companies and direct manufacturer relationships expand coverage across industrial facilities and chemical processing centers.
Leading market segments:
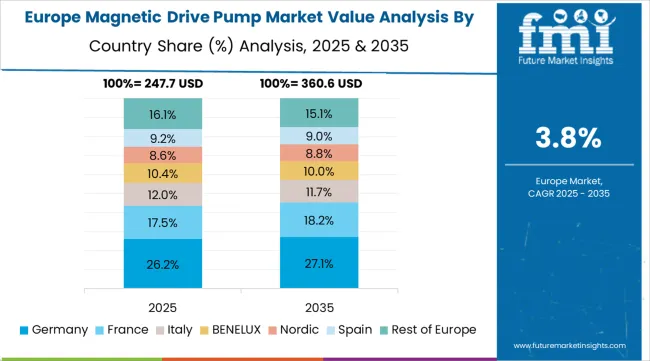
The magnetic drive pump market in Europe is projected to grow from USD 234.8 million in 2025 to USD 342.6 million by 2035, registering a CAGR of 3.9% over the forecast period. Germany is expected to maintain its leadership position with a 28.4% market share in 2025, declining slightly to 28.1% by 2035, supported by its extensive industrial infrastructure and major chemical processing centers, including North Rhine-Westphalia, Bavaria, and Baden-Württemberg industrial facilities.
The United Kingdom follows with a 16.7% share in 2025, projected to reach 16.9% by 2035, driven by comprehensive industrial development programs and environmental compliance initiatives implementing magnetic drive technologies. France holds a 15.2% share in 2025, expected to maintain 15.0% by 2035 through ongoing chemical industry upgrades and safety technology development. Italy commands a 13.8% share, while the Netherlands accounts for 12.3% in 2025. The Rest of Europe region is anticipated to gain momentum, expanding its collective share from 13.6% to 14.7% by 2035, attributed to increasing magnetic drive pump adoption in Nordic countries and emerging Eastern European industrial facilities implementing advanced safety equipment programs.
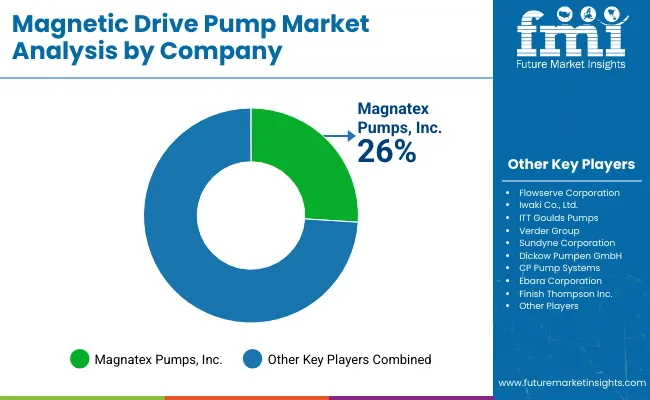
The magnetic drive pump market is composed of 8–12 key players, with the top five companies holding around 55–60% of the global market share, driven by their advanced pump technologies, reliability, and strong customer relationships in industries such as chemicals, pharmaceuticals, water treatment, and oil & gas. Competition in this market is centered on energy efficiency, durability, leak-free operation, and customization rather than price alone. Flowserve Corporation leads the market with an 20.0% share, benefiting from its comprehensive range of magnetic drive pumps designed for critical fluid handling applications, particularly in chemical processing and petrochemical industries.
Other major players such as Iwaki Co., Ltd., ITT Goulds Pumps, and Magnatex Pumps, Inc. maintain their competitive positions by offering specialized magnetic drive pump solutions that deliver reliable, safe, and leak-free performance in highly corrosive and hazardous fluid environments. These companies leverage their innovation in materials, motor technology, and sealing systems to meet stringent industry standards.
Challengers like Verder Group, Sundyne Corporation, and Dickow Pumpen GmbH focus on providing energy-efficient, high-performance magnetic drive pumps for applications in the pharmaceutical, food and beverage, and chemical processing sectors. Smaller players such as CP Pump Systems, Ebara Corporation, and Finish Thompson Inc. differentiate themselves by offering tailored, cost-effective solutions for niche markets, strengthening their presence in regional and specialized applications.
Magnetic drive pumps represent specialized industrial equipment that enable operators to achieve complete elimination of mechanical seal leakage compared to conventional pumps, delivering superior safety performance and environmental compliance with enhanced reliability capabilities in demanding chemical processing applications. With the market projected to grow from USD 987.2 million in 2025 to USD 1,533.1 million by 2035 at a 4.5% CAGR, these pumping systems offer compelling advantages - enhanced safety performance, customizable flow configurations, and operational reliability - making them essential for chemical processing applications, pharmaceutical manufacturing operations, and industrial facilities seeking alternatives to leak-prone conventional pumps that compromise safety through mechanical seal failure risks. Scaling market adoption and technological advancement requires coordinated action across industrial policy, safety standards development, pump manufacturers, chemical industries, and process safety investment capital.
| Items | Values |
|---|---|
| Quantitative Units | USD 987.2 million |
| Flow Rate | Up to 80 m³/hr, Above 501 m³/hr |
| Casting Material | Stainless Steel, Alloy |
| Regions Covered | North America, Latin America, Western Europe, Eastern Europe, East Asia, South Asia &Pacific, Middle East &Africa |
| Country Covered | India, China, United States, Japan, Germany, and 40+ countries |
| Key Companies Profiled | Flowserve Corporation, Iwaki Co., Ltd., ITT Goulds Pumps, Magnatex Pumps, Inc., Verder Group, Sundyne Corporation, Dickow Pumpen GmbH, CP Pump Systems, Ebara Corporation, and Finish Thompson Inc. |
| Additional Attributes | Dollar sales by flow rate and casting material categories, regional adoption trends across East Asia, North America, and Western Europe, competitive landscape with pump providers and technology integrators, industrial facility requirements and specifications, integration with chemical processing and safety systems, innovations in magnetic coupling technology and monitoring systems. |
The global magnetic drive pump market is estimated to be valued at USD 987.2 million in 2025.
The market size for the magnetic drive pump market is projected to reach USD 1,533.1 million by 2035.
The magnetic drive pump market is expected to grow at a 4.5% CAGR between 2025 and 2035.
The key product types in magnetic drive pump market are up to 80 m³/hr and above 501 m³/hr.
In terms of casting material, stainless steel segment to command 48.7% share in the magnetic drive pump market in 2025.


Our Research Products

The "Full Research Suite" delivers actionable market intel, deep dives on markets or technologies, so clients act faster, cut risk, and unlock growth.

The Leaderboard benchmarks and ranks top vendors, classifying them as Established Leaders, Leading Challengers, or Disruptors & Challengers.

Locates where complements amplify value and substitutes erode it, forecasting net impact by horizon

We deliver granular, decision-grade intel: market sizing, 5-year forecasts, pricing, adoption, usage, revenue, and operational KPIs—plus competitor tracking, regulation, and value chains—across 60 countries broadly.

Spot the shifts before they hit your P&L. We track inflection points, adoption curves, pricing moves, and ecosystem plays to show where demand is heading, why it is changing, and what to do next across high-growth markets and disruptive tech

Real-time reads of user behavior. We track shifting priorities, perceptions of today’s and next-gen services, and provider experience, then pace how fast tech moves from trial to adoption, blending buyer, consumer, and channel inputs with social signals (#WhySwitch, #UX).

Partner with our analyst team to build a custom report designed around your business priorities. From analysing market trends to assessing competitors or crafting bespoke datasets, we tailor insights to your needs.
Supplier Intelligence
Discovery & Profiling
Capacity & Footprint
Performance & Risk
Compliance & Governance
Commercial Readiness
Who Supplies Whom
Scorecards & Shortlists
Playbooks & Docs
Category Intelligence
Definition & Scope
Demand & Use Cases
Cost Drivers
Market Structure
Supply Chain Map
Trade & Policy
Operating Norms
Deliverables
Buyer Intelligence
Account Basics
Spend & Scope
Procurement Model
Vendor Requirements
Terms & Policies
Entry Strategy
Pain Points & Triggers
Outputs
Pricing Analysis
Benchmarks
Trends
Should-Cost
Indexation
Landed Cost
Commercial Terms
Deliverables
Brand Analysis
Positioning & Value Prop
Share & Presence
Customer Evidence
Go-to-Market
Digital & Reputation
Compliance & Trust
KPIs & Gaps
Outputs
Full Research Suite comprises of:
Market outlook & trends analysis
Interviews & case studies
Strategic recommendations
Vendor profiles & capabilities analysis
5-year forecasts
8 regions and 60+ country-level data splits
Market segment data splits
12 months of continuous data updates
DELIVERED AS:
PDF EXCEL ONLINE
Sealless Magnetic Drive Pump Market- Growth & Demand 2025 to 2035
Smart Magnetic Drive Conveyor System Market Size and Share Forecast Outlook 2025 to 2035
Magnetic Absorption Data Line Market Size and Share Forecast Outlook 2025 to 2035
Magnetic Material Magnetization and Testing Equipment Market Size and Share Forecast Outlook 2025 to 2035
Magnetic Coupler Market Size and Share Forecast Outlook 2025 to 2035
Pump Jack Market Forecast Outlook 2025 to 2035
Magnetic Shielding Device Market Size and Share Forecast Outlook 2025 to 2035
Pump and Dispenser Market Size and Share Forecast Outlook 2025 to 2035
Magnetic Stripe Readers Market Size and Share Forecast Outlook 2025 to 2035
Magnetic Resonance Analyzer Market Size and Share Forecast Outlook 2025 to 2035
Driveline Control Systems and Devices Market Size and Share Forecast Outlook 2025 to 2035
Magnetic Separator Market Size and Share Forecast Outlook 2025 to 2035
Magnetic Ballast Market Size and Share Forecast Outlook 2025 to 2035
Pump Testers Market Size and Share Forecast Outlook 2025 to 2035
Pumpjacks Market Size and Share Forecast Outlook 2025 to 2035
Pumps Market Size and Share Forecast Outlook 2025 to 2035
Pumpkin Seed Protein Market Size and Share Forecast Outlook 2025 to 2035
Magnetic Sensor Market Size and Share Forecast Outlook 2025 to 2035
Magnetic Flowmeter Market Size and Share Forecast Outlook 2025 to 2035
Magnetic Resonance Imaging Coils Market Analysis - Size, Share, and Forecast 2025 to 2035

Thank you!
You will receive an email from our Business Development Manager. Please be sure to check your SPAM/JUNK folder too.
Chat With
MaRIA