The magnetic absorption data line market is projected to grow from USD 61.0 million in 2025 to USD 110.3 million by 2035, reflecting a compound annual growth rate (CAGR) of 6.1%. Magnetic absorption data lines, which are crucial for reducing electromagnetic interference (EMI) in data transmission, are seeing rising demand as electronic devices become more prevalent across industries. The increasing need for reliable, interference-free data transmission in consumer electronics, telecommunications, and automotive applications supports this growth. The market’s growth is expected to be driven by both advancements in technology and the expanding reliance on electronic devices.
Between 2025 and 2030, the market is expected to expand from USD 61.0 million to USD 82.0 million, marking an increase of USD 21.0 million. This early phase of market growth will be driven by the adoption of magnetic absorption data lines in consumer electronics such as smartphones, laptops, and wearable devices. The global rollout of 5G technology will also increase demand for electromagnetic compatibility (EMC) solutions. Magnetic absorption data lines ensure stable and efficient data transmission by reducing EMI, which can disrupt signal quality and integrity, especially in high-frequency transmission. As industries push for higher data speeds and more reliable connections, the demand for these solutions will continue to rise.
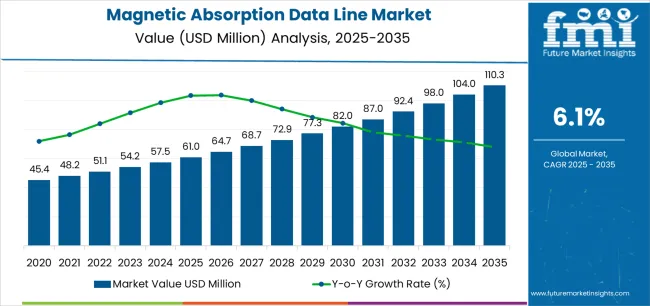
From 2030 to 2035, the market will experience more significant growth, expanding from USD 82.0 million to USD 110.3 million. The increased demand for magnetic absorption data lines will be driven by the rise of autonomous vehicles and advancements in automotive electronics. These vehicles rely on complex data systems for communication and control, necessitating effective EMI suppression. As vehicles become more connected and incorporate advanced infotainment systems and telematics, the demand for interference-free data transmission will grow, boosting the market for magnetic absorption data lines.
In telecommunications, the continued adoption of 5G networks and the increasing number of Internet of Things (IoT) devices will contribute to the market’s growth. Magnetic absorption data lines are essential in ensuring high-quality data transmission in environments with multiple devices transmitting signals simultaneously. As IoT devices proliferate across various industries, the need for magnetic absorption solutions will increase. Advances in the materials used for magnetic absorption, including more efficient ferrites and magnetic cores, will make these solutions more compact and cost-effective, further driving their adoption across industries.
Technological advancements will remain a key factor in the growth of the magnetic absorption data line market. Innovations in materials such as ferrites and other magnetic cores will improve performance and efficiency, making magnetic absorption data lines more effective in reducing EMI. As electronic devices continue to evolve and become more interconnected, the demand for reliable, high-quality data transmission will increase, propelling the market forward. Stricter environmental regulations on electromagnetic emissions will further encourage the use of magnetic absorption data lines, particularly as industries aim to meet compliance standards.
| Metric | Value |
|---|---|
| Market Value (2025) | USD 61.0 million |
| Market Forecast Value (2035) | USD 110.3 million |
| Forecast CAGR (2025 to 2035) | 6.1% |
The magnetic absorption data line market is expanding due to the increasing demand for improved data transmission and reduced electromagnetic interference (EMI). Magnetic absorption data lines effectively mitigate signal degradation and EMI, ensuring reliable data flow in electronic devices such as smartphones, computers, and consumer electronics. This functionality is critical as device connectivity becomes more complex with the rise of high-speed data requirements.
The adoption of IoT devices and the growth of wireless communication technologies are driving demand for advanced data transmission solutions. As more devices become interconnected, the need for stable, interference-free data lines become more prominent. Magnetic absorption data lines play a vital role in supporting the performance and reliability of these devices, making them essential for modern electronics and communications.
Sectors like consumer electronics, automotive, and telecommunications are contributing to market growth as they increasingly rely on high-quality data transmission systems. However, challenges remain, such as the high manufacturing costs of these specialized components and the complexity of their integration. These factors could limit adoption in budget-conscious markets and smaller-scale production environments, particularly in regions with lower technological infrastructure.
The market is segmented by type, application, and region. By type, the market is divided into Type C, Lightning, Micro USB, and USB, with Type C representing the largest segment. Based on application, the market is categorized into Online Sales and Offline Sales, with Online Sales leading in terms of market share. Regionally, the market is divided into Asia Pacific, Europe, North America, and other key regions.
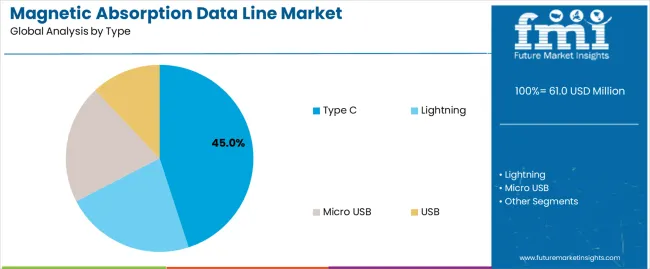
The Type C segment holds a significant share of the magnetic absorption data line market, accounting for approximately 45%. This segment’s growth is fueled by the increasing adoption of Type C connectors in modern electronic devices. Type C connectors are favored for their reversible design, allowing them to be plugged in either way, which improves user convenience. They offer faster data transfer speeds and higher power delivery capabilities compared to other connector types. These features make Type C the preferred choice for many devices, including smartphones, laptops, tablets, and other consumer electronics.
Another key factor driving the growth of the Type C segment is the widespread industry shift toward adopting Type C as the standard charging and data transfer solution. Many leading tech companies, including Apple, Samsung, and Google, have made Type C connectors the standard for their devices, ensuring that Type C remains in high demand. Furthermore, with the rise of 5G devices, Type C has become essential for handling the higher power needs of next-generation technology. Manufacturers continue to innovate, offering improved data transfer speeds, higher durability, and enhanced charging capabilities. As more devices adopt Type C as their primary port, the demand for magnetic absorption data lines in this segment is expected to grow significantly in the coming years.
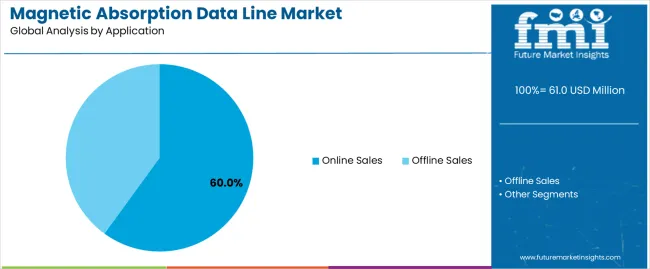
The online sales segment holds a dominant share of the magnetic absorption data line market, accounting for 60%. This dominance is largely attributed to the continued rise of e-commerce and the increasing shift towards online shopping, especially for electronics and accessories. Online platforms offer consumers the convenience of browsing a wide range of products, comparing prices, reading reviews, and making purchases from the comfort of their homes. The ability to shop 24/7 and have products delivered directly to their doorstep is a major driver of the growing preference for online shopping.
The growth of online sales is also facilitated by the rise of digital marketing, targeted ads, and the widespread use of social media platforms that influence purchasing decisions. E-commerce giants like Amazon, eBay, and specialized electronics retailers have made it easier for consumers to find and purchase magnetic absorption data lines, often at competitive prices. The increasing penetration of mobile commerce, where consumers can shop directly from their smartphones, has further accelerated this trend. The rise of payment options such as digital wallets, along with improvements in logistics and delivery services, has made online shopping more convenient and appealing to consumers globally. As e-commerce continues to grow and evolve, the Online Sales segment is expected to maintain its stronghold in the magnetic absorption data line market.
The magnetic absorption data line market is expanding due to the increasing demand for convenient, durable, and high-performance cables across consumer electronics. These cables offer features like faster charging, improved data transfer, and ease of use with magnetic connectors. Key drivers include the rise in mobile devices and accessories, while restraints stem from higher costs and compatibility issues.
Why are Magnetic Charging and Data Cables Gaining Popularity?
Magnetic charging and data cables are gaining popularity due to their convenience and efficiency. These cables offer an easy, one-handed connection with magnetic connectors that automatically align, reducing wear on device ports and extending their lifespan. As mobile devices, wearables, and consumer electronics continue to rise, the demand for durable, high-performance charging and data transfer solutions has increased. Magnetic cables cater to this need by providing faster charging speeds and seamless data synchronization, making them a preferred choice for consumers seeking both ease of use and reliable performance. The growing emphasis on minimalistic designs and premium accessories in consumer electronics has made magnetic absorption cables more attractive, offering a more user-friendly and stylish alternative to traditional cables. These factors, combined with the growing adoption of fast-charging technologies, have significantly boosted the market's appeal, with magnetic cables offering solutions that support higher power levels and faster data transfer speeds.
How are Magnetic Connector Technologies Driving Growth?
Magnetic connector technologies are driving growth in the charging and data transfer cable market by offering significant advantages over traditional connectors. Manufacturers are continuously innovating to enhance the performance of these cables, enabling higher power delivery and faster data transfer. As consumer devices require more power and quicker data synchronization, magnetic charging and data cables have evolved to meet these specifications. Moreover, the rise of USB-C compatibility has made these cables more versatile, ensuring they can be used across a wide range of modern devices. The convenience of magnetic connectors, which allow for easy attachment and detachment, has also played a key role in their growing adoption. Furthermore, the e-commerce boom has made it easier for consumers to access these cables, driving wider distribution and increasing market penetration. As a result, these cables have become an essential accessory for modern electronic devices, with brands capitalizing on premium features like braided finishes, reinforced connectors, and smart displays to differentiate themselves in a competitive market.
What aare the Key Challenges Impacting the Adoption of Magnetic Data Transfer Cables?
Despite the growing popularity of magnetic data transfer cables, several challenges are hindering their widespread adoption. One of the primary challenges is the higher cost associated with magnetic cables compared to traditional ones. The inclusion of magnets and specialized connectors increases the manufacturing cost, which is passed on to the consumer. This higher price point can deter price-sensitive buyers, especially in markets where affordable alternatives dominate. Another issue is compatibility; different connector standards such as USB-C, Lightning, and proprietary connectors make it difficult to create a universal cable that works seamlessly across all devices. This lack of standardization can limit the appeal of magnetic cables for consumers with multiple devices from different brands. Durability is another concern, as some users worry about the long-term reliability of magnetic connectors, fearing they may wear out or fail over time. The accessories market is becoming increasingly saturated, leading to fierce competition and price erosion, which could impact the profitability of manufacturers. These challenges, combined with the slow adoption of new technology in some regions, may limit the full potential of magnetic data transfer cables in the market.
| Country | CAGR (%) |
|---|---|
| China | 8.2% |
| India | 7.6% |
| Germany | 7.0% |
| Brazil | 6.4% |
| USA | 5.8% |
| UK | 5.2% |
| Japan | 4.6% |
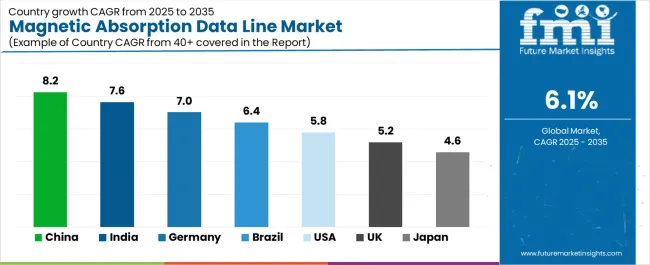
The global magnetic absorption data line market is showing robust growth, led by China at an 8.2% CAGR driven by massive consumer electronics demand, fast‑charging infrastructure, and rising awareness of magnetic alignment data cables. India follows at 7.6%, owing to expanding smartphone penetration, growth of accessories ecosystems, and emerging e‑commerce channels.
Germany grows at 7.0%, supported by high‑end automotive and industrial cable applications where magnetic absorption lines are finding niche use‑cases. Brazil is at 6.4% growth, backed by improving distribution networks and consumer willingness to adopt premium cable technologies.
The USA posts 5.8% CAGR in a mature market focusing on upgrade cycles and premium accessory adoption. The UK, growing at 5.2%, is influenced by smart‑device growth and accessories trends in retail. Japan, with 4.6% growth, reflects a mature market where innovation is incremental and consumer preference is for high‑quality cable solutions.
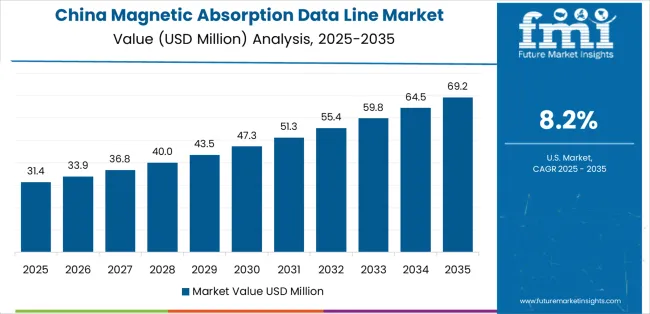
China leads the magnetic absorption data line market with an 8.2% CAGR, driven by rapid technological advancements and a booming consumer electronics market. The country’s vast smartphone market and high adoption of fast‑charging technologies significantly contribute to the demand for high‑performance data lines. As one of the largest manufacturers of electronic devices globally, China is also a hub for the production of magnetic absorption data lines, which are integral for ensuring efficient data transmission and reducing electromagnetic interference in fast‑charging cables. The growing middle class and increasing disposable income have heightened the demand for premium accessories like magnetic absorption cables, especially in Tier 1 cities.
The government’s continued investment in the expansion of infrastructure, including 5G and smart cities, is expected to further fuel the market. China’s expanding e‑commerce sector also plays a crucial role, as online retail platforms are becoming primary sales channels for electronic accessories. As more consumers adopt smart devices and as the country remains at the forefront of electronics innovation, China’s market for magnetic absorption data lines is expected to maintain its leading position, with strong growth prospects in the coming years.
India is experiencing robust growth in the magnetic absorption data line market, with a projected CAGR of 7.6%. The key drivers behind this expansion include the rapid digital transformation, increasing smartphone penetration, and rising demand for fast charging solutions. As one of the world’s largest smartphone markets, India sees a high demand for accessories like magnetic absorption data lines, which help improve data transfer speeds and reduce electromagnetic interference. The country’s growing e‑commerce platforms have made such products more accessible to a larger population, driving adoption.
Furthermore, the rise of 5G networks and the adoption of IoT devices are pushing the demand for high‑performance charging solutions and cables. India’s increasing focus on the development of infrastructure and the expansion of the electronics manufacturing sector also provide a strong foundation for growth. With rising disposable incomes, more consumers are investing in high‑quality, durable accessories. As India continues to prioritize digitization and infrastructure improvement, the magnetic absorption data line market is set to expand, benefiting from increased consumer awareness and growing demand for advanced technological solutions.
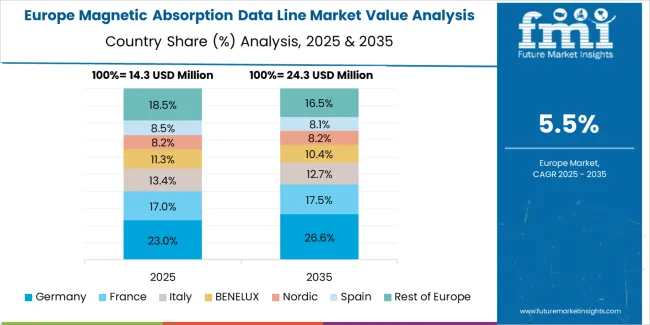
Germany is seeing steady growth in the magnetic absorption data line market, with a 7.0% CAGR. As one of Europe’s leading markets for electronic accessories, Germany’s growth is driven by the rising demand for high‑quality, high‑performance data lines, particularly in the automotive, industrial, and consumer electronics sectors. The country’s strong industrial base, coupled with its high standards for technological innovation, makes magnetic absorption data lines essential for high‑performance applications, such as reducing electromagnetic interference in automotive and smart device systems.
Germany’s robust automotive sector, which is increasingly adopting electric vehicles and autonomous driving technologies, requires reliable and fast‑charging solutions, further propelling demand for advanced data lines. The consumer electronics market in Germany is expanding, with increasing consumer adoption of premium accessories for smartphones, tablets, and other smart devices. The German market also benefits from a strong focus on sustainability and energy efficiency, which aligns well with the growth of technologies designed to improve data transmission and reduce interference. As Germany continues to lead in innovation and quality manufacturing, its magnetic absorption data line market will likely remain strong, with growth in both industrial and consumer sectors.
Brazil is experiencing a 6.4% CAGR in the magnetic absorption data line market, driven by a growing consumer electronics market, improving infrastructure, and rising smartphone adoption. As one of the largest economies in Latin America, Brazil is seeing a surge in demand for mobile phones, computers, and other electronic devices, creating a strong need for reliable and efficient data transmission solutions like magnetic absorption data lines. The expanding middle class and increased disposable incomes have also contributed to higher demand for premium accessories.
Furthermore, Brazil’s improving retail and distribution networks have made these products more accessible to consumers in both urban and rural areas. The government’s push for technological advancements, such as the expansion of 4G and upcoming 5G networks, has further boosted demand for fast‑charging solutions. With the rise of e‑commerce, online sales channels have become an important platform for the distribution of data lines. As more consumers adopt smartphones and other smart devices, the demand for accessories like magnetic absorption cables is expected to grow. Brazil’s ongoing investments in infrastructure and consumer electronics are likely to continue driving the market for magnetic absorption data lines in the coming years.
The USA is witnessing steady growth in the magnetic absorption data line market, with a 5.8% CAGR. As a mature market for electronics, the demand for high‑performance charging solutions is driven by the widespread use of smartphones, laptops, and other smart devices. Consumers in the USA increasingly seek advanced accessories that offer faster charging, better data transfer speeds, and reduced electromagnetic interference, making magnetic absorption data lines an attractive choice. The adoption of 5G technology and the growing Internet of Things (IoT) ecosystem are also propelling the demand for such cables, as they provide the necessary performance required for modern applications.
The USA automotive sector’s transition to electric vehicles and the rise of autonomous driving technologies have increased the need for high‑quality data lines to support the complex electronics used in vehicles. Moreover, the USA has a well‑developed e‑commerce industry, providing a large platform for the distribution of these accessories. As consumers prioritize durability and performance, the market for magnetic absorption data lines in the USA is set for continued steady growth, fueled by both consumer demand and the ongoing push for technological advancement across industries.
The UK is witnessing steady growth in the magnetic absorption data line market, with a 5.2% CAGR. The increasing adoption of advanced mobile devices, coupled with a rising demand for efficient and reliable charging solutions, is driving the need for high‑quality data lines in the country. The UK is also experiencing significant growth in the use of IoT devices and smart home technologies, which require high-performance cables for seamless data transmission and fast charging.
The country’s focus on upgrading telecommunications infrastructure, including the roll-out of 5G networks, is contributing to the need for more advanced charging and data lines. The growing trend of e‑commerce has made these accessories more accessible to a wide range of consumers, further driving market growth. In the automotive sector, the rise of electric vehicles and smart technology adoption also plays a role in increasing demand for magnetic absorption data lines. Furthermore, the UK’s commitment to sustainability and energy efficiency aligns with the trend towards improved technology designed to optimize data transfer speeds and reduce interference. As the UK continues to advance in technology and infrastructure, the demand for magnetic absorption data lines is expected to maintain steady growth.
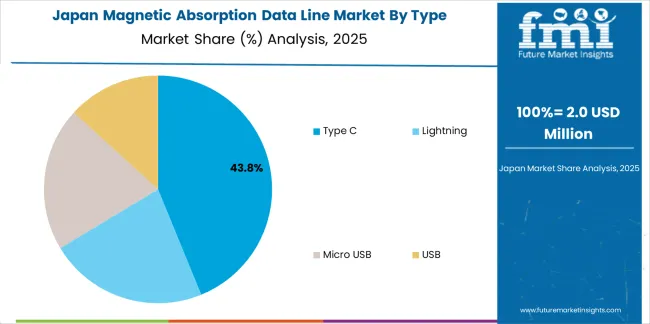
Japan is experiencing steady growth in the magnetic absorption data line market, with a 4.6% CAGR, driven by technological advancements and the country’s strong focus on quality in electronics. Japan’s high standards for consumer electronics and automotive technologies contribute to the growing demand for high-performance data lines. As the adoption of 5G technology accelerates and the Internet of Things (IoT) continues to expand, the need for fast, efficient data transmission and high‑quality charging solutions is increasing. The automotive industry, particularly with the rise of electric vehicles, further drives the demand for reliable and durable data lines.
Japan’s mature market is characterized by a focus on innovation and precision, and the country’s leading role in manufacturing high‑quality electronics and automotive components ensures a consistent demand for premium data line products. Japan’s well‑established e‑commerce platforms make these products easily accessible to a broad consumer base. As the country continues to lead in technology and consumer electronics innovation, Japan’s magnetic absorption data line market is set to experience steady growth, with an emphasis on performance, quality, and efficiency in line with global technological advancements.
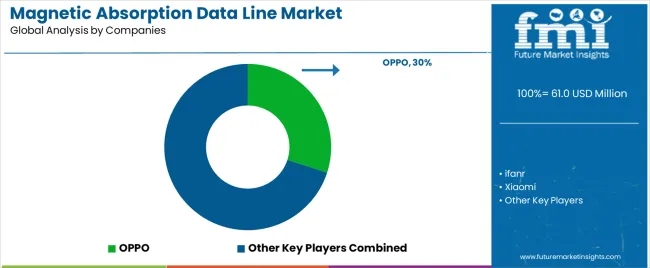
The magnetic absorption data line market is currently dominated by a few key players, with OPPO holding a significant 30% market share. OPPO's strong position is driven by its innovative product designs and its ability to meet consumer demands for high-quality, durable data lines equipped with magnetic absorption technology. The company’s focus on creating sleek, functional products has allowed it to capture a substantial portion of the market.
Emerging players like ifanr, Xiaomi, and Dudado are also contributing to the competition. Xiaomi, known for its extensive consumer electronics portfolio, has capitalized on its brand presence and technological expertise to create competitive magnetic absorption data lines. Similarly, ifanr brings unique design and functionality to the market, while Dudado focuses on affordable yet reliable solutions, catering to a more budget-conscious segment of consumers.
The competition is largely driven by factors such as product quality, pricing, design innovation, and brand recognition. As consumer demand for fast-charging and durable data lines grows, these companies continue to innovate, pushing the market towards more efficient, user-friendly, and technologically advanced products. The market dynamics are shaped by the continuous efforts of these companies to enhance product features, durability, and performance, ensuring that consumers have access to high-quality charging solutions.
| Items | Values |
|---|---|
| Quantitative Units (2025) | USD million |
| Type | Type C, Lightning, Micro USB, USB |
| Application | Online Sales, Offline Sales |
| Regions Covered | Asia Pacific, Europe, North America, Latin America, Middle East & Africa |
| Countries Covered | China, Japan, South Korea, India, Australia & New Zealand, ASEAN, Rest of Asia Pacific, Germany, United Kingdom, France, Italy, Spain, Nordic, BENELUX, Rest of Europe, United States, Canada, Mexico, Brazil, Chile, Rest of Latin America, Kingdom of Saudi Arabia, Other GCC Countries, Turkey, South Africa, Other African Union, Rest of Middle East & Africa |
| Key Companies Profiled | OPPO, Ifanr, Xiaomi, Dudado |
| Additional Attributes | Dollar sales by type and application categories, market growth trends, market adoption by classification and application segments, regional adoption trends, competitive landscape, magnetic absorption data line technological advancements, integration with consumer electronics. |
The global magnetic absorption data line market is estimated to be valued at USD 61.0 million in 2025.
The market size for the magnetic absorption data line market is projected to reach USD 110.3 million by 2035.
The magnetic absorption data line market is expected to grow at a 6.1% CAGR between 2025 and 2035.
The key product types in magnetic absorption data line market are type c, lightning, micro usb and usb.
In terms of application, online sales segment to command 60.0% share in the magnetic absorption data line market in 2025.


Our Research Products

The "Full Research Suite" delivers actionable market intel, deep dives on markets or technologies, so clients act faster, cut risk, and unlock growth.

The Leaderboard benchmarks and ranks top vendors, classifying them as Established Leaders, Leading Challengers, or Disruptors & Challengers.

Locates where complements amplify value and substitutes erode it, forecasting net impact by horizon

We deliver granular, decision-grade intel: market sizing, 5-year forecasts, pricing, adoption, usage, revenue, and operational KPIs—plus competitor tracking, regulation, and value chains—across 60 countries broadly.

Spot the shifts before they hit your P&L. We track inflection points, adoption curves, pricing moves, and ecosystem plays to show where demand is heading, why it is changing, and what to do next across high-growth markets and disruptive tech

Real-time reads of user behavior. We track shifting priorities, perceptions of today’s and next-gen services, and provider experience, then pace how fast tech moves from trial to adoption, blending buyer, consumer, and channel inputs with social signals (#WhySwitch, #UX).

Partner with our analyst team to build a custom report designed around your business priorities. From analysing market trends to assessing competitors or crafting bespoke datasets, we tailor insights to your needs.
Supplier Intelligence
Discovery & Profiling
Capacity & Footprint
Performance & Risk
Compliance & Governance
Commercial Readiness
Who Supplies Whom
Scorecards & Shortlists
Playbooks & Docs
Category Intelligence
Definition & Scope
Demand & Use Cases
Cost Drivers
Market Structure
Supply Chain Map
Trade & Policy
Operating Norms
Deliverables
Buyer Intelligence
Account Basics
Spend & Scope
Procurement Model
Vendor Requirements
Terms & Policies
Entry Strategy
Pain Points & Triggers
Outputs
Pricing Analysis
Benchmarks
Trends
Should-Cost
Indexation
Landed Cost
Commercial Terms
Deliverables
Brand Analysis
Positioning & Value Prop
Share & Presence
Customer Evidence
Go-to-Market
Digital & Reputation
Compliance & Trust
KPIs & Gaps
Outputs
Full Research Suite comprises of:
Market outlook & trends analysis
Interviews & case studies
Strategic recommendations
Vendor profiles & capabilities analysis
5-year forecasts
8 regions and 60+ country-level data splits
Market segment data splits
12 months of continuous data updates
DELIVERED AS:
PDF EXCEL ONLINE
Magnetic Material Magnetization and Testing Equipment Market Size and Share Forecast Outlook 2025 to 2035
Magnetic Coupler Market Size and Share Forecast Outlook 2025 to 2035
Magnetic Shielding Device Market Size and Share Forecast Outlook 2025 to 2035
Magnetic Stripe Readers Market Size and Share Forecast Outlook 2025 to 2035
Magnetic Resonance Analyzer Market Size and Share Forecast Outlook 2025 to 2035
Magnetic Drive Pump Market Size and Share Forecast Outlook 2025 to 2035
Magnetic Separator Market Size and Share Forecast Outlook 2025 to 2035
Magnetic Ballast Market Size and Share Forecast Outlook 2025 to 2035
Magnetic Sensor Market Size and Share Forecast Outlook 2025 to 2035
Magnetic Flowmeter Market Size and Share Forecast Outlook 2025 to 2035
Magnetic Resonance Imaging Coils Market Analysis - Size, Share, and Forecast 2025 to 2035
Magnetic Tape Market Analysis Size and Share Forecast Outlook 2025 to 2035
Magnetic Resonance Imaging (MRI) Contrast Agents Market Size and Share Forecast Outlook 2025 to 2035
Magnetic Crack Detectors Market Size and Share Forecast Outlook 2025 to 2035
Magnetic Materials Market Growth - Trends & Forecast 2025 to 2035
Magnetic Resonance Imaging (MRI) Market Trends - Size, Share & Forecast 2025 to 2035
Magnetic Grill Market Analysis – Trends, Growth & Forecast 2025 to 2035
Magnetic Closure Boxes Market Trends - Growth & Demand 2025 to 2035
Magnetic Charging Cable Market Trends - Growth & Forecast 2025 to 2035
Magnetic Flow Meter Market Analysis by Product Type, Components, Technology, Application and Region - Trends, Growth & Forecast 2025 to 2035

Thank you!
You will receive an email from our Business Development Manager. Please be sure to check your SPAM/JUNK folder too.
Chat With
MaRIA