

- Market Size (2026)
- USD 1.8 Bn
- Forecast (2036)
- USD 9.0 Bn
- CAGR (2026 to 2036)
- 17.5%
How big is the Border & Perimeter Surveillance Towers Market in 2026?
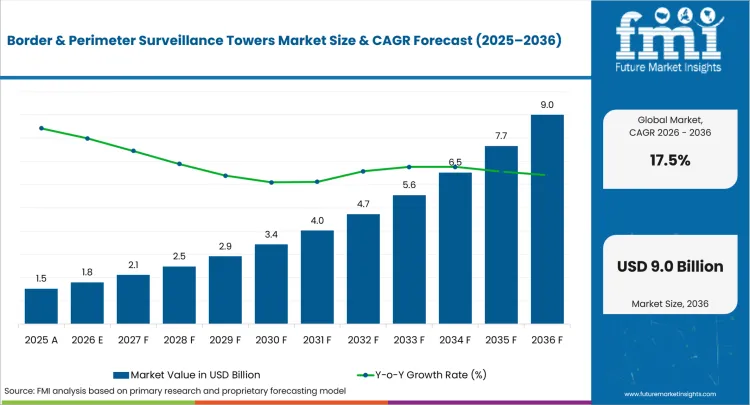
USD 1.8 billion in 2026 and USD 9.0 billion by 2036 at a 17.5% CAGR.
Demand for border & perimeter surveillance towers is projected to expand at 17.5% CAGR between 2026 and 2036, increasing valuation from USD 1.8 billion in 2026 to USD 9.0 billion by 2036. Border agencies and infrastructure operators require elevated surveillance points supporting persistent detection across remote terrain and long perimeter stretches. Growing security demands directly intensify operational reliance on high-visibility infrastructure. United States Customs and Border Protection reported in November 2025 that Border Patrol apprehensions between ports of entry at the southwest border totalled 237,538 in fiscal year 2025, the lowest level recorded since 1970. Sharply lower detected flow shifts the monitoring rationale from volume to persistent coverage of remote corridors where activity is harder to observe.
Different international territories require specific technological adaptations to match local enforcement policies. For instance, United States programs favor certified autonomous towers and south-border integration files. Eastern Europe agencies prefer modular frontier coverage and rugged sensor packages, with European Union entities stressing on interoperability and shared border-management systems before expanding tower networks. Custom configurations become vital as multinational security frameworks implement stricter transit verification. European Commission reported in November 2025 stating Entry/Exit System registers non-EU nationals travelling for short stays in 29 European countries. Resulting in comprehensive network registration strengthening external-border data review for connected security programs globally.
Key Takeaways of Border & Perimeter Surveillance Towers Market
- Demand for border & perimeter surveillance towers is driven by agencies seeking persistent watch capability across remote land borders and critical sites, with buyer decisions reflecting sensor reliability and command-room compatibility.
- By component, sensors & hardware are expected to lead with 50.0% share in 2026, driven by camera and thermal-imaging requirements.
- Land borders are the dominant application segment, projected to hold 48.0% share in 2026, reflecting the need for persistent monitoring across remote frontier coverage.
- Autonomous surveillance towers are estimated to lead the product category with 46.0% share in 2026, led by reduced manual watch burden.
- Sensor range, maintenance access, and control-room integration remain critical to supplier evaluation, as system integrators seek vendors that reduce handoffs during installation.
- Eastern Europe, the United States, and the European Union are expected to form the higher-growth region tier, advancing at 19.0%, 18.0%, and 17.0% CAGR respectively through 2036, supported by border pressure and tower modernization plans.
- Competition centers on Anduril Industries, General Dynamics Information Technology, Elbit Systems, HENSOLDT AG, and Magos Systems, with vendors differentiating through autonomous detection quality, sensor integration, and field deployment evidence.
Analyst Perspective
"The border and perimeter surveillance towers market is evolving as security agencies seek solutions that deliver continuous situational awareness across diverse operating environments. Investment decisions are influenced by dependable sensor performance, seamless integration with command-and-control systems, and validated detection capability under real-world conditions. Vendors that combine robust surveillance technologies with deployment expertise, operator training, and responsive field support are likely to secure long-term programs across border security and critical infrastructure protection."
- Nikhil Kaitwade, Principal Consultant for Industrial Automation at Future Market Insights
Source: Future Market Insights analysis, 2026.
How is Border & Perimeter Surveillance Towers Market segmented?
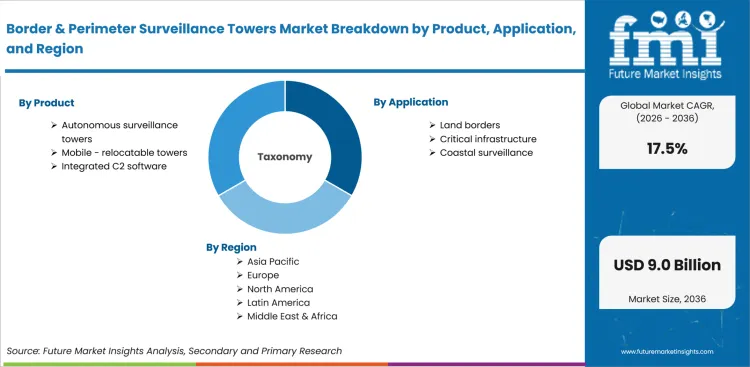
The border & perimeter surveillance towers industry is segmented by product, application, component, end user, business model and region.
The border & perimeter surveillance towers sector covers six parent segments. Product coverage includes autonomous surveillance towers alongside mobile-relocatable towers and integrated command-control software. Application coverage includes land borders, critical infrastructure and coastal surveillance. Component coverage includes sensors & hardware, AI software and services. End user coverage includes border agencies, defense forces and infrastructure operators. Business model coverage includes programs, as-a-service and direct sale. Regional coverage includes North America and Latin America. Coverage also includes Europe, East Asia, South Asia, Oceania and Middle East and Africa.
How do autonomous surveillance towers shape product purchasing?
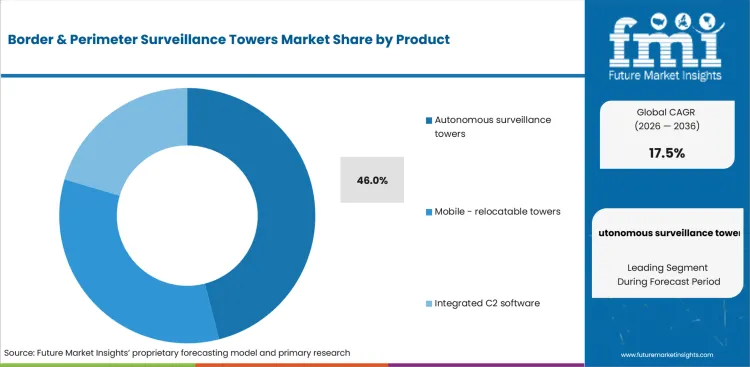
Anduril Industries reported in September 2024 deploying its 300th autonomous surveillance tower for United States Customs and Border Protection, showcasing operational acceptance for tower-based border awareness. The deployment evidence is anticipated to raise buyer review of autonomous tower formats used across border security technologies. Autonomous surveillance towers are estimated to lead product purchasing as security teams seek persistent watch capability without constant manual monitoring. Agencies value systems supporting sensor fusion and control-room alerts during field operations.
- Autonomous surveillance towers are set to garner 46.0% share in 2026, helped by persistent monitoring and reduced manual watch requirements. Buyers prefer autonomous formats after classification and alert records are documented.
- Mobile-relocatable towers and integrated command-control software support temporary deployments or centralized decision rooms. Autonomous tower formats retain selection strength after agencies need repeatable coverage across remote sites.
How do land borders influence application demand?
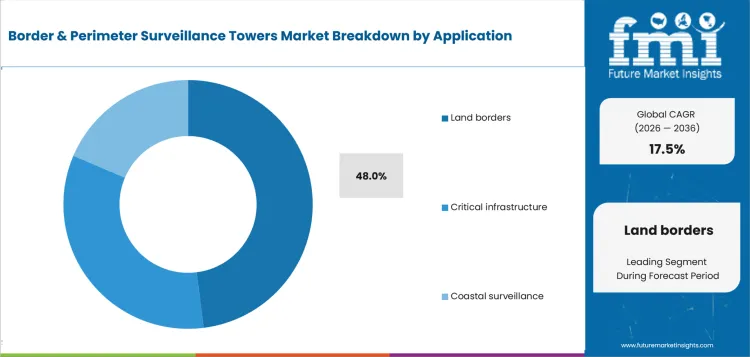
Land borders are anticipated to guide application demand as long frontiers need durable tower coverage across uneven terrain and sparse patrol zones. Agencies assess communications continuity and evidence review before moving from trial sites to program-level deployments. Frontex reported in January 2026 stating detections of irregular border crossings at European Union external borders fell by 26% to almost 178,000 in 2025, reflecting route shifts requiring adaptable surveillance coverage. Land-border tower demand is likely to connect with homeland security planning and border response readiness.
- By application, land borders are expected to capture 48.0% share in 2026 as agencies need persistent observation across remote frontier corridors. Vendors gain approval after tower layouts show terrain-specific detection performance and response support.
- Critical infrastructure and coastal surveillance support separate use patterns around fenced sites and maritime approaches. Land borders secure preference after agencies compare coverage gaps and field response time across frontier zones.
How do sensors & hardware support component demand?
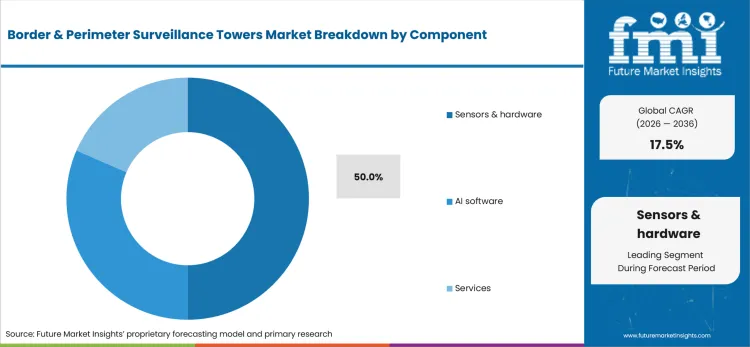
Sensors & hardware are projected to support component spending as buyers link tower usefulness with thermal imaging and communications equipment. Security teams compare detection distance and tower structure durability before approving field deployment. General Dynamics Information Technology stated in June 2026 its autonomous towers integrate advanced artificial intelligence with 5G and satellite communication capabilities, highlighting integrated hardware needs in active border operations. Such component depth is expected to support adjacent review of security and surveillance equipment.
- Sensors & hardware are likely to secure 50.0% share in 2026, driven by radar and thermal-imaging needs. Buyers prefer hardware-led packages after detection accuracy and field durability records support tower approvals.
- AI software and services complete component need across alert filtering and maintenance support. Sensors & hardware retain preference after agencies need dependable detection before expanding analytics layers.
How do border agencies support end user demand?
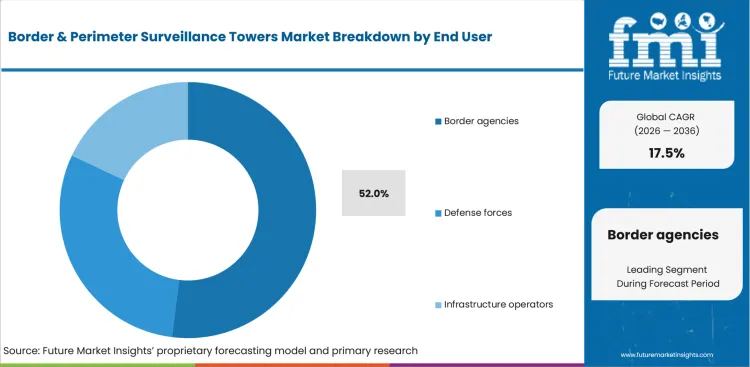
United States Customs and Border Protection reported in June 2024 stating Border Patrol conducted 503 rescues in May 2024, reflecting terrain and safety pressures that support surveillance review across difficult corridors. This operational exposure supports agency review of tower systems and AI in video surveillance tools. Border agencies are expected to support end user demand as national border missions require persistent surveillance over large outdoor areas. Agency buyers assess tower placement and evidence transfer before approving long-term programs.
- Based on the end user, border agencies are anticipated to account for 52.0% share in 2026 due to persistent frontier watch requirements. Agency approval improves after tower evidence supports patrol prioritization and control-room response.
- Defense forces and infrastructure operators use tower systems for substations and industrial sites. Border agencies gain selection priority after recurring surveillance missions demand field-tested platforms.
How do programs shape business model demand?
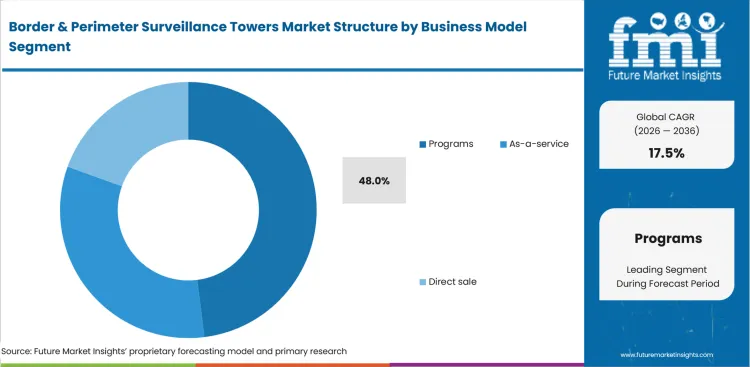
Programs are estimated to support business model demand as government buyers prefer structured awards and multi-site deployment planning. Security teams often need staged acceptance covering pilot sites and service response before wider adoption.The European Commission's Border Management and Visa Instrument for 2021 to 2027 channels external-border funding to member states through multiannual national programmes, underlining program-led buying paths across border management and visa systems. Program-based buying is likely to support connected review of perimeter intrusion detection systems.
- Programs are projected to hold 48.0% share of model in 2026, helped by formal budget cycles and staged deployment checks. Buyers prefer program models after site surveys and service terms align.
- As-a-service and direct sale models support smaller deployments or faster site additions. Programs retain preference after border agencies need service ownership and equipment standardization.
What are drivers, restraints, and opportunities in Border & Perimeter Surveillance Towers Market?
Purchases advance through surveillance coverage needs, with terrain suitability and program checks restraining adoption.
- Driver: Border agencies and infrastructure operators are replacing manual watch gaps with tower systems designed to support persistent detection and faster response review.
- Restraint: Adoption slows if communications continuity and privacy review remain unresolved during approval. Service responsibilities also affect review timing.
- Opportunity: Vendors offering increrasing deployment support and command-room integration improve approval chances across border agencies and critical-site operators.
Border operations create continuous need for elevated surveillance systems used to watch perimeter fences and low-light corridors. United States Customs and Border Protection reported in June 2026 stating a typical fiscal year 2025 day involved 6 rescues and medical lifesaving responses, highlighting safety pressures across field operations. Such activity is expected to increase demand for tower systems supporting detection review and patrol prioritization.
Securing new programs remains difficult after standard surveillance claims fail to match weather and communications realities at remote sites. Frontex reported in November 2025 irregular entries into the European Union dropped by 22% in the first 10 months of 2025 to 152,000, reflecting route shifts affecting equipment planning and deployment timing. Changing pressure patterns make buyers demand stronger site evidence before approving fixed or relocatable towers.
Growth avenues are anticipated as agencies add technology support for field officers and control rooms. Frontex reported in December 2025 stating the European Border and Coast Guard Standing Corps is planned to reach 10,000 officers by 2027, highlighting larger operational networks needing shared awareness tools. Such staffing support is projected to increase interest in towers linked with alert triage and command-center workflows.
What country CAGRs are profiled in Border & Perimeter Surveillance Towers Market?
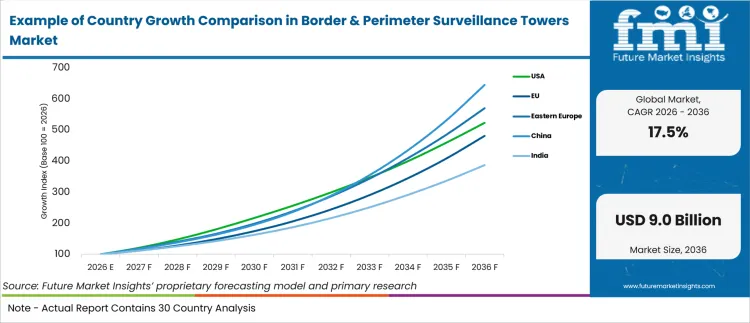
| Country / Region | CAGR |
|---|---|
| Eastern Europe | 19.0% |
| United States | 18.0% |
| European Union | 17.0% |
Source: Future Market Insights analysis, 2026.
How do country-level CAGRs compare in Border & Perimeter Surveillance Towers Market?
The country comparison spans 2.0 percentage points and shows a tightly clustered growth outlook across the border & perimeter surveillance towers market. Eastern Europe leads at 19.0% CAGR, while the United States and the European Union follow within a narrow 2.0-point range. The limited spread suggests that investment remains focused on strengthening border monitoring and protecting critical infrastructure, although the priorities shaping deployment differ across these markets.
- With a CAGR of 19.0%, Eastern Europe occupies the leading position. Heightened attention to border monitoring, cross-border security and protection of strategic transport corridors continues to encourage deployment of fixed surveillance towers equipped with advanced sensing and long-range observation capabilities.
- A 1.0 percentage point gap places the United States just behind Eastern Europe at 18.0%. Adoption reflects continued modernization of border surveillance systems and growing use of integrated platforms that combine electro-optical sensors, radar, thermal imaging and AI-assisted monitoring to improve situational awareness across extensive border areas.
- The European Union records a CAGR of 17.0%, remaining 1.0 percentage point below the United States. Market activity is linked to coordinated external border management, protection of critical infrastructure and investment in interoperable surveillance networks across member states. Adoption levels differ because security priorities, terrain and implementation schedules vary across individual countries.
Comparable CAGRs can still produce different market entry conditions. Differences in border security policies, surveillance infrastructure, technology integration and investment priorities influence deployment timelines and long-term commercial opportunities. The full report provides country-level CAGR analysis across North America, Latin America, Europe, East Asia, South Asia, Oceania and the Middle East and Africa.
Country-wise Analysis
Security funding and tower program readiness are expected to shape border & perimeter surveillance tower adoption across countries. Field service access also shapes vendor selection. Eastern Europe buyers are projected to emphasize rapid frontier coverage and modular deployment. United States buyers are anticipated to connect adoption with certified autonomous tower systems. European Union buyers are likely to connect demand with integrated border management and interoperability review.
- Frontier pressure alongside stronger security reviews drives market projections, with the sale in Eastern Europe as expected to post 19.0% CAGR by 2036. Advanced observation systems allow agencies to maintain persistent situational awareness even when migration patterns fluctuate. Frontex reported in August 2025, stating Eastern Land Borders recorded 45% drop in crossings during first 7 months of 2025, reflecting active monitoring needs despite lower detected flow.
- United States Customs and Border Protection reported in June 2025, stating Border Patrol encountered 8,725 people crossing southwest border between ports of entry during May 2025. Integrating automated sensor platforms ensures comprehensive coverage across vast, challenging terrains to address such encounters. Leading the market in United States as likely to increase at 18.0% CAGR through 2036, driven by autonomous tower certification and southern-border deployment planning.
- European Commission reported in April 2026, stating Entry/Exit System became fully operational across all Schengen countries. Entry/Exit System becoming fully operational across all Schengen countries reflects wider border-control modernization. Adopting unified digital infrastructure helps member nations synchronize observation efforts while hardening collective security. External-border coordination and shared technology programs influence demand in the European as projected to grow at 17.0% CAGR between 2026 and 2036.
Who are notable companies in Border & Perimeter Surveillance Towers Market?
Anduril Industries and General Dynamics Information Technology are expected to shape market direction due to autonomous surveillance tower programs. Elbit Systems adds border defense and command-control depth. HENSOLDT AG supports sensor and reconnaissance capability. Magos Systems adds radar-led perimeter detection for critical-site protection.
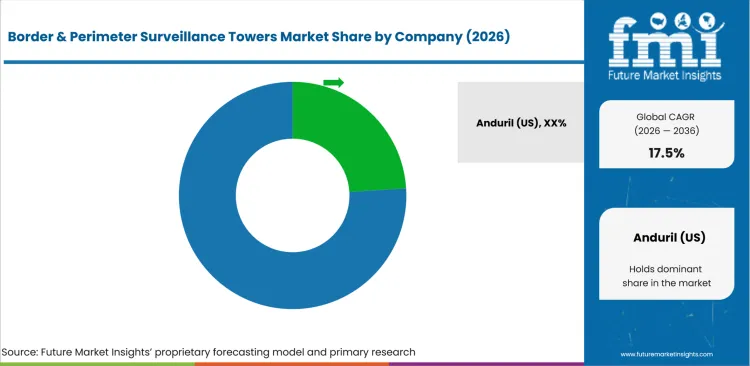
Border & perimeter surveillance towers industry is anticipated to compete centering on autonomous detection quality and field deployment proof. Sensor pairing and command-room integration guide final vendor review. Account teams are likely to compare vendors based on integration files and support for multi-site security programs after first approval. Anduril Industries is expected to receive review attention due to autonomous tower deployments. General Dynamics Information Technology is anticipated to add certification support. Elbit Systems is projected to compete fueled by border defense and sensor management capability. HENSOLDT AG is estimated to compete based on optronics and reconnaissance depth. Magos Systems is forecast to support demand through perimeter radar and video integration.
- Anduril Industries and General Dynamics Information Technology are expected to gain account attention based on autonomous tower depth and field program experience. Tower deployment evidence is likely to promote programs needing rapid detection and alert triage.
- Elbit Systems and HENSOLDT AG are anticipated to compete driven by sensor integration and command-control capability. Border agencies are projected to review such vendors as missions require multi-sensor awareness across large outdoor areas.
- Magos Systems is forecast to support critical-infrastructure and perimeter programs depending on radar-led detection. Vendor attention is likely to improve as site operators need fewer false alarms and better camera cueing.
Competitive Benchmarking: Border & Perimeter Surveillance Towers Market
| Company | Portfolio Depth | Tower Format Match | Application Support | Service Reach |
|---|---|---|---|---|
| Anduril Industries | High | High | High | Global |
| General Dynamics Information Technology | High | High | High | Global |
| Elbit Systems | High | Medium | High | Global |
| HENSOLDT AG | High | Medium | High | Global |
| Magos Systems | Medium | Medium | Medium | Regional/Global |
Source: Future Market Insights competitive analysis, 2026.
Key Developments in Border & Perimeter Surveillance Towers Market
- In February 2026, Elbit Systems secured contracts of over USD 100 million for border defense and command-control capabilities. Elbit Systems stated in February 2026 the MARS program would manage sensor and effector arrays for border protection, supporting future multi-sensor tower and perimeter programs.
- In April 2026, General Dynamics Information Technology announced its autonomous surveillance towers had attained certification from United States Customs and Border Protection. General Dynamics Information Technology stated in April 2026 the certification validated autonomous surveillance capabilities, improving buyer confidence for broader tower deployment.
- In December 2025, United States Customs and Border Protection awarded Anduril Industries a USD 363 million one-year contract for more than 200 Extended Range Sentry Towers, announced by the company on 12 June 2026. Anduril stated the award would expand autonomous situational awareness across the southwest border, adding long-range coverage alongside the more than 350 Standard Range Sentry systems already operating for the agency.
Key Players in Border & Perimeter Surveillance Towers Market
Autonomous tower and border technology providers
- Anduril Industries
- General Dynamics Information Technology
Defense sensor and command-control providers
- Elbit Systems
- HENSOLDT AG
Perimeter radar and site protection specialists
- Magos Systems
Border & Perimeter Surveillance Towers Market - Report Scope
| Coverage field | Report scope |
|---|---|
| Market breakdown | Border & Perimeter Surveillance Towers Market breakdown by product, application, component, end user, business model and region |
| Quantitative Units | USD million in 2026 to USD million by 2036 at a CAGR |
| Market Definition | Border & perimeter surveillance towers are elevated security platforms using cameras, radar, thermal imaging, communications and analytics to support detection, classification, alerting and response across border and perimeter sites. |
| Regions Covered | North America and Latin America alongside Europe, East Asia, South Asia, Oceania and Middle East and Africa |
| Countries Covered | United States and European Union alongside Eastern Europe, Canada, Brazil, Mexico, Germany, United Kingdom, France, Italy, Spain, China, Japan, South Korea, India, Thailand, Indonesia, Australia, New Zealand, GCC countries, South Africa and Türkiye |
| Key Companies Profiled | Anduril Industries and General Dynamics Information Technology alongside Elbit Systems, HENSOLDT AG and Magos Systems |
| Forecast Period | 2026 to 2036 |
| Approach | Hybrid bottom-up and top-down methodology using segment share, country CAGR, border-security programs, sensor coverage, field deployment, vendor portfolio depth and service exposure |
Source: Future Market Insights analysis, 2026.
Border & Perimeter Surveillance Towers Market - Research Methodology
| Method | Approach |
|---|---|
| Primary Research | FMI analysts gathered input from manufacturers, service providers, technology developers, distributors, end users, procurement teams, and subject-matter experts. Interviews examined purchasing decisions, product or service evaluation, adoption barriers, approval requirements, pricing considerations, and expectations for technical or commercial support. Respondents were also asked what evidence is required before a trial, pilot, or initial order develops into regular purchasing. |
| Desk Research | Desk research covered government statistics, regulatory publications, trade data, industry associations, technical literature, standards, company filings, product information, and official corporate announcements. Sources were reviewed for relevance, publication date, geographic coverage, and consistency with the defined market scope. Claims relating to performance, applications, approvals, capacity, investment, and commercial activity were retained only when supported by credible public evidence. |
| Market Sizing and Forecasting | The market model combined the baseline value with historical performance, segment structure, pricing and volume indicators, adoption levels, company participation, and country-level demand conditions. Forecast assumptions considered economic activity, investment trends, regulatory developments, technology adoption, purchasing cycles, supply availability, and barriers to wider market use. Segment and regional estimates were reconciled before the final market total was calculated. |
| Data Validation | Estimates were checked against multiple independent indicators, including public data, company activity, trade patterns, industry developments, and findings from primary interviews. Validation also tested whether products, services, applications, and company revenues fell within the defined market boundaries. Adjacent categories, unsupported claims, overlapping revenues, and activities without direct market relevance were excluded to reduce double counting and maintain consistency across segments and countries. |
Source: Future Market Insights analysis, 2026.
Border & Perimeter Surveillance Towers Market by Segments
Border & Perimeter Surveillance Towers Market segmented by Product:
- Autonomous Surveillance Towers
- Mobile-relocatable Towers
- Integrated Command-control Software
Border & Perimeter Surveillance Towers Market segmented by Application:
- Land Borders
- Critical Infrastructure
- Coastal Surveillance
Border & Perimeter Surveillance Towers Market segmented by Component:
- Sensors & Hardware
- AI Software
- Services
Border & Perimeter Surveillance Towers Market segmented by End User:
- Border Agencies
- Defense Forces
- Infrastructure Operators
Border & Perimeter Surveillance Towers Market segmented by Business Model:
- Programs
- As-a-service
- Direct Sale
Border & Perimeter Surveillance Towers Market by Region:
- North America
- United States
- Canada
- Latin America
- Brazil
- Mexico
- Argentina
- Europe
- Germany
- United Kingdom
- France
- Italy
- Spain
- East Asia
- China
- Japan
- South Korea
- South Asia
- India
- Thailand
- Indonesia
- Oceania
- Australia
- New Zealand
- Middle East and Africa
- GCC countries
- South Africa
- Türkiye
Research Sources and Bibliography
- Anduril Industries. (2024, September 26). Anduril deploys 300th autonomous surveillance tower, advancing capability for border security.
- Anduril Industries. (2026, June 12). Anduril and USA Customs and Border Protection expand partnership with 200 additional Extended Range Sentry Towers.
- Elbit Systems. (2026, February 9). Elbit Systems secures over USD 100 million in contracts to advance digital warfare and border defense capabilities for the Israel Ministry of Defense.
- European Commission. (2025, November 13). Border crossing.
- European Commission. (2026, April 10). Entry/Exit System is fully operational.
- European Commission. (2026, July 6). Integrated Border Management Fund - Border Management and Visa Instrument 2021-27.
- Frontex. (2025, August 7). European Union external borders: Irregular crossings down 18% in the first 7 months of 2025.
- Frontex. (2025, November 12). European Union external borders: Irregular crossings fall 22% in the first 10 months of 2025.
- Frontex. (2025, December 12). Frontex launches EU-wide recruitment campaign.
- Frontex. (2026, January 15). Irregular border crossings down 26% in 2025, Europe must stay prepared.
- General Dynamics Information Technology. (2026, April 22). GDIT’s autonomous surveillance towers certified by USA Customs and Border Protection.
- General Dynamics Information Technology. (2026, June 25). GDIT awarded USD 71 million delivery order for autonomous surveillance towers to strengthen border security.
- United States Customs and Border Protection. (2024, June 20). CBP releases May 2024 monthly update.
- United States Customs and Border Protection. (2025, June 17). CBP releases May 2025 monthly update.
- United States Customs and Border Protection. (2025, November 14). CBP enforcement statistics fiscal year 2025.
- United States Customs and Border Protection. (2026, June 5). On a typical day in fiscal year 2025, CBP.
This bibliography is provided for reader reference and is not exhaustive. The full report contains the complete reference list and detailed citations.
This Report Answers
- What segments shape demand across product, application, component, end user and business model?
- How do border agencies evaluate surveillance towers before replacing manual watch models?
- How do country CAGRs differ across profiled regions?
- What companies compete through autonomous tower depth and sensor integration?
- How does FMI validate forecasts using a hybrid bottom-up and top-down approach?
- What factors do account teams address before wider account expansion?
- How do terrain proof and detection evidence affect vendor selection?
- What limits return on investment for teams adding surveillance towers to border programs?
- How do sensor records and installation guidance influence account approval?
- What vendor capabilities improve long-term account confidence?
Frequently Asked Questions
What supports demand in border & perimeter surveillance towers market?
Demand is likely to be supported by agencies needing tower systems protecting long borders and remote perimeters through persistent detection. Accounts are expected to prefer vendors combining autonomous monitoring proof and service response.
Who are key players in border & perimeter surveillance towers market?
Key companies are anticipated to include Anduril Industries and General Dynamics Information Technology among others supporting competition. Competition is likely to be based on tower certification and regional service coverage.
What restraint affects border & perimeter surveillance towers market?
A major restraint is the proof burden created during terrain review and communications evaluation across approval teams. Accounts slow adoption if towers lack site evidence or support needed for agency approval.
Why do executives track border & perimeter surveillance towers market?
Executives are expected to track border & perimeter surveillance tower demand as security-equipment choices affect detection reach and response readiness. Factors such as sensor uptime and vendor support shape buyer reviews.
What business problem does border & perimeter surveillance towers market address?
Border & perimeter surveillance towers market addresses the practical security gap created by teams needing persistent watch over remote land borders and critical sites. Agencies and infrastructure operators need tower systems supporting detection confidence and field-ready service evidence.
What do account teams evaluate before selecting vendors?
Account teams are likely to evaluate autonomy level and multi-site reliability before vendor approval. Sensor coverage support and technical documentation are expected to guide final vendor review.
What limits return on investment for purchasing teams?
Return on investment weakens if terrain coverage or account acceptance is not proven before wider deployment. Rework and relocation needs reduce expected security-program gains.
How do vendors build long-term account confidence?
Vendors build account confidence by providing consistent tower performance and evidence specific to border & perimeter surveillance towers. Installation records and responsive troubleshooting support are expected to influence repeat-order trust.
Preview the report firsthand - request a free sample
Get SampleGet the brochure for pricing and purchase details.
Get PDFTable of Content
- Key Takeaways
- Market Size and CAGR
- Top Growth Driver
- Fastest Growing Segment
- Leading Region
- Key Companies
- Emerging Opportunities
- Executive Summary
- Global Market Outlook
- Demand-side Trends
- Supply-side Trends
- Technology Roadmap Analysis
- Analysis and Recommendations
- Analyst Perspective (What is happening? Why now? What should investors know?)
- Key Questions Answered
- How large is the market?
- What is the CAGR?
- What are key trends?
- Which region dominates?
- Who are the leaders?
- Market Overview
- Market Coverage / Taxonomy
- Market Definition / Scope / Limitations
- Research Methodology
- Chapter Orientation
- Analytical Lens and Working Hypotheses
- Market Structure, Signals, and Trend Drivers
- Benchmarking and Cross-market Comparability
- Market Sizing, Forecasting, and Opportunity Mapping
- Research Design and Evidence Framework
- Desk Research Programme (Secondary Evidence)
- Expert Input and Fieldwork (Primary Evidence)
- Tooling, Models, and Reference Databases
- Data Engineering and Model Build
- Quality Assurance and Audit Trail
- Market Background
- Market Dynamics (Drivers, Restraints, Opportunity, Trends)
- Scenario Forecast (Optimistic, Likely, Conservative)
- Impact Analysis
- AI Impact
- Sustainability Impact
- Regulatory Impact
- Technology Impact
- Consumer / Buyer Analysis
- Purchase Drivers
- Adoption Barriers
- Buyer Journey
- Opportunity Map Analysis
- Product Life Cycle Analysis
- Supply Chain Analysis
- Investment Feasibility Matrix
- Value Chain Analysis
- PESTLE and Porter's Analysis
- Regulatory Landscape
- Regional Parent Market Outlook
- Production and Consumption Statistics
- Import and Export Statistics
- Global Market Analysis and Forecast, 2021 to 2036
- Historical Market Size Value (USD Billion) Analysis, 2021 to 2025
- Current and Future Market Size Value (USD Billion) Projections, 2026 to 2036
- Y-o-Y Growth Trend Analysis
- Absolute $ Opportunity Analysis
- Global Market Pricing Analysis, 2021 to 2036
- Global Market Analysis and Forecast, By Product, 2021 to 2036
- Introduction / Key Findings
- Historical Market Size Value (USD Billion) Analysis By Product, 2021 to 2025
- Current and Future Market Size Value (USD Billion) Analysis and Forecast By Product, 2026 to 2036
- Autonomous surveillance towers
- Mobile - relocatable towers
- Integrated C2 software
- Autonomous surveillance towers
- Y-o-Y Growth Trend Analysis By Product, 2021 to 2025
- Absolute $ Opportunity Analysis By Product, 2026 to 2036
- Global Market Analysis and Forecast, By Application, 2021 to 2036
- Introduction / Key Findings
- Historical Market Size Value (USD Billion) Analysis By Application, 2021 to 2025
- Current and Future Market Size Value (USD Billion) Analysis and Forecast By Application, 2026 to 2036
- Land borders
- Critical infrastructure
- Coastal surveillance
- Land borders
- Y-o-Y Growth Trend Analysis By Application, 2021 to 2025
- Absolute $ Opportunity Analysis By Application, 2026 to 2036
- Global Market Analysis and Forecast, By Component, 2021 to 2036
- Introduction / Key Findings
- Historical Market Size Value (USD Billion) Analysis By Component, 2021 to 2025
- Current and Future Market Size Value (USD Billion) Analysis and Forecast By Component, 2026 to 2036
- Sensors & hardware
- AI software
- Services
- Sensors & hardware
- Y-o-Y Growth Trend Analysis By Component, 2021 to 2025
- Absolute $ Opportunity Analysis By Component, 2026 to 2036
- Global Market Analysis and Forecast, By End User, 2021 to 2036
- Introduction / Key Findings
- Historical Market Size Value (USD Billion) Analysis By End User, 2021 to 2025
- Current and Future Market Size Value (USD Billion) Analysis and Forecast By End User, 2026 to 2036
- Border agencies
- Defense forces
- Infrastructure operators
- Border agencies
- Y-o-Y Growth Trend Analysis By End User, 2021 to 2025
- Absolute $ Opportunity Analysis By End User, 2026 to 2036
- Global Market Analysis and Forecast, By Business Model, 2021 to 2036
- Introduction / Key Findings
- Historical Market Size Value (USD Billion) Analysis By Business Model, 2021 to 2025
- Current and Future Market Size Value (USD Billion) Analysis and Forecast By Business Model, 2026 to 2036
- Programs
- As-a-service
- Direct sale
- Programs
- Y-o-Y Growth Trend Analysis By Business Model, 2021 to 2025
- Absolute $ Opportunity Analysis By Business Model, 2026 to 2036
- Global Market Analysis and Forecast, By Region, 2021 to 2036
- Introduction
- Historical Market Size Value (USD Billion) Analysis By Region, 2021 to 2025
- Current Market Size Value (USD Billion) Analysis and Forecast By Region, 2026 to 2036
- North America
- Latin America
- Western Europe
- Eastern Europe
- East Asia
- South Asia and Pacific
- Middle East & Africa
- Market Attractiveness Analysis By Region
- North America Market Analysis and Forecast, By Country, 2021 to 2036
- Historical Market Size Value (USD Billion) Trend Analysis By Market Taxonomy, 2021 to 2025
- Market Size Value (USD Billion) Forecast By Market Taxonomy, 2026 to 2036
- By Country
- USA
- Canada
- By Product
- By Application
- By Component
- By End User
- By Business Model
- By Country
- Market Attractiveness Analysis
- By Country
- By Product
- By Application
- By Component
- By End User
- By Business Model
- Key Takeaways
- Latin America Market Analysis and Forecast, By Country
- Historical Market Size Value (USD Billion) Trend Analysis By Market Taxonomy, 2021 to 2025
- Market Size Value (USD Billion) Forecast By Market Taxonomy, 2026 to 2036
- By Country
- Brazil
- Mexico
- Chile
- Rest of Latin America
- By Product
- By Application
- By Component
- By End User
- By Business Model
- By Country
- Market Attractiveness Analysis
- By Country
- By Product
- By Application
- By Component
- By End User
- By Business Model
- Key Takeaways
- Western Europe Market Analysis and Forecast, By Country
- Historical Market Size Value (USD Billion) Trend Analysis By Market Taxonomy, 2021 to 2025
- Market Size Value (USD Billion) Forecast By Market Taxonomy, 2026 to 2036
- By Country
- Germany
- UK
- Italy
- Spain
- France
- Nordic
- BENELUX
- Rest of Western Europe
- By Product
- By Application
- By Component
- By End User
- By Business Model
- By Country
- Market Attractiveness Analysis
- By Country
- By Product
- By Application
- By Component
- By End User
- By Business Model
- Key Takeaways
- Eastern Europe Market Analysis and Forecast, By Country
- Historical Market Size Value (USD Billion) Trend Analysis By Market Taxonomy, 2021 to 2025
- Market Size Value (USD Billion) Forecast By Market Taxonomy, 2026 to 2036
- By Country
- Russia
- Poland
- Hungary
- Balkan & Baltic
- Rest of Eastern Europe
- By Product
- By Application
- By Component
- By End User
- By Business Model
- By Country
- Market Attractiveness Analysis
- By Country
- By Product
- By Application
- By Component
- By End User
- By Business Model
- Key Takeaways
- East Asia Market Analysis and Forecast, By Country
- Historical Market Size Value (USD Billion) Trend Analysis By Market Taxonomy, 2021 to 2025
- Market Size Value (USD Billion) Forecast By Market Taxonomy, 2026 to 2036
- By Country
- China
- Japan
- South Korea
- By Product
- By Application
- By Component
- By End User
- By Business Model
- By Country
- Market Attractiveness Analysis
- By Country
- By Product
- By Application
- By Component
- By End User
- By Business Model
- Key Takeaways
- South Asia and Pacific Market Analysis and Forecast, By Country
- Historical Market Size Value (USD Billion) Trend Analysis By Market Taxonomy, 2021 to 2025
- Market Size Value (USD Billion) Forecast By Market Taxonomy, 2026 to 2036
- By Country
- India
- ASEAN
- Australia & New Zealand
- Rest of South Asia and Pacific
- By Product
- By Application
- By Component
- By End User
- By Business Model
- By Country
- Market Attractiveness Analysis
- By Country
- By Product
- By Application
- By Component
- By End User
- By Business Model
- Key Takeaways
- Middle East & Africa Market Analysis and Forecast, By Country
- Historical Market Size Value (USD Billion) Trend Analysis By Market Taxonomy, 2021 to 2025
- Market Size Value (USD Billion) Forecast By Market Taxonomy, 2026 to 2036
- By Country
- Kingdom of Saudi Arabia
- Other GCC Countries
- Türkiye
- South Africa
- Other African Union
- Rest of Middle East & Africa
- By Product
- By Application
- By Component
- By End User
- By Business Model
- By Country
- Market Attractiveness Analysis
- By Country
- By Product
- By Application
- By Component
- By End User
- By Business Model
- Key Takeaways
- Key Countries Market Analysis
- USA
- Pricing Analysis
- Market Share Analysis, 2025
- By Product
- By Application
- By Component
- By End User
- By Business Model
- Canada
- Pricing Analysis
- Market Share Analysis, 2025
- By Product
- By Application
- By Component
- By End User
- By Business Model
- Mexico
- Pricing Analysis
- Market Share Analysis, 2025
- By Product
- By Application
- By Component
- By End User
- By Business Model
- Brazil
- Pricing Analysis
- Market Share Analysis, 2025
- By Product
- By Application
- By Component
- By End User
- By Business Model
- Chile
- Pricing Analysis
- Market Share Analysis, 2025
- By Product
- By Application
- By Component
- By End User
- By Business Model
- Germany
- Pricing Analysis
- Market Share Analysis, 2025
- By Product
- By Application
- By Component
- By End User
- By Business Model
- UK
- Pricing Analysis
- Market Share Analysis, 2025
- By Product
- By Application
- By Component
- By End User
- By Business Model
- Italy
- Pricing Analysis
- Market Share Analysis, 2025
- By Product
- By Application
- By Component
- By End User
- By Business Model
- Spain
- Pricing Analysis
- Market Share Analysis, 2025
- By Product
- By Application
- By Component
- By End User
- By Business Model
- France
- Pricing Analysis
- Market Share Analysis, 2025
- By Product
- By Application
- By Component
- By End User
- By Business Model
- India
- Pricing Analysis
- Market Share Analysis, 2025
- By Product
- By Application
- By Component
- By End User
- By Business Model
- ASEAN
- Pricing Analysis
- Market Share Analysis, 2025
- By Product
- By Application
- By Component
- By End User
- By Business Model
- Australia & New Zealand
- Pricing Analysis
- Market Share Analysis, 2025
- By Product
- By Application
- By Component
- By End User
- By Business Model
- China
- Pricing Analysis
- Market Share Analysis, 2025
- By Product
- By Application
- By Component
- By End User
- By Business Model
- Japan
- Pricing Analysis
- Market Share Analysis, 2025
- By Product
- By Application
- By Component
- By End User
- By Business Model
- South Korea
- Pricing Analysis
- Market Share Analysis, 2025
- By Product
- By Application
- By Component
- By End User
- By Business Model
- Russia
- Pricing Analysis
- Market Share Analysis, 2025
- By Product
- By Application
- By Component
- By End User
- By Business Model
- Poland
- Pricing Analysis
- Market Share Analysis, 2025
- By Product
- By Application
- By Component
- By End User
- By Business Model
- Hungary
- Pricing Analysis
- Market Share Analysis, 2025
- By Product
- By Application
- By Component
- By End User
- By Business Model
- Kingdom of Saudi Arabia
- Pricing Analysis
- Market Share Analysis, 2025
- By Product
- By Application
- By Component
- By End User
- By Business Model
- Türkiye
- Pricing Analysis
- Market Share Analysis, 2025
- By Product
- By Application
- By Component
- By End User
- By Business Model
- South Africa
- Pricing Analysis
- Market Share Analysis, 2025
- By Product
- By Application
- By Component
- By End User
- By Business Model
- USA
- Market Structure Analysis
- Competition Dashboard
- Competition Benchmarking
- Market Share Analysis of Top Players
- By Regional
- By Product
- By Application
- By Component
- By End User
- By Business Model
- Emerging Startups
- Innovation Benchmarking
- Competition Analysis
- Competition Deep Dive
- Anduril (US)
- Overview
- Product Portfolio
- Profitability by Market Segments
- Sales Footprint
- Strategy Overview
- Marketing Strategy
- Product Strategy
- Channel Strategy
- Elbit (IL)
- Hensoldt (DE)
- Magos (IL)
- Anduril (US)
- Case Studies
- Success Stories
- Recent Developments
- Competition Deep Dive
- Assumptions & Acronyms Used


