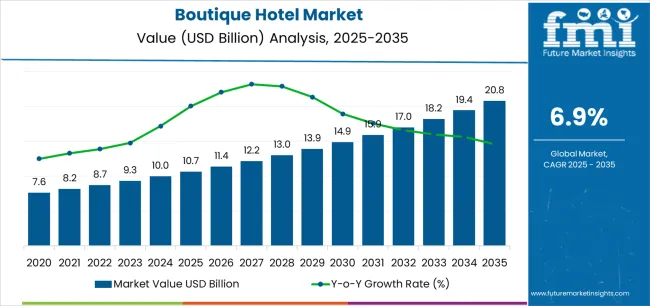
The boutique hotel market value is estimated to expand at a CAGR of 6.9% over the assessment period. In 2024, the market is expected to generate a revenue worth USD 9,962.60 million. By 2034-end, the market size is forecast to expand to USD 19,415.50 million.
Attributes | Key Insights |
---|---|
Estimated Boutique Hotel Market Size (2024E) | USD 9,962.60 million |
Projected Boutique Hotel Market Valuation (2034F) | USD 19,415.50 million |
Value-based CAGR (2024 to 2034) | 6.9% |
Leading Tour Type | Package Traveler |
---|---|
Value Share (2024) | 51.30% |
Package travelers contribute massively to the revenue generation in the boutique hotel sector. A growing segment of customers who appreciate personalized service, unique experiences, and stylish accommodations are contributing to the growth of this segment. Packaged tours offer itineraries that emphasize cultural experiences, curated activities, and off-the-beaten-path destinations to attract guests seeking a boutique hotel experience.
Packaged tours also combine accommodation, bundle flights, and activities at a discounted rate as opposed to booking separately, thus appealing to value-conscious price sensitive customers.
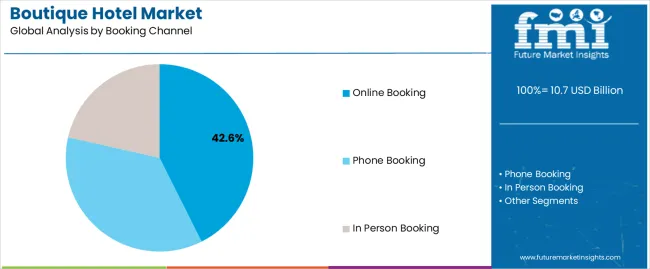
Leading Booking Channel | Online Booking |
---|---|
Value Share (2024) | 46.50% |
Based on the latest estimates by our analysts, the online booking segment is anticipated to acquire a massive market hold. This segment is driven by the widespread use of Internet services and mobile phones, through which the customer can fetch information regarding industries and make decisions for their next tourist destination point.
Even service providers think that marketing and promotion of their services attract a lot of customers. Further, the online booking channel provides unparalleled convenience to customers, boosting its growth size.
Countries | Forecast CAGR (2024 to 2034) |
---|---|
United States | 5.30% |
Canada | 7.20% |
Spain | 6.60% |
China | 7.80% |
India | 8.40% |
Industry participants in the United States boutique hotel industry are aiming for further growth over the next decade. As per recent estimates by our analysts, the market in the United States is estimated to register a CAGR of 5.30% through 2034.
The United States attracts a lot of tourists and travelers from across the world. This is giving momentum to the expansion of boutique hotels across the country. Sonder is a good case in point.
This tech-driven hospitality company raised USD 529.6 million to meet the demands of a global, nomadic workforce, who have gained higher mobility in the post-pandemic world. Enterprises in the industry are braving the environmental challenges faced by the country by partnering with committed conservation charities.
For future growth, leading players are forging exclusive strategic partnerships to expand their portfolio. For instance, in February 2024, Hilton collaborated with Small Luxury Hotels of the World (SLH) to welcome Hilton guests to independently-minded luxury hotels situated in sought-after destinations.
The boutique hotel sector in Canada is forecasted to expand at a CAGR of 7.20% through 2034. This category of hotels is increasingly preferred among today’s travelers due to many reasons, including their one-of-a-kind atmosphere.
One of the expansive metropolis cities in Canada, Toronto, is famous for its ensemble of boutique hotels that are situated all across its eclectic neighborhoods, giving travelers a perfect place to rest after a day of exploration.
Players in the industry are investing in smart-room experiences to attract high-end customers. In June 2023, INTELITY®, partnered with The Hazelton Hotel, a singular Forbes Five-Star luxury boutique hotel, in Toronto. The hotel has integrated the INTELITY platform to provide its guests with a modern and digital, smart-room experience.
The vibrant country of Spain is expected to experience a CAGR of 6.60% in its boutique hotel industry. Owners of boutique hotels are listing their properties on travel sites to increase visibility and trust among potential guests.
These sites promote touristic service providers by offering hotel reviews, guest ratings, special offers, and online bookings. Customers seeking an immersive experience of rich culture compare prices from a variety of boutique accommodations listed on these sites to book their stays.
Growing tourist attractions in Spain and aggressive promotion of the hospitality industry to stimulate economic activity within the country are fueling the boutique hotel expansion. Recently, Amancio Ortega, Zara founder, purchased two boutique hotels in Spain.
This sector is expected to unfold many opportunities for its investors and key players as customers are captivated by the distinct experiences of boutique hotels.
The boutique hotel sector in India is projected by our analysts to expand at a CAGR of 8.40% over the forecast period. Stakeholders and investors are eyeing India for their expansion due to the growing consumer appetite for boutique hotel experiences.
In November 2023, Relais & Châteaux, a luxury boutique hotel association, is considering expanding in India to cater to domestic as well as international tourists. Every part of the guest experience, be its wine list, food, bathroom, amenities, or service, will be given special focus to reflect consistency.
Growth in boutique hotel admirers in China is expected to fuel the market to develop at a CAGR of 7.80%. Demand for boutique hotels is projected to remain strong over the forecast period owing to increasing preferences for unique and personal luxury experiences among the middle-class section. By opting for boutique hotels, they get personalized service instead of the standardized service of conventional luxury hotels.
A key factor that is attracting investments in boutique hotels is their profitability potential. Boutique hotels require less upfront costs as opposed to large hotels, can ask for higher room rates owing to their exclusivity, and don’t require extensive amenities like ballrooms.
Players are expected to thoughtfully design boutique hotels to capture the growing customer segment of aesthetic admirers.
Market participants in the boutique hotel industry are honing their USP by focusing on certain key aspects that differentiate them from their competitors. This includes curating and creating themed experiences customized to guest requirements. Common guest’ requests observed over the years include pet-friendly havens and art-centric hotels.
Stakeholders are investing in technology to predict guest needs and offer bespoke experiences. Additionally, they are pairing up with local businesses to create a win-win situation for both of them. Boutique hotels partner with local shops, restaurants, and attractions to provide exclusive experiences and benefit the local community.
Key players are leveraging social media marketing to display their distinct offerings and engage with potential guests. With growing concerns for the environment, a segment of eco-conscious travelers is emerging. Key players are targeting them by introducing sustainable practices to limit their environmental impact.
Recent Advancements Made in the Boutique Hotel Market:
Table 1: Global Market Value (US$ Million) Forecast by Region, 2019 to 2034
Table 2: Global Market Value (US$ Million) Forecast by Hotel Type, 2019 to 2034
Table 3: Global Market Value (US$ Million) Forecast by Booking Channel, 2019 to 2034
Table 4: Global Market Value (US$ Million) Forecast by Tourist Type, 2019 to 2034
Table 5: Global Market Value (US$ Million) Forecast by Tour Type, 2019 to 2034
Table 6: Global Market Value (US$ Million) Forecast by Consumer Orientation, 2019 to 2034
Table 7: Global Market Value (US$ Million) Forecast by Age Group, 2019 to 2034
Table 8: North America Market Value (US$ Million) Forecast by Country, 2019 to 2034
Table 9: North America Market Value (US$ Million) Forecast by Hotel Type, 2019 to 2034
Table 10: North America Market Value (US$ Million) Forecast by Booking Channel, 2019 to 2034
Table 11: North America Market Value (US$ Million) Forecast by Tourist Type, 2019 to 2034
Table 12: North America Market Value (US$ Million) Forecast by Tour Type, 2019 to 2034
Table 13: North America Market Value (US$ Million) Forecast by Consumer Orientation, 2019 to 2034
Table 14: North America Market Value (US$ Million) Forecast by Age Group, 2019 to 2034
Table 15: Latin America Market Value (US$ Million) Forecast by Country, 2019 to 2034
Table 16: Latin America Market Value (US$ Million) Forecast by Hotel Type, 2019 to 2034
Table 17: Latin America Market Value (US$ Million) Forecast by Booking Channel, 2019 to 2034
Table 18: Latin America Market Value (US$ Million) Forecast by Tourist Type, 2019 to 2034
Table 19: Latin America Market Value (US$ Million) Forecast by Tour Type, 2019 to 2034
Table 20: Latin America Market Value (US$ Million) Forecast by Consumer Orientation, 2019 to 2034
Table 21: Latin America Market Value (US$ Million) Forecast by Age Group, 2019 to 2034
Table 22: Western Europe Market Value (US$ Million) Forecast by Country, 2019 to 2034
Table 23: Western Europe Market Value (US$ Million) Forecast by Hotel Type, 2019 to 2034
Table 24: Western Europe Market Value (US$ Million) Forecast by Booking Channel, 2019 to 2034
Table 25: Western Europe Market Value (US$ Million) Forecast by Tourist Type, 2019 to 2034
Table 26: Western Europe Market Value (US$ Million) Forecast by Tour Type, 2019 to 2034
Table 27: Western Europe Market Value (US$ Million) Forecast by Consumer Orientation, 2019 to 2034
Table 28: Western Europe Market Value (US$ Million) Forecast by Age Group, 2019 to 2034
Table 29: Eastern Europe Market Value (US$ Million) Forecast by Country, 2019 to 2034
Table 30: Eastern Europe Market Value (US$ Million) Forecast by Hotel Type, 2019 to 2034
Table 31: Eastern Europe Market Value (US$ Million) Forecast by Booking Channel, 2019 to 2034
Table 32: Eastern Europe Market Value (US$ Million) Forecast by Tourist Type, 2019 to 2034
Table 33: Eastern Europe Market Value (US$ Million) Forecast by Tour Type, 2019 to 2034
Table 34: Eastern Europe Market Value (US$ Million) Forecast by Consumer Orientation, 2019 to 2034
Table 35: Eastern Europe Market Value (US$ Million) Forecast by Age Group, 2019 to 2034
Table 36: South Asia and Pacific Market Value (US$ Million) Forecast by Country, 2019 to 2034
Table 37: South Asia and Pacific Market Value (US$ Million) Forecast by Hotel Type, 2019 to 2034
Table 38: South Asia and Pacific Market Value (US$ Million) Forecast by Booking Channel, 2019 to 2034
Table 39: South Asia and Pacific Market Value (US$ Million) Forecast by Tourist Type, 2019 to 2034
Table 40: South Asia and Pacific Market Value (US$ Million) Forecast by Tour Type, 2019 to 2034
Table 41: South Asia and Pacific Market Value (US$ Million) Forecast by Consumer Orientation, 2019 to 2034
Table 42: South Asia and Pacific Market Value (US$ Million) Forecast by Age Group, 2019 to 2034
Table 43: East Asia Market Value (US$ Million) Forecast by Country, 2019 to 2034
Table 44: East Asia Market Value (US$ Million) Forecast by Hotel Type, 2019 to 2034
Table 45: East Asia Market Value (US$ Million) Forecast by Booking Channel, 2019 to 2034
Table 46: East Asia Market Value (US$ Million) Forecast by Tourist Type, 2019 to 2034
Table 47: East Asia Market Value (US$ Million) Forecast by Tour Type, 2019 to 2034
Table 48: East Asia Market Value (US$ Million) Forecast by Consumer Orientation, 2019 to 2034
Table 49: East Asia Market Value (US$ Million) Forecast by Age Group, 2019 to 2034
Table 50: Middle East and Africa Market Value (US$ Million) Forecast by Country, 2019 to 2034
Table 51: Middle East and Africa Market Value (US$ Million) Forecast by Hotel Type, 2019 to 2034
Table 52: Middle East and Africa Market Value (US$ Million) Forecast by Booking Channel, 2019 to 2034
Table 53: Middle East and Africa Market Value (US$ Million) Forecast by Tourist Type, 2019 to 2034
Table 54: Middle East and Africa Market Value (US$ Million) Forecast by Tour Type, 2019 to 2034
Table 55: Middle East and Africa Market Value (US$ Million) Forecast by Consumer Orientation, 2019 to 2034
Table 56: Middle East and Africa Market Value (US$ Million) Forecast by Age Group, 2019 to 2034
Figure 1: Global Market Value (US$ Million) by Hotel Type, 2024 to 2034
Figure 2: Global Market Value (US$ Million) by Booking Channel, 2024 to 2034
Figure 3: Global Market Value (US$ Million) by Tourist Type, 2024 to 2034
Figure 4: Global Market Value (US$ Million) by Tour Type, 2024 to 2034
Figure 5: Global Market Value (US$ Million) by Consumer Orientation, 2024 to 2034
Figure 6: Global Market Value (US$ Million) by Age Group, 2024 to 2034
Figure 7: Global Market Value (US$ Million) by Region, 2024 to 2034
Figure 8: Global Market Value (US$ Million) Analysis by Region, 2019 to 2034
Figure 9: Global Market Value Share (%) and BPS Analysis by Region, 2024 to 2034
Figure 10: Global Market Y-o-Y Growth (%) Projections by Region, 2024 to 2034
Figure 11: Global Market Value (US$ Million) Analysis by Hotel Type, 2019 to 2034
Figure 12: Global Market Value Share (%) and BPS Analysis by Hotel Type, 2024 to 2034
Figure 13: Global Market Y-o-Y Growth (%) Projections by Hotel Type, 2024 to 2034
Figure 14: Global Market Value (US$ Million) Analysis by Booking Channel, 2019 to 2034
Figure 15: Global Market Value Share (%) and BPS Analysis by Booking Channel, 2024 to 2034
Figure 16: Global Market Y-o-Y Growth (%) Projections by Booking Channel, 2024 to 2034
Figure 17: Global Market Value (US$ Million) Analysis by Tourist Type, 2019 to 2034
Figure 18: Global Market Value Share (%) and BPS Analysis by Tourist Type, 2024 to 2034
Figure 19: Global Market Y-o-Y Growth (%) Projections by Tourist Type, 2024 to 2034
Figure 20: Global Market Value (US$ Million) Analysis by Tour Type, 2019 to 2034
Figure 21: Global Market Value Share (%) and BPS Analysis by Tour Type, 2024 to 2034
Figure 22: Global Market Y-o-Y Growth (%) Projections by Tour Type, 2024 to 2034
Figure 23: Global Market Value (US$ Million) Analysis by Consumer Orientation, 2019 to 2034
Figure 24: Global Market Value Share (%) and BPS Analysis by Consumer Orientation, 2024 to 2034
Figure 25: Global Market Y-o-Y Growth (%) Projections by Consumer Orientation, 2024 to 2034
Figure 26: Global Market Value (US$ Million) Analysis by Age Group, 2019 to 2034
Figure 27: Global Market Value Share (%) and BPS Analysis by Age Group, 2024 to 2034
Figure 28: Global Market Y-o-Y Growth (%) Projections by Age Group, 2024 to 2034
Figure 29: Global Market Attractiveness by Hotel Type, 2024 to 2034
Figure 30: Global Market Attractiveness by Booking Channel, 2024 to 2034
Figure 31: Global Market Attractiveness by Tourist Type, 2024 to 2034
Figure 32: Global Market Attractiveness by Tour Type, 2024 to 2034
Figure 33: Global Market Attractiveness by Consumer Orientation, 2024 to 2034
Figure 34: Global Market Attractiveness by Age Group, 2024 to 2034
Figure 35: Global Market Attractiveness by Region, 2024 to 2034
Figure 36: North America Market Value (US$ Million) by Hotel Type, 2024 to 2034
Figure 37: North America Market Value (US$ Million) by Booking Channel, 2024 to 2034
Figure 38: North America Market Value (US$ Million) by Tourist Type, 2024 to 2034
Figure 39: North America Market Value (US$ Million) by Tour Type, 2024 to 2034
Figure 40: North America Market Value (US$ Million) by Consumer Orientation, 2024 to 2034
Figure 41: North America Market Value (US$ Million) by Age Group, 2024 to 2034
Figure 42: North America Market Value (US$ Million) by Country, 2024 to 2034
Figure 43: North America Market Value (US$ Million) Analysis by Country, 2019 to 2034
Figure 44: North America Market Value Share (%) and BPS Analysis by Country, 2024 to 2034
Figure 45: North America Market Y-o-Y Growth (%) Projections by Country, 2024 to 2034
Figure 46: North America Market Value (US$ Million) Analysis by Hotel Type, 2019 to 2034
Figure 47: North America Market Value Share (%) and BPS Analysis by Hotel Type, 2024 to 2034
Figure 48: North America Market Y-o-Y Growth (%) Projections by Hotel Type, 2024 to 2034
Figure 49: North America Market Value (US$ Million) Analysis by Booking Channel, 2019 to 2034
Figure 50: North America Market Value Share (%) and BPS Analysis by Booking Channel, 2024 to 2034
Figure 51: North America Market Y-o-Y Growth (%) Projections by Booking Channel, 2024 to 2034
Figure 52: North America Market Value (US$ Million) Analysis by Tourist Type, 2019 to 2034
Figure 53: North America Market Value Share (%) and BPS Analysis by Tourist Type, 2024 to 2034
Figure 54: North America Market Y-o-Y Growth (%) Projections by Tourist Type, 2024 to 2034
Figure 55: North America Market Value (US$ Million) Analysis by Tour Type, 2019 to 2034
Figure 56: North America Market Value Share (%) and BPS Analysis by Tour Type, 2024 to 2034
Figure 57: North America Market Y-o-Y Growth (%) Projections by Tour Type, 2024 to 2034
Figure 58: North America Market Value (US$ Million) Analysis by Consumer Orientation, 2019 to 2034
Figure 59: North America Market Value Share (%) and BPS Analysis by Consumer Orientation, 2024 to 2034
Figure 60: North America Market Y-o-Y Growth (%) Projections by Consumer Orientation, 2024 to 2034
Figure 61: North America Market Value (US$ Million) Analysis by Age Group, 2019 to 2034
Figure 62: North America Market Value Share (%) and BPS Analysis by Age Group, 2024 to 2034
Figure 63: North America Market Y-o-Y Growth (%) Projections by Age Group, 2024 to 2034
Figure 64: North America Market Attractiveness by Hotel Type, 2024 to 2034
Figure 65: North America Market Attractiveness by Booking Channel, 2024 to 2034
Figure 66: North America Market Attractiveness by Tourist Type, 2024 to 2034
Figure 67: North America Market Attractiveness by Tour Type, 2024 to 2034
Figure 68: North America Market Attractiveness by Consumer Orientation, 2024 to 2034
Figure 69: North America Market Attractiveness by Age Group, 2024 to 2034
Figure 70: North America Market Attractiveness by Country, 2024 to 2034
Figure 71: Latin America Market Value (US$ Million) by Hotel Type, 2024 to 2034
Figure 72: Latin America Market Value (US$ Million) by Booking Channel, 2024 to 2034
Figure 73: Latin America Market Value (US$ Million) by Tourist Type, 2024 to 2034
Figure 74: Latin America Market Value (US$ Million) by Tour Type, 2024 to 2034
Figure 75: Latin America Market Value (US$ Million) by Consumer Orientation, 2024 to 2034
Figure 76: Latin America Market Value (US$ Million) by Age Group, 2024 to 2034
Figure 77: Latin America Market Value (US$ Million) by Country, 2024 to 2034
Figure 78: Latin America Market Value (US$ Million) Analysis by Country, 2019 to 2034
Figure 79: Latin America Market Value Share (%) and BPS Analysis by Country, 2024 to 2034
Figure 80: Latin America Market Y-o-Y Growth (%) Projections by Country, 2024 to 2034
Figure 81: Latin America Market Value (US$ Million) Analysis by Hotel Type, 2019 to 2034
Figure 82: Latin America Market Value Share (%) and BPS Analysis by Hotel Type, 2024 to 2034
Figure 83: Latin America Market Y-o-Y Growth (%) Projections by Hotel Type, 2024 to 2034
Figure 84: Latin America Market Value (US$ Million) Analysis by Booking Channel, 2019 to 2034
Figure 85: Latin America Market Value Share (%) and BPS Analysis by Booking Channel, 2024 to 2034
Figure 86: Latin America Market Y-o-Y Growth (%) Projections by Booking Channel, 2024 to 2034
Figure 87: Latin America Market Value (US$ Million) Analysis by Tourist Type, 2019 to 2034
Figure 88: Latin America Market Value Share (%) and BPS Analysis by Tourist Type, 2024 to 2034
Figure 89: Latin America Market Y-o-Y Growth (%) Projections by Tourist Type, 2024 to 2034
Figure 90: Latin America Market Value (US$ Million) Analysis by Tour Type, 2019 to 2034
Figure 91: Latin America Market Value Share (%) and BPS Analysis by Tour Type, 2024 to 2034
Figure 92: Latin America Market Y-o-Y Growth (%) Projections by Tour Type, 2024 to 2034
Figure 93: Latin America Market Value (US$ Million) Analysis by Consumer Orientation, 2019 to 2034
Figure 94: Latin America Market Value Share (%) and BPS Analysis by Consumer Orientation, 2024 to 2034
Figure 95: Latin America Market Y-o-Y Growth (%) Projections by Consumer Orientation, 2024 to 2034
Figure 96: Latin America Market Value (US$ Million) Analysis by Age Group, 2019 to 2034
Figure 97: Latin America Market Value Share (%) and BPS Analysis by Age Group, 2024 to 2034
Figure 98: Latin America Market Y-o-Y Growth (%) Projections by Age Group, 2024 to 2034
Figure 99: Latin America Market Attractiveness by Hotel Type, 2024 to 2034
Figure 100: Latin America Market Attractiveness by Booking Channel, 2024 to 2034
Figure 101: Latin America Market Attractiveness by Tourist Type, 2024 to 2034
Figure 102: Latin America Market Attractiveness by Tour Type, 2024 to 2034
Figure 103: Latin America Market Attractiveness by Consumer Orientation, 2024 to 2034
Figure 104: Latin America Market Attractiveness by Age Group, 2024 to 2034
Figure 105: Latin America Market Attractiveness by Country, 2024 to 2034
Figure 106: Western Europe Market Value (US$ Million) by Hotel Type, 2024 to 2034
Figure 107: Western Europe Market Value (US$ Million) by Booking Channel, 2024 to 2034
Figure 108: Western Europe Market Value (US$ Million) by Tourist Type, 2024 to 2034
Figure 109: Western Europe Market Value (US$ Million) by Tour Type, 2024 to 2034
Figure 110: Western Europe Market Value (US$ Million) by Consumer Orientation, 2024 to 2034
Figure 111: Western Europe Market Value (US$ Million) by Age Group, 2024 to 2034
Figure 112: Western Europe Market Value (US$ Million) by Country, 2024 to 2034
Figure 113: Western Europe Market Value (US$ Million) Analysis by Country, 2019 to 2034
Figure 114: Western Europe Market Value Share (%) and BPS Analysis by Country, 2024 to 2034
Figure 115: Western Europe Market Y-o-Y Growth (%) Projections by Country, 2024 to 2034
Figure 116: Western Europe Market Value (US$ Million) Analysis by Hotel Type, 2019 to 2034
Figure 117: Western Europe Market Value Share (%) and BPS Analysis by Hotel Type, 2024 to 2034
Figure 118: Western Europe Market Y-o-Y Growth (%) Projections by Hotel Type, 2024 to 2034
Figure 119: Western Europe Market Value (US$ Million) Analysis by Booking Channel, 2019 to 2034
Figure 120: Western Europe Market Value Share (%) and BPS Analysis by Booking Channel, 2024 to 2034
Figure 121: Western Europe Market Y-o-Y Growth (%) Projections by Booking Channel, 2024 to 2034
Figure 122: Western Europe Market Value (US$ Million) Analysis by Tourist Type, 2019 to 2034
Figure 123: Western Europe Market Value Share (%) and BPS Analysis by Tourist Type, 2024 to 2034
Figure 124: Western Europe Market Y-o-Y Growth (%) Projections by Tourist Type, 2024 to 2034
Figure 125: Western Europe Market Value (US$ Million) Analysis by Tour Type, 2019 to 2034
Figure 126: Western Europe Market Value Share (%) and BPS Analysis by Tour Type, 2024 to 2034
Figure 127: Western Europe Market Y-o-Y Growth (%) Projections by Tour Type, 2024 to 2034
Figure 128: Western Europe Market Value (US$ Million) Analysis by Consumer Orientation, 2019 to 2034
Figure 129: Western Europe Market Value Share (%) and BPS Analysis by Consumer Orientation, 2024 to 2034
Figure 130: Western Europe Market Y-o-Y Growth (%) Projections by Consumer Orientation, 2024 to 2034
Figure 131: Western Europe Market Value (US$ Million) Analysis by Age Group, 2019 to 2034
Figure 132: Western Europe Market Value Share (%) and BPS Analysis by Age Group, 2024 to 2034
Figure 133: Western Europe Market Y-o-Y Growth (%) Projections by Age Group, 2024 to 2034
Figure 134: Western Europe Market Attractiveness by Hotel Type, 2024 to 2034
Figure 135: Western Europe Market Attractiveness by Booking Channel, 2024 to 2034
Figure 136: Western Europe Market Attractiveness by Tourist Type, 2024 to 2034
Figure 137: Western Europe Market Attractiveness by Tour Type, 2024 to 2034
Figure 138: Western Europe Market Attractiveness by Consumer Orientation, 2024 to 2034
Figure 139: Western Europe Market Attractiveness by Age Group, 2024 to 2034
Figure 140: Western Europe Market Attractiveness by Country, 2024 to 2034
Figure 141: Eastern Europe Market Value (US$ Million) by Hotel Type, 2024 to 2034
Figure 142: Eastern Europe Market Value (US$ Million) by Booking Channel, 2024 to 2034
Figure 143: Eastern Europe Market Value (US$ Million) by Tourist Type, 2024 to 2034
Figure 144: Eastern Europe Market Value (US$ Million) by Tour Type, 2024 to 2034
Figure 145: Eastern Europe Market Value (US$ Million) by Consumer Orientation, 2024 to 2034
Figure 146: Eastern Europe Market Value (US$ Million) by Age Group, 2024 to 2034
Figure 147: Eastern Europe Market Value (US$ Million) by Country, 2024 to 2034
Figure 148: Eastern Europe Market Value (US$ Million) Analysis by Country, 2019 to 2034
Figure 149: Eastern Europe Market Value Share (%) and BPS Analysis by Country, 2024 to 2034
Figure 150: Eastern Europe Market Y-o-Y Growth (%) Projections by Country, 2024 to 2034
Figure 151: Eastern Europe Market Value (US$ Million) Analysis by Hotel Type, 2019 to 2034
Figure 152: Eastern Europe Market Value Share (%) and BPS Analysis by Hotel Type, 2024 to 2034
Figure 153: Eastern Europe Market Y-o-Y Growth (%) Projections by Hotel Type, 2024 to 2034
Figure 154: Eastern Europe Market Value (US$ Million) Analysis by Booking Channel, 2019 to 2034
Figure 155: Eastern Europe Market Value Share (%) and BPS Analysis by Booking Channel, 2024 to 2034
Figure 156: Eastern Europe Market Y-o-Y Growth (%) Projections by Booking Channel, 2024 to 2034
Figure 157: Eastern Europe Market Value (US$ Million) Analysis by Tourist Type, 2019 to 2034
Figure 158: Eastern Europe Market Value Share (%) and BPS Analysis by Tourist Type, 2024 to 2034
Figure 159: Eastern Europe Market Y-o-Y Growth (%) Projections by Tourist Type, 2024 to 2034
Figure 160: Eastern Europe Market Value (US$ Million) Analysis by Tour Type, 2019 to 2034
Figure 161: Eastern Europe Market Value Share (%) and BPS Analysis by Tour Type, 2024 to 2034
Figure 162: Eastern Europe Market Y-o-Y Growth (%) Projections by Tour Type, 2024 to 2034
Figure 163: Eastern Europe Market Value (US$ Million) Analysis by Consumer Orientation, 2019 to 2034
Figure 164: Eastern Europe Market Value Share (%) and BPS Analysis by Consumer Orientation, 2024 to 2034
Figure 165: Eastern Europe Market Y-o-Y Growth (%) Projections by Consumer Orientation, 2024 to 2034
Figure 166: Eastern Europe Market Value (US$ Million) Analysis by Age Group, 2019 to 2034
Figure 167: Eastern Europe Market Value Share (%) and BPS Analysis by Age Group, 2024 to 2034
Figure 168: Eastern Europe Market Y-o-Y Growth (%) Projections by Age Group, 2024 to 2034
Figure 169: Eastern Europe Market Attractiveness by Hotel Type, 2024 to 2034
Figure 170: Eastern Europe Market Attractiveness by Booking Channel, 2024 to 2034
Figure 171: Eastern Europe Market Attractiveness by Tourist Type, 2024 to 2034
Figure 172: Eastern Europe Market Attractiveness by Tour Type, 2024 to 2034
Figure 173: Eastern Europe Market Attractiveness by Consumer Orientation, 2024 to 2034
Figure 174: Eastern Europe Market Attractiveness by Age Group, 2024 to 2034
Figure 175: Eastern Europe Market Attractiveness by Country, 2024 to 2034
Figure 176: South Asia and Pacific Market Value (US$ Million) by Hotel Type, 2024 to 2034
Figure 177: South Asia and Pacific Market Value (US$ Million) by Booking Channel, 2024 to 2034
Figure 178: South Asia and Pacific Market Value (US$ Million) by Tourist Type, 2024 to 2034
Figure 179: South Asia and Pacific Market Value (US$ Million) by Tour Type, 2024 to 2034
Figure 180: South Asia and Pacific Market Value (US$ Million) by Consumer Orientation, 2024 to 2034
Figure 181: South Asia and Pacific Market Value (US$ Million) by Age Group, 2024 to 2034
Figure 182: South Asia and Pacific Market Value (US$ Million) by Country, 2024 to 2034
Figure 183: South Asia and Pacific Market Value (US$ Million) Analysis by Country, 2019 to 2034
Figure 184: South Asia and Pacific Market Value Share (%) and BPS Analysis by Country, 2024 to 2034
Figure 185: South Asia and Pacific Market Y-o-Y Growth (%) Projections by Country, 2024 to 2034
Figure 186: South Asia and Pacific Market Value (US$ Million) Analysis by Hotel Type, 2019 to 2034
Figure 187: South Asia and Pacific Market Value Share (%) and BPS Analysis by Hotel Type, 2024 to 2034
Figure 188: South Asia and Pacific Market Y-o-Y Growth (%) Projections by Hotel Type, 2024 to 2034
Figure 189: South Asia and Pacific Market Value (US$ Million) Analysis by Booking Channel, 2019 to 2034
Figure 190: South Asia and Pacific Market Value Share (%) and BPS Analysis by Booking Channel, 2024 to 2034
Figure 191: South Asia and Pacific Market Y-o-Y Growth (%) Projections by Booking Channel, 2024 to 2034
Figure 192: South Asia and Pacific Market Value (US$ Million) Analysis by Tourist Type, 2019 to 2034
Figure 193: South Asia and Pacific Market Value Share (%) and BPS Analysis by Tourist Type, 2024 to 2034
Figure 194: South Asia and Pacific Market Y-o-Y Growth (%) Projections by Tourist Type, 2024 to 2034
Figure 195: South Asia and Pacific Market Value (US$ Million) Analysis by Tour Type, 2019 to 2034
Figure 196: South Asia and Pacific Market Value Share (%) and BPS Analysis by Tour Type, 2024 to 2034
Figure 197: South Asia and Pacific Market Y-o-Y Growth (%) Projections by Tour Type, 2024 to 2034
Figure 198: South Asia and Pacific Market Value (US$ Million) Analysis by Consumer Orientation, 2019 to 2034
Figure 199: South Asia and Pacific Market Value Share (%) and BPS Analysis by Consumer Orientation, 2024 to 2034
Figure 200: South Asia and Pacific Market Y-o-Y Growth (%) Projections by Consumer Orientation, 2024 to 2034
Figure 201: South Asia and Pacific Market Value (US$ Million) Analysis by Age Group, 2019 to 2034
Figure 202: South Asia and Pacific Market Value Share (%) and BPS Analysis by Age Group, 2024 to 2034
Figure 203: South Asia and Pacific Market Y-o-Y Growth (%) Projections by Age Group, 2024 to 2034
Figure 204: South Asia and Pacific Market Attractiveness by Hotel Type, 2024 to 2034
Figure 205: South Asia and Pacific Market Attractiveness by Booking Channel, 2024 to 2034
Figure 206: South Asia and Pacific Market Attractiveness by Tourist Type, 2024 to 2034
Figure 207: South Asia and Pacific Market Attractiveness by Tour Type, 2024 to 2034
Figure 208: South Asia and Pacific Market Attractiveness by Consumer Orientation, 2024 to 2034
Figure 209: South Asia and Pacific Market Attractiveness by Age Group, 2024 to 2034
Figure 210: South Asia and Pacific Market Attractiveness by Country, 2024 to 2034
Figure 211: East Asia Market Value (US$ Million) by Hotel Type, 2024 to 2034
Figure 212: East Asia Market Value (US$ Million) by Booking Channel, 2024 to 2034
Figure 213: East Asia Market Value (US$ Million) by Tourist Type, 2024 to 2034
Figure 214: East Asia Market Value (US$ Million) by Tour Type, 2024 to 2034
Figure 215: East Asia Market Value (US$ Million) by Consumer Orientation, 2024 to 2034
Figure 216: East Asia Market Value (US$ Million) by Age Group, 2024 to 2034
Figure 217: East Asia Market Value (US$ Million) by Country, 2024 to 2034
Figure 218: East Asia Market Value (US$ Million) Analysis by Country, 2019 to 2034
Figure 219: East Asia Market Value Share (%) and BPS Analysis by Country, 2024 to 2034
Figure 220: East Asia Market Y-o-Y Growth (%) Projections by Country, 2024 to 2034
Figure 221: East Asia Market Value (US$ Million) Analysis by Hotel Type, 2019 to 2034
Figure 222: East Asia Market Value Share (%) and BPS Analysis by Hotel Type, 2024 to 2034
Figure 223: East Asia Market Y-o-Y Growth (%) Projections by Hotel Type, 2024 to 2034
Figure 224: East Asia Market Value (US$ Million) Analysis by Booking Channel, 2019 to 2034
Figure 225: East Asia Market Value Share (%) and BPS Analysis by Booking Channel, 2024 to 2034
Figure 226: East Asia Market Y-o-Y Growth (%) Projections by Booking Channel, 2024 to 2034
Figure 227: East Asia Market Value (US$ Million) Analysis by Tourist Type, 2019 to 2034
Figure 228: East Asia Market Value Share (%) and BPS Analysis by Tourist Type, 2024 to 2034
Figure 229: East Asia Market Y-o-Y Growth (%) Projections by Tourist Type, 2024 to 2034
Figure 230: East Asia Market Value (US$ Million) Analysis by Tour Type, 2019 to 2034
Figure 231: East Asia Market Value Share (%) and BPS Analysis by Tour Type, 2024 to 2034
Figure 232: East Asia Market Y-o-Y Growth (%) Projections by Tour Type, 2024 to 2034
Figure 233: East Asia Market Value (US$ Million) Analysis by Consumer Orientation, 2019 to 2034
Figure 234: East Asia Market Value Share (%) and BPS Analysis by Consumer Orientation, 2024 to 2034
Figure 235: East Asia Market Y-o-Y Growth (%) Projections by Consumer Orientation, 2024 to 2034
Figure 236: East Asia Market Value (US$ Million) Analysis by Age Group, 2019 to 2034
Figure 237: East Asia Market Value Share (%) and BPS Analysis by Age Group, 2024 to 2034
Figure 238: East Asia Market Y-o-Y Growth (%) Projections by Age Group, 2024 to 2034
Figure 239: East Asia Market Attractiveness by Hotel Type, 2024 to 2034
Figure 240: East Asia Market Attractiveness by Booking Channel, 2024 to 2034
Figure 241: East Asia Market Attractiveness by Tourist Type, 2024 to 2034
Figure 242: East Asia Market Attractiveness by Tour Type, 2024 to 2034
Figure 243: East Asia Market Attractiveness by Consumer Orientation, 2024 to 2034
Figure 244: East Asia Market Attractiveness by Age Group, 2024 to 2034
Figure 245: East Asia Market Attractiveness by Country, 2024 to 2034
Figure 246: Middle East and Africa Market Value (US$ Million) by Hotel Type, 2024 to 2034
Figure 247: Middle East and Africa Market Value (US$ Million) by Booking Channel, 2024 to 2034
Figure 248: Middle East and Africa Market Value (US$ Million) by Tourist Type, 2024 to 2034
Figure 249: Middle East and Africa Market Value (US$ Million) by Tour Type, 2024 to 2034
Figure 250: Middle East and Africa Market Value (US$ Million) by Consumer Orientation, 2024 to 2034
Figure 251: Middle East and Africa Market Value (US$ Million) by Age Group, 2024 to 2034
Figure 252: Middle East and Africa Market Value (US$ Million) by Country, 2024 to 2034
Figure 253: Middle East and Africa Market Value (US$ Million) Analysis by Country, 2019 to 2034
Figure 254: Middle East and Africa Market Value Share (%) and BPS Analysis by Country, 2024 to 2034
Figure 255: Middle East and Africa Market Y-o-Y Growth (%) Projections by Country, 2024 to 2034
Figure 256: Middle East and Africa Market Value (US$ Million) Analysis by Hotel Type, 2019 to 2034
Figure 257: Middle East and Africa Market Value Share (%) and BPS Analysis by Hotel Type, 2024 to 2034
Figure 258: Middle East and Africa Market Y-o-Y Growth (%) Projections by Hotel Type, 2024 to 2034
Figure 259: Middle East and Africa Market Value (US$ Million) Analysis by Booking Channel, 2019 to 2034
Figure 260: Middle East and Africa Market Value Share (%) and BPS Analysis by Booking Channel, 2024 to 2034
Figure 261: Middle East and Africa Market Y-o-Y Growth (%) Projections by Booking Channel, 2024 to 2034
Figure 262: Middle East and Africa Market Value (US$ Million) Analysis by Tourist Type, 2019 to 2034
Figure 263: Middle East and Africa Market Value Share (%) and BPS Analysis by Tourist Type, 2024 to 2034
Figure 264: Middle East and Africa Market Y-o-Y Growth (%) Projections by Tourist Type, 2024 to 2034
Figure 265: Middle East and Africa Market Value (US$ Million) Analysis by Tour Type, 2019 to 2034
Figure 266: Middle East and Africa Market Value Share (%) and BPS Analysis by Tour Type, 2024 to 2034
Figure 267: Middle East and Africa Market Y-o-Y Growth (%) Projections by Tour Type, 2024 to 2034
Figure 268: Middle East and Africa Market Value (US$ Million) Analysis by Consumer Orientation, 2019 to 2034
Figure 269: Middle East and Africa Market Value Share (%) and BPS Analysis by Consumer Orientation, 2024 to 2034
Figure 270: Middle East and Africa Market Y-o-Y Growth (%) Projections by Consumer Orientation, 2024 to 2034
Figure 271: Middle East and Africa Market Value (US$ Million) Analysis by Age Group, 2019 to 2034
Figure 272: Middle East and Africa Market Value Share (%) and BPS Analysis by Age Group, 2024 to 2034
Figure 273: Middle East and Africa Market Y-o-Y Growth (%) Projections by Age Group, 2024 to 2034
Figure 274: Middle East and Africa Market Attractiveness by Hotel Type, 2024 to 2034
Figure 275: Middle East and Africa Market Attractiveness by Booking Channel, 2024 to 2034
Figure 276: Middle East and Africa Market Attractiveness by Tourist Type, 2024 to 2034
Figure 277: Middle East and Africa Market Attractiveness by Tour Type, 2024 to 2034
Figure 278: Middle East and Africa Market Attractiveness by Consumer Orientation, 2024 to 2034
Figure 279: Middle East and Africa Market Attractiveness by Age Group, 2024 to 2034
Figure 280: Middle East and Africa Market Attractiveness by Country, 2024 to 2034
For 2024, the boutique hotel market is estimated to be valued at USD 9,962.60 million.
The adoption rate of boutique hotels is calculated to be around 6.9% during the forecast period.
The boutique hotel market revenue is expected to shoot up to USD 19,415.50 million by 2034.
Package traveler tour type is extensively opted for by customers of boutique hotels.
India is offering significant growth opportunities to boutique hotel businesses.
Nine Hours, Container Hotels, and Tubohotel are influential players in the boutique hotel industry.
Explore Hospitality Insights
Thank you!
You will receive an email from our Business Development Manager. Please be sure to check your SPAM/JUNK folder too.